Estimated zip code population in 2022: 1,578 Zip code population in 2010: 1,606 Zip code population in 2000: 1,433
Houses and condos: 781 Renter-occupied apartments: 166
% of renters here:
23%
State:
33%
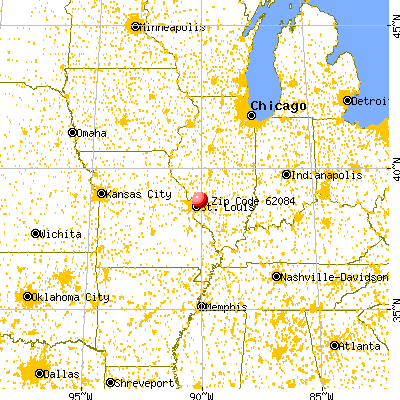
March 2022 cost of living index in zip code 62084: 94.1 (less than average, U.S. average is 100)
Land area: 5.3 sq. mi. Water area: 0.2 sq. mi.
Population density: 299 people per square mile
(very low).
OSM Map
General Map
Google Map
MSN Map
OSM Map
General Map
Google Map
MSN Map
OSM Map
General Map
Google Map
MSN Map
OSM Map
General Map
Google Map
MSN Map
Please wait while loading the map...
Real estate property taxes paid for housing units in 2022:
This zip code:
1.3% ($1,336)
Illinois:
2.0% ($4,912)
Median real estate property taxes paid for housing units with mortgages in 2022: $1,315 (1.2%) Median real estate property taxes paid for housing units with no mortgage in 2022: $1,367 (1.6%)
Business Search- 14 Million verified businesses
Males: 751
(47.6%)
Females: 827
(52.4%)
For population 25 years and over in 62084:
High school or higher: 95.3%
Bachelor's degree or higher: 20.4%
Graduate or professional degree: 5.9%
Unemployed: 2.4%
Mean travel time to work (commute): 20.6 minutes
For population 15 years and over in 62084:
Never married: 23.6%
Now married: 59.5%
Separated: 1.3%
Widowed: 6.3%
Divorced: 9.3%
Zip code 62084 compared to state average:
Median house value significantly below state average.
Unemployed percentage below state average.
Black race population percentage significantly below state average.
Hispanic race population percentage significantly below state average.
Foreign-born population percentage significantly below state average.
Length of stay since moving in significantly above state average.
House age above state average.
Percentage of population with a bachelor's degree or higher below state average.
Estimated median house/condo value in 2022: $99,861
62084:
$99,861
Illinois:
$251,600
According to our research of Illinois and other state lists, there were 2 registered sex offenders living in 62084 zip code as of May 28, 2024. The ratio of all residents to sex offenders in zip code 62084 is 886 to 1. The ratio of registered sex offenders to all residents in this zip code is near the state average.
Median resident age:
This zip code:
40.6 years
Illinois median age:
39.1 years
Average household size:
This zip code:
2.2 people
Illinois:
2.4 people
Averages for the 2020 tax year for zip code 62084, filed in 2021:
Average Adjusted Gross Income (AGI) in 2020: $45,583 (Individual Income Tax Returns)
Here:
$45,583
State:
$82,626
Salary/wage: $43,011 (reported on 78.9% of returns)
Here:
$43,011
State:
$66,640
(% of AGI for various income ranges: 1177.2% for AGIs below $25k, 3419.4% for AGIs $25k-50k, 5744.4% for AGIs $50k-75k, 9262.5% for AGIs $75k-100k, 19052.5% for AGIs $100k-200k)
Taxable interest for individuals: $356 (reported on 25.4% of returns)
This zip code:
$356
Illinois:
$2,376
(% of AGI for various income ranges: 9.4% for AGIs below $25k, 8.1% for AGIs $25k-50k, 12.2% for AGIs $50k-75k, 5.0% for AGIs $75k-100k, 52.5% for AGIs $100k-200k)
Ordinary dividends: $1,638 (reported on 11.3% of returns)
Here:
$1,638
State:
$9,061
(% of AGI for various income ranges: 63.7% for AGIs $25k-50k, 72.5% for AGIs $75k-100k)
Net capital gain/loss in AGI: +$2,400 (reported on 8.5% of returns)
Here:
+$2,400
State:
+$31,684
(% of AGI for various income ranges: 30.0% for AGIs below $25k, 100.0% for AGIs $50k-75k)
Profit/loss from business: +$5,920 (reported on 7.0% of returns)
Here:
+$5,920
State:
+$12,175
(% of AGI for various income ranges: 124.4% for AGIs below $25k, 80.0% for AGIs $50k-75k)
Taxable individual retirement arrangement distribution: $14,533 (reported on 4.2% of returns)
62084:
$14,533
Illinois:
$21,613
(% of AGI for various income ranges: 272.5% for AGIs $25k-50k)
Earned income credit: $2,383 (reported on 16.9% of returns)
Here:
$2,383
State:
$2,311
(% of AGI for various income ranges: 84.4% for AGIs below $25k, 83.8% for AGIs $25k-50k)
Percentage of individuals using paid preparers for their 2020 taxes: 95.8%
Here:
96%
State:
93%
(% for various income ranges: 96.2% for AGIs below $25k, 95.2% for AGIs $25k-50k, 90.9% for AGIs $50k-75k, 100.0% for AGIs $75k-100k, 100.0% for AGIs $100k-200k)
Averages for the 2012 tax year for zip code 62084, filed in 2013:
Average Adjusted Gross Income (AGI) in 2012: $42,056 (Individual Income Tax Returns)
Here:
$42,056
State:
$68,058
Salary/wage: $40,097 (reported on 82.9% of returns)
Here:
$40,097
State:
$55,396
(% of AGI for various income ranges: 75.5% for AGIs below $25k, 70.4% for AGIs $25k-50k, 77.4% for AGIs $50k-75k, 88.8% for AGIs $75k-100k, 84.0% for AGIs $100k-200k)
Taxable interest for individuals: $589 (reported on 25.7% of returns)
This zip code:
$589
Illinois:
$1,969
(% of AGI for various income ranges: 0.3% for AGIs below $25k, 0.7% for AGIs $25k-50k, 0.4% for AGIs $50k-75k, 0.3% for AGIs $100k-200k)
Ordinary dividends: $1,822 (reported on 12.9% of returns)
Here:
$1,822
State:
$7,786
(% of AGI for various income ranges: 1.1% for AGIs below $25k, 1.4% for AGIs $50k-75k, 0.3% for AGIs $75k-100k)
Net capital gain/loss in AGI: +$275 (reported on 5.7% of returns)
Here:
+$275
State:
+$22,183
Profit/loss from business: +$3,186 (reported on 10.0% of returns)
Here:
+$3,186
State:
+$12,903
Taxable individual retirement arrangement distribution: $8,333 (reported on 8.6% of returns)
62084:
$8,333
Illinois:
$17,929
Total itemized deductions: $14,945 (21% of AGI, reported on 15.7% of returns)
Here:
$14,945
State:
$26,433
Here:
20.6% of AGI
State:
19.2% of AGI
(% of AGI for various income ranges: 6.8% for AGIs $25k-50k, 5.1% for AGIs $50k-75k, 6.5% for AGIs $75k-100k, 7.2% for AGIs $100k-200k)
Charity contributions: $3,538 (reported on 11.4% of returns)
Here:
$3,538
State:
$4,525
Taxes paid: $5,436 (reported on 15.7% of returns)
62084:
$5,436
State:
$11,968
(% of AGI for various income ranges: 1.6% for AGIs $25k-50k, 1.5% for AGIs $50k-75k, 2.8% for AGIs $75k-100k, 3.5% for AGIs $100k-200k)
Earned income credit: $2,333 (reported on 17.1% of returns)
Here:
$2,333
State:
$2,349
(% of AGI for various income ranges: 6.2% for AGIs below $25k, 0.9% for AGIs $25k-50k)
Percentage of individuals using paid preparers for their 2012 taxes: 55.7%
Here:
56%
State:
57%
(% for various income ranges: 42.9% for AGIs below $25k, 57.9% for AGIs $25k-50k, 66.7% for AGIs $50k-75k, 66.7% for AGIs $75k-100k, 80.0% for AGIs $100k-200k)
Averages for the 2004 tax year for zip code 62084, filed in 2005:
Average Adjusted Gross Income (AGI) in 2004: $35,069 (Individual Income Tax Returns)
Here:
$35,069
State:
$54,625
Salary/wage: $33,558 (reported on 83.3% of returns)
Here:
$33,558
State:
$46,811
(% of AGI for various income ranges: 83.1% for AGIs below $10k, 70.4% for AGIs $10k-25k, 79.6% for AGIs $25k-50k, 85.8% for AGIs $50k-75k, 80.6% for AGIs $75k-100k, 73.1% for AGIs over 100k)
Taxable interest for individuals: $803 (reported on 41.0% of returns)
This zip code:
$803
Illinois:
$2,101
(% of AGI for various income ranges: 3.9% for AGIs below $10k, 1.8% for AGIs $10k-25k, 1.3% for AGIs $25k-50k, 0.4% for AGIs $50k-75k, 0.4% for AGIs $75k-100k, 0.6% for AGIs over 100k)
Taxable dividends: $1,139 (reported on 16.4% of returns)
Here:
$1,139
State:
$4,306
(% of AGI for various income ranges: 2.2% for AGIs below $10k, 0.5% for AGIs $10k-25k, 0.8% for AGIs $25k-50k, 0.4% for AGIs $50k-75k, 0.6% for AGIs $75k-100k, 0.0% for AGIs over 100k)
Net capital gain/loss: +$43 (reported on 9.3% of returns)
Here:
+$43
State:
+$17,321
(% of AGI for various income ranges: -1.1% for AGIs below $10k, 0.3% for AGIs $25k-50k, -0.1% for AGIs $50k-75k, -0.2% for AGIs $75k-100k)
Profit/loss from business: +$3,508 (reported on 8.2% of returns)
Here:
+$3,508
State:
+$11,771
(% of AGI for various income ranges: 4.7% for AGIs below $10k, 2.7% for AGIs $10k-25k, 0.8% for AGIs $25k-50k, 0.1% for AGIs $50k-75k, 0.6% for AGIs $75k-100k)
Total itemized deductions: $13,206 (22% of AGI, reported on 17.0% of returns)
Here:
$13,206
State:
$20,239
Here:
21.9% of AGI
State:
19.5% of AGI
(% of AGI for various income ranges: 17.9% for AGIs below $10k, 7.5% for AGIs $25k-50k, 5.1% for AGIs $50k-75k, 7.1% for AGIs $75k-100k, 10.7% for AGIs over 100k)
Charity contributions deductions: $3,336 (6% of AGI, reported on 14.4% of returns)
Here:
$3,336
State:
$3,719
Here:
5.6% of AGI
State:
3.4% of AGI
(% of AGI for various income ranges: 4.0% for AGIs below $10k, 1.2% for AGIs $25k-50k, 1.3% for AGIs $50k-75k, 2.2% for AGIs $75k-100k, 2.0% for AGIs over 100k)
Total tax: $4,170 (reported on 73.6% of returns)
62084:
$4,170
State:
$9,882
(% of AGI for various income ranges: 1.9% for AGIs below $10k, 3.4% for AGIs $10k-25k, 7.2% for AGIs $25k-50k, 8.8% for AGIs $50k-75k, 10.8% for AGIs $75k-100k, 16.7% for AGIs over 100k)
Earned income credit: $1,723 (reported on 17.5% of returns)
Here:
$1,723
State:
$1,788
Percentage of individuals using paid preparers for their 2004 taxes: 67.9%
Here:
68%
State:
61%
(% for various income ranges: 59.9% for AGIs below $10k, 69.8% for AGIs $10k-25k, 69.0% for AGIs $25k-50k, 68.7% for AGIs $50k-75k, 71.4% for AGIs $75k-100k, 80.0% for AGIs over 100k)
Likely homosexual households (counted as self-reported same-sex unmarried-partner households)
Lesbian couples: 0.0% of all households
Gay men: 1.5% of all households
Household received Food Stamps/SNAP in the past 12 months: 121 Household did not receive Food Stamps/SNAP in the past 12 months: 598
Women who had a birth in the past 12 months: 20 (7 now married, 12 unmarried) Women who did not have a birth in the past 12 months: 328 (160 now married, 167 unmarried)
Housing units in zip code 62084 with a mortgage: 363 (56 second mortgage, 53 both second mortgage and home equity loan) Houses without a mortgage: 56
Median monthly owner costs for units with a mortgage: $973 Median monthly owner costs for units without a mortgage: $429
Residents with income below the poverty level in 2022:
This zip code:
18.1%
Whole state:
11.9%
Residents with income below 50% of the poverty level in 2022:
This zip code:
8.6%
Whole state:
5.7%
Median number of rooms in houses and condos:
Here:
5.9
State:
6.4
Median number of rooms in apartments:
Here:
4.6
State:
4.1
Notable locations in this zip code not listed on our city pages
Size of family households: 247 2-persons, 159 3-persons, 62 4-persons, 15 5-persons, 7 6-persons, 5 7-or-more-persons
Size of nonfamily households: 170 1-person, 45 2-persons, 4 5-persons
181 married couples with children.
140 single-parent households (18 men, 122 women).
97.9% of residents of 62084 zip code speak English at home.
1.0% of residents speak other Indo-European language at home (79% very well, 21% well).
0.4% of residents speak Asian or Pacific Island language at home (33% very well, 67% well).
Foreign born population: 21 (1.3%) (85.8% of them are naturalized citizens)
This zip code:
1.3%
Whole state:
14.4%
29%Malaysia
14%Serbia
23%Irish
22%German
15%American
10%Italian
9%English
4%French
3%European
Year of entry for the foreign-born population
02010 or later
92000 to 2009
21990 to 1999
6Before 1990
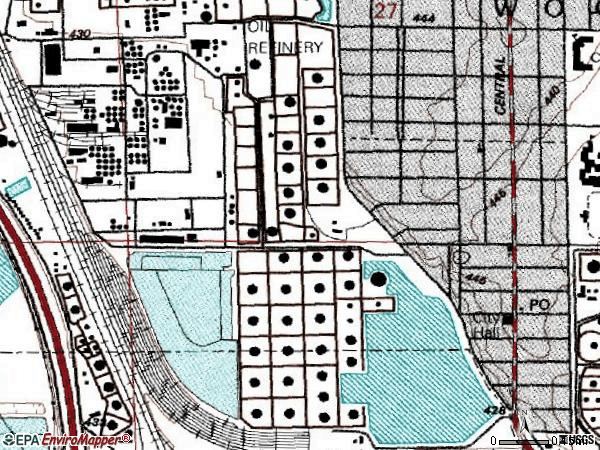
Facilities with environmental interests located in this zip code:
CONOCOPHILLIPS CO (900 SOUTH CENTRAL AVENUE in ROXANA, IL)
STATE MASTER (Illinois EPA Project) - SOLID WASTE PROGRAM, HAZARDOUS WASTE PROGRAM, AIR PROGRAM, National Pollutant Discharge Elimination System Permit AIR MAJOR (AIRS/AFS) - ICIS-05-2005-5003, ENFORCEMENT/COMPLIANCE ACTIVITY OIL CONTROL (Facility Response Plan for oil discharge) (Integrated Compliance Information System) - ICIS-05-1996-0635, FORMAL ENFORCEMENT ACTION, ICIS-05-1999-0362, ICIS-05-1996-0258, CRITERIA AND HAZARDOUS AIR POLLUTANT INVENTORY (Inventory of air pollution sources) National Pollutant Discharge Elimination System MAJOR (Tracking pollutant discharge elimination systems) - permit HAZARDOUS WASTE BIENNIAL REPORTER (Resource Conservation and Recovery Act (tracking hazardous waste)) - ICIS-, ENFORCEMENT/COMPLIANCE ACTIVITY, TSD (Resource Conservation and Recovery Act (tracking hazardous waste)) - notification - ICIS-, ENFORCEMENT/COMPLIANCE ACTIVITY, HAZARDOUS WASTE BIENNIAL REPORTER (Resource Conservation and Recovery Act (tracking hazardous waste)) Large Quantity Generators, more that 1000 kg of hazardous waste/month (Resource Conservation and Recovery Act (tracking hazardous waste)) - notification TRI REPORTER (Tracking of toxic chemicals releasing facilities) Business SIC classification: PETROLEUM REFINING Business NAICS classification: PETROLEUM REFINERIES. Organizations: EQUILON ENTERPRISES LLC (CONTACT/OPERATOR)
, CONOCOPHILLIPS CO WWR (CONTACT/OPERATOR)
, SHELL OIL COMPANY (CONTACT/OWNER)
, EQUILON ENTERPRISES LLC (CONTACT/OWNER)
, CONOCOPHILLIPS CO WWR (CONTACT/OWNER)
, SHELL OIL COMPANY (CONTACT/OWNER)
Alternative names: CONOCOPHILLIPS WOOD RIVER REFINERY, EQUILON ENTERPRISES LLC, EQUILON WOOD RIVER REFINING CO., SHELL OIL COMPANY-WOOD RIVER, TOSCO WOOD RIVER REFINERY, TOSCO WOODRIVER REFY., WOOD RIVER REFINING CO
AIR LIQUIDE AMERICA CORP (MADISON AVENUE AND HEDGE STREET in ROXANA, IL)
STATE MASTER (Illinois EPA Project) - AIR PROGRAM AIR MINOR (AIRS/AFS) CRITERIA AND HAZARDOUS AIR POLLUTANT INVENTORY (Inventory of air pollution sources) National Pollutant Discharge Elimination System NON-MAJOR (Tracking pollutant discharge elimination systems) - permit TRI REPORTER (Tracking of toxic chemicals releasing facilities) Business SIC classification: INDUSTRIAL GASES Organizations: CARDOX INC (CONTACT/OWNER)
Alternative names: CARDOX INC, CARDOX CORP. - WOOD RIVER CO2 PLANT, LIGUID AIR CORP.
ASPHALT SALES & PRODUCTS INC (INDUSTRIAL PARK OFF WAGON WHEEL RD in ROXANA, IL)
STATE MASTER (Illinois EPA Project) - AIR PROGRAM AIR MINOR (AIRS/AFS) CRITERIA AND HAZARDOUS AIR POLLUTANT INVENTORY (Inventory of air pollution sources) Business SIC classification: ASPHALT PAVING MIXTURES AND BLOCKS
ROXANA COMMUNITY UNIT SCHOOL DIST. #1 (300 CENTRAL AVE in ROXANA, IL)
STATE MASTER (Illinois EPA Project) - AIR PROGRAM AIR MINOR (AIRS/AFS) CRITERIA AND HAZARDOUS AIR POLLUTANT INVENTORY (Inventory of air pollution sources) Business SIC and NAICS classification: ELEMENTARY AND SECONDARY SCHOOLS
ROXANA LANDFILL (4600 CAHOKIA CREEK RD in ROXANA, IL)
AIR MAJOR (AIRS/AFS) CRITERIA AND HAZARDOUS AIR POLLUTANT INVENTORY (Inventory of air pollution sources) National Pollutant Discharge Elimination System NON-MAJOR (Tracking pollutant discharge elimination systems) - permit (Resource Conservation and Recovery Act (tracking hazardous waste)) Business SIC classification: REFUSE SYSTEMS Business NAICS classification: SOLID WASTE LANDFILL. Organizations: LAIDLAW WASTE SYSTEMS INC. (CONTACT/OWNER)
Alternative names: CAHOKIA ROAD SANITARY LANDFILL, LAIDLAW WASTE SYSTEMS INC
CONCRETE SUPPLY LLC (5010 OLD ALTON-EDWARDSVILLE RD in ROXANA, IL)
STATE MASTER (Illinois EPA Project) - AIR PROGRAM AIR MINOR (AIRS/AFS) CRITERIA AND HAZARDOUS AIR POLLUTANT INVENTORY (Inventory of air pollution sources) Business SIC classification: READY-MIXED CONCRETE Alternative names: KIENSTRA INC
DAWSON MARINE ELECTRIC (300 OLD EDWARDSVILLE RD in ROXANA, IL)
STATE MASTER (Illinois EPA Project) - HAZARDOUS WASTE PROGRAM Conditionally Exempt Small Quantity Generators, less than 100 kg/month of hazardous waste (Resource Conservation and Recovery Act (tracking hazardous waste)) Organizations: DAWSON WILLIAM (CONTACT/OWNER)
RELIANT ENERGY CARDINAL LP (MADISON ST E OF HWY 111 in ROXANA, IL)
STATE MASTER (Illinois EPA Project) - AIR PROGRAM AIR MINOR (AIRS/AFS) Business SIC classification: ELECTRIC SERVICES Alternative names: RELIANT ENERGY CARDINAL, L.P.
CONCRETE SUPPLY LLC. (WAGON WHEEL RD in ROXANA, IL)
STATE MASTER (Illinois EPA Project) - AIR PROGRAM AIR MINOR (AIRS/AFS) Business SIC classification: READY-MIXED CONCRETE Alternative names: CONCRETE SUPPLY INC
ROXANA JUNIOR HIGH SCHOOL (401 CHAFFER AVE in ROXANA, IL)
(Geographic Names Information System) (National Center for Education Statistics) - STATE ID-4105700101001 Organizations: ROXANA COMM UNIT SCHOOL DIST 1 (SCHOOL DISTRICT)
ROXANA RESOURCE RECOVERY LLC (4600 CAHOKIA CREEK RD in ROXANA, IL)
STATE MASTER (Illinois EPA Project) - AIR PROGRAM AIR MAJOR (AIRS/AFS) CRITERIA AND HAZARDOUS AIR POLLUTANT INVENTORY (Inventory of air pollution sources) Business SIC classification: ELECTRIC SERVICES Alternative names: ROXANA POWER PLANT
MIKES INC (229 OLD EDWARDSVILLE RD in ROXANA, IL)
Small Quantity Generators, between 100 kg and 1000 kg of hazardous waste/month (Resource Conservation and Recovery Act (tracking hazardous waste)) - notification Organizations: MARKO MIKE (CONTACT/OWNER)
Housing units lacking complete plumbing facilities: 5.0% Housing units lacking complete kitchen facilities: 4.4%
73.6%Utility gas
23.3%Electricity
3.0%Bottled, tank, or LP gas
Population in 1990: 1,513.
Place of birth for U.S.-born residents:
This state: 1,156
Northeast: 13
Midwest: 260
South: 115
West: 6
64% of the 62084 zip code residents lived in the same house 5 years ago. Out of people who lived in different houses, 79% lived in this county. Out of people who lived in different counties, 50% lived in Illinois.
86% of the 62084 zip code residents lived in the same house 1 year ago. Out of people who lived in different houses, 65% moved from this county. Out of people who lived in different houses, 6% moved from different county within same state. Out of people who lived in different houses, 28% moved from different state.
Private vs. public school enrollment:
Students in private schools in grades 1 to 8 (elementary and middle school):
Here:
0.0%
Illinois:
13.3%
Students in private schools in grades 9 to 12 (high school):
Here:
0.0%
Illinois:
9.9%
Students in private undergraduate colleges: 5
Here:
7.8%
Illinois:
27.4%
Occupation by median earnings in the past 12 months ($)
84,408Law enforcement workers including supervisors
82,152Management occupations
78,770Architecture and engineering occupations
73,580Health diagnosing and treating practitioners and other technical occupations
71,267Production occupations
55,994Transportation occupations
Top industries in this zip code by the number of employees in 2005:
Administrative and Support and Waste Management and Remediation Services: Solid Waste Collection (100-249 employees: 1 establishment)
Wholesale Trade: Wholesale Trade Agents and Brokers (50-99: 1)
Administrative and Support and Waste Management and Remediation Services: Solid Waste Landfill (20-49: 1)
Professional, Scientific, and Technical Services: Testing Laboratories (20-49: 1)
Accommodation and Food Services: Food Service Contractors (10-19: 1)
Health Care and Social Assistance: Child Day Care Services (5-9: 2)
Accommodation and Food Services: Full-Service Restaurants (5-9: 1)
Real Estate and Rental and Leasing: General Rental Centers (5-9: 1)
Fatal accident statistics in 2014:
Fatal accident count: 1
Vehicles involved in fatal accidents: 1
Fatal accidents caused by drunken drivers: 1
Fatalities: 1
Persons involved in fatal accidents: 1
Pedestrians involved in fatal accidents: 0
Fatal accident statistics in 2012:
Fatal accident count: 1
Vehicles involved in fatal accidents: 1
Fatal accidents caused by drunken drivers: 0
Fatalities: 1
Persons involved in fatal accidents: 1
Pedestrians involved in fatal accidents: 0
Home Mortgage Disclosure Act Aggregated Statistics For Year 2009 (Based on 2 partial tracts)
A) FHA, FSA/RHS & VA Home Purchase Loans
B) Conventional Home Purchase Loans
C) Refinancings
D) Home Improvement Loans
F) Non-occupant Loans on < 5 Family Dwellings (A B C & D)
Number
Average Value
Number
Average Value
Number
Average Value
Number
Average Value
Number
Average Value
LOANS ORIGINATED
5
$77,500
3
$48,567
10
$80,465
2
$107,795
2
$62,090
APPLICATIONS APPROVED, NOT ACCEPTED
1
$36,190
0
$0
1
$31,820
0
$0
0
$0
APPLICATIONS DENIED
0
$0
0
$0
4
$62,010
2
$8,580
0
$0
APPLICATIONS WITHDRAWN
0
$0
1
$44,300
2
$58,810
0
$0
0
$0
FILES CLOSED FOR INCOMPLETENESS
0
$0
0
$0
0
$0
0
$0
0
$0
Aggregated Statistics For Year 2008 (Based on 2 partial tracts)
A) FHA, FSA/RHS & VA Home Purchase Loans
B) Conventional Home Purchase Loans
C) Refinancings
D) Home Improvement Loans
F) Non-occupant Loans on < 5 Family Dwellings (A B C & D)
Number
Average Value
Number
Average Value
Number
Average Value
Number
Average Value
Number
Average Value
LOANS ORIGINATED
4
$72,618
6
$59,072
11
$74,936
2
$31,045
4
$85,488
APPLICATIONS APPROVED, NOT ACCEPTED
0
$0
0
$0
2
$48,515
0
$0
0
$0
APPLICATIONS DENIED
0
$0
0
$0
7
$83,973
1
$68,020
0
$0
APPLICATIONS WITHDRAWN
0
$0
0
$0
5
$94,224
0
$0
0
$0
FILES CLOSED FOR INCOMPLETENESS
0
$0
0
$0
0
$0
0
$0
0
$0
Aggregated Statistics For Year 2007 (Based on 2 partial tracts)
A) FHA, FSA/RHS & VA Home Purchase Loans
B) Conventional Home Purchase Loans
C) Refinancings
D) Home Improvement Loans
F) Non-occupant Loans on < 5 Family Dwellings (A B C & D)
Number
Average Value
Number
Average Value
Number
Average Value
Number
Average Value
Number
Average Value
LOANS ORIGINATED
3
$70,200
11
$66,315
12
$69,966
2
$32,135
5
$51,356
APPLICATIONS APPROVED, NOT ACCEPTED
0
$0
1
$76,130
2
$80,495
1
$10,920
1
$65,210
APPLICATIONS DENIED
0
$0
2
$58,190
13
$70,488
4
$39,000
2
$68,015
APPLICATIONS WITHDRAWN
0
$0
1
$98,280
5
$95,846
0
$0
1
$83,300
FILES CLOSED FOR INCOMPLETENESS
0
$0
1
$46,180
2
$95,940
0
$0
1
$43,680
Aggregated Statistics For Year 2006 (Based on 2 partial tracts)
A) FHA, FSA/RHS & VA Home Purchase Loans
B) Conventional Home Purchase Loans
C) Refinancings
D) Home Improvement Loans
F) Non-occupant Loans on < 5 Family Dwellings (A B C & D)
G) Loans On Manufactured Home Dwelling (A B C & D)
Number
Average Value
Number
Average Value
Number
Average Value
Number
Average Value
Number
Average Value
Number
Average Value
LOANS ORIGINATED
2
$90,010
15
$63,897
7
$74,077
2
$24,960
4
$48,282
0
$0
APPLICATIONS APPROVED, NOT ACCEPTED
0
$0
2
$51,325
2
$68,795
0
$0
1
$32,450
0
$0
APPLICATIONS DENIED
1
$55,540
3
$60,737
5
$75,816
2
$53,820
0
$0
1
$42,740
APPLICATIONS WITHDRAWN
0
$0
1
$64,900
4
$57,408
0
$0
0
$0
0
$0
FILES CLOSED FOR INCOMPLETENESS
0
$0
1
$46,490
1
$87,670
0
$0
0
$0
0
$0
Aggregated Statistics For Year 2005 (Based on 2 partial tracts)
A) FHA, FSA/RHS & VA Home Purchase Loans
B) Conventional Home Purchase Loans
C) Refinancings
D) Home Improvement Loans
F) Non-occupant Loans on < 5 Family Dwellings (A B C & D)
G) Loans On Manufactured Home Dwelling (A B C & D)
Number
Average Value
Number
Average Value
Number
Average Value
Number
Average Value
Number
Average Value
Number
Average Value
LOANS ORIGINATED
2
$88,295
12
$66,898
19
$65,356
4
$48,595
5
$53,290
0
$0
APPLICATIONS APPROVED, NOT ACCEPTED
1
$24,340
1
$63,020
4
$64,427
0
$0
0
$0
0
$0
APPLICATIONS DENIED
1
$63,020
3
$55,327
8
$84,708
2
$670,645
0
$0
1
$47,110
APPLICATIONS WITHDRAWN
0
$0
2
$81,275
6
$137,332
0
$0
0
$0
0
$0
FILES CLOSED FOR INCOMPLETENESS
0
$0
0
$0
1
$50,860
0
$0
0
$0
0
$0
Aggregated Statistics For Year 2004 (Based on 2 partial tracts)
A) FHA, FSA/RHS & VA Home Purchase Loans
B) Conventional Home Purchase Loans
C) Refinancings
D) Home Improvement Loans
F) Non-occupant Loans on < 5 Family Dwellings (A B C & D)
G) Loans On Manufactured Home Dwelling (A B C & D)
Number
Average Value
Number
Average Value
Number
Average Value
Number
Average Value
Number
Average Value
Number
Average Value
LOANS ORIGINATED
3
$75,400
10
$67,049
14
$56,361
1
$13,420
4
$43,602
0
$0
APPLICATIONS APPROVED, NOT ACCEPTED
0
$0
1
$79,560
2
$80,650
0
$0
0
$0
0
$0
APPLICATIONS DENIED
0
$0
2
$58,810
7
$51,213
1
$19,340
1
$46,490
2
$26,365
APPLICATIONS WITHDRAWN
0
$0
1
$42,120
4
$73,085
0
$0
0
$0
0
$0
FILES CLOSED FOR INCOMPLETENESS
0
$0
0
$0
0
$0
1
$28,390
0
$0
0
$0
Aggregated Statistics For Year 2003 (Based on 2 partial tracts)
A) FHA, FSA/RHS & VA Home Purchase Loans
B) Conventional Home Purchase Loans
C) Refinancings
D) Home Improvement Loans
F) Non-occupant Loans on < 5 Family Dwellings (A B C & D)
Number
Average Value
Number
Average Value
Number
Average Value
Number
Average Value
Number
Average Value
LOANS ORIGINATED
4
$67,782
8
$65,169
32
$75,465
2
$45,550
4
$168,948
APPLICATIONS APPROVED, NOT ACCEPTED
0
$0
1
$36,500
2
$61,310
0
$0
0
$0
APPLICATIONS DENIED
0
$0
1
$21,220
8
$63,492
2
$19,030
0
$0
APPLICATIONS WITHDRAWN
0
$0
2
$46,490
6
$68,743
0
$0
0
$0
FILES CLOSED FOR INCOMPLETENESS
0
$0
0
$0
1
$40,560
0
$0
0
$0
Aggregated Statistics For Year 2002 (Based on 2 partial tracts)
A) FHA, FSA/RHS & VA Home Purchase Loans
B) Conventional Home Purchase Loans
C) Refinancings
D) Home Improvement Loans
E) Loans on Dwellings For 5+ Families
F) Non-occupant Loans on < 5 Family Dwellings (A B C & D)
Number
Average Value
Number
Average Value
Number
Average Value
Number
Average Value
Number
Average Value
Number
Average Value
LOANS ORIGINATED
5
$61,652
9
$52,624
26
$58,164
2
$14,820
1
$321,360
3
$63,127
APPLICATIONS APPROVED, NOT ACCEPTED
0
$0
1
$59,280
5
$47,362
1
$11,860
0
$0
0
$0
APPLICATIONS DENIED
0
$0
5
$49,546
17
$61,702
3
$21,007
0
$0
0
$0
APPLICATIONS WITHDRAWN
1
$42,120
1
$55,850
6
$53,820
0
$0
0
$0
0
$0
FILES CLOSED FOR INCOMPLETENESS
0
$0
1
$58,660
1
$34,010
0
$0
0
$0
0
$0
Aggregated Statistics For Year 2001 (Based on 2 partial tracts)
A) FHA, FSA/RHS & VA Home Purchase Loans
B) Conventional Home Purchase Loans
C) Refinancings
D) Home Improvement Loans
F) Non-occupant Loans on < 5 Family Dwellings (A B C & D)
Number
Average Value
Number
Average Value
Number
Average Value
Number
Average Value
Number
Average Value
LOANS ORIGINATED
5
$66,830
8
$50,895
24
$53,183
4
$88,375
3
$43,473
APPLICATIONS APPROVED, NOT ACCEPTED
0
$0
0
$0
5
$59,966
1
$1,870
0
$0
APPLICATIONS DENIED
1
$52,420
4
$45,395
14
$57,408
2
$7,955
1
$22,150
APPLICATIONS WITHDRAWN
0
$0
0
$0
5
$56,036
0
$0
0
$0
FILES CLOSED FOR INCOMPLETENESS
0
$0
0
$0
2
$52,730
0
$0
1
$34,010
Aggregated Statistics For Year 2000 (Based on 2 partial tracts)
A) FHA, FSA/RHS & VA Home Purchase Loans
B) Conventional Home Purchase Loans
C) Refinancings
D) Home Improvement Loans
F) Non-occupant Loans on < 5 Family Dwellings (A B C & D)
Number
Average Value
Number
Average Value
Number
Average Value
Number
Average Value
Number
Average Value
LOANS ORIGINATED
5
$59,156
7
$44,527
10
$42,432
3
$9,463
5
$34,132
APPLICATIONS APPROVED, NOT ACCEPTED
0
$0
0
$0
6
$51,688
1
$32,450
1
$15,600
APPLICATIONS DENIED
1
$39,000
8
$37,245
8
$37,986
3
$26,937
1
$43,990
APPLICATIONS WITHDRAWN
1
$39,000
1
$31,510
2
$45,865
1
$29,640
0
$0
FILES CLOSED FOR INCOMPLETENESS
0
$0
1
$19,660
2
$33,695
0
$0
0
$0
Aggregated Statistics For Year 1999 (Based on 1 partial tract)
A) FHA, FSA/RHS & VA Home Purchase Loans
B) Conventional Home Purchase Loans
C) Refinancings
D) Home Improvement Loans
F) Non-occupant Loans on < 5 Family Dwellings (A B C & D)
Detailed PMIC statistics for the following Tracts:4012.00
2002 - 2018 National Fire Incident Reporting System (NFIRS) incidents
Based on the data from the years 2002 - 2018 the average number of fires per year is 12. The highest number of fires - 24 took place in 2005, and the least - 1 in 2015. The data has a decreasing trend.
When looking into fire subcategories, the most reports belonged to: Structure Fires (39.6%), and Outside Fires (32.2%).
Fire incident types reported to NFIRS in Zip Code 62084


 Nearest zip codes: 62087, 62095, 62024, 62048, 62018, 62010.


 Based on the data from the years 2002 - 2018 the average number of fires per year is 12. The highest number of fires - 24 took place in 2005, and the least - 1 in 2015. The data has a decreasing trend.
 When looking into fire subcategories, the most reports belonged to: Structure Fires (39.6%), and Outside Fires (32.2%).