Estimated zip code population in 2022: 5,992 Zip code population in 2010: 8,209 Zip code population in 2000: 10,275
Houses and condos: 2,950 Renter-occupied apartments: 540
% of renters here:
25%
State:
33%
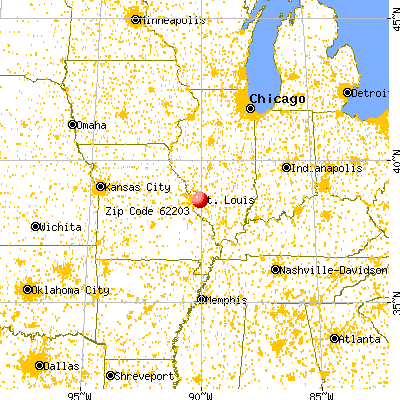
March 2022 cost of living index in zip code 62203: 94.0 (less than average, U.S. average is 100)
Land area: 6.7 sq. mi. Water area: 0.2 sq. mi.
Population density: 900 people per square mile
(low).
OSM Map
General Map
Google Map
MSN Map
OSM Map
General Map
Google Map
MSN Map
OSM Map
General Map
Google Map
MSN Map
OSM Map
General Map
Google Map
MSN Map
Please wait while loading the map...
Real estate property taxes paid for housing units in 2022:
This zip code:
1.7% ($1,147)
Illinois:
2.0% ($4,912)
Median real estate property taxes paid for housing units with mortgages in 2022: $1,440 (2.0%) Median real estate property taxes paid for housing units with no mortgage in 2022: $1,080 (1.7%)
Averages for the 2020 tax year for zip code 62203, filed in 2021:
Average Adjusted Gross Income (AGI) in 2020: $30,917 (Individual Income Tax Returns)
Here:
$30,917
State:
$82,626
Salary/wage: $25,953 (reported on 81.7% of returns)
Here:
$25,953
State:
$66,640
(% of AGI for various income ranges: 1149.1% for AGIs below $25k, 3749.4% for AGIs $25k-50k, 6917.5% for AGIs $50k-75k, 8758.0% for AGIs $75k-100k, 14630.0% for AGIs $100k-200k)
Taxable interest for individuals: $241 (reported on 10.6% of returns)
This zip code:
$241
Illinois:
$2,376
(% of AGI for various income ranges: 0.9% for AGIs below $25k, 3.7% for AGIs $25k-50k, 13.1% for AGIs $50k-75k, 16.0% for AGIs $75k-100k, 20.0% for AGIs $100k-200k)
Ordinary dividends: $482 (reported on 4.0% of returns)
Here:
$482
State:
$9,061
(% of AGI for various income ranges: 1.6% for AGIs $25k-50k, 11.2% for AGIs $50k-75k, 50.0% for AGIs $75k-100k)
Net capital gain/loss in AGI: +$1,129 (reported on 2.6% of returns)
Here:
+$1,129
State:
+$31,684
(% of AGI for various income ranges: 160.0% for AGIs $75k-100k)
Profit/loss from business: +$1,534 (reported on 12.8% of returns)
Here:
+$1,534
State:
+$12,175
(% of AGI for various income ranges: 54.3% for AGIs below $25k)
Taxable individual retirement arrangement distribution: $12,460 (reported on 3.7% of returns)
62203:
$12,460
Illinois:
$21,613
(% of AGI for various income ranges: 12.3% for AGIs below $25k, 34.8% for AGIs $25k-50k, 254.4% for AGIs $50k-75k, 1200.0% for AGIs $100k-200k)
Total itemized deductions: $29,400 (reported on 1.8% of returns)
Here:
$29,400
State:
$34,948
(% of AGI for various income ranges: 121.0% for AGIs $25k-50k, 1440.0% for AGIs $75k-100k)
Charity contributions: $12,300 (reported on 1.5% of returns)
Here:
$12,300
State:
$13,122
(% of AGI for various income ranges: 21.5% for AGIs below $25k, 486.0% for AGIs $75k-100k)
Taxes paid: $4,120 (reported on 1.8% of returns)
62203:
$4,120
State:
$8,563
(% of AGI for various income ranges: 18.9% for AGIs $25k-50k, 178.0% for AGIs $75k-100k)
Earned income credit: $2,634 (reported on 38.1% of returns)
Here:
$2,634
State:
$2,311
(% of AGI for various income ranges: 176.3% for AGIs below $25k, 111.9% for AGIs $25k-50k)
Percentage of individuals using paid preparers for their 2020 taxes: 87.2%
Here:
87%
State:
93%
(% for various income ranges: 88.9% for AGIs below $25k, 88.0% for AGIs $25k-50k, 80.8% for AGIs $50k-75k, 80.0% for AGIs $75k-100k, 80.0% for AGIs $100k-200k)
Averages for the 2012 tax year for zip code 62203, filed in 2013:
Average Adjusted Gross Income (AGI) in 2012: $29,159 (Individual Income Tax Returns)
Here:
$29,159
State:
$68,058
Salary/wage: $24,599 (reported on 82.9% of returns)
Here:
$24,599
State:
$55,396
(% of AGI for various income ranges: 73.3% for AGIs below $25k, 79.9% for AGIs $25k-50k, 70.4% for AGIs $50k-75k, 54.5% for AGIs $75k-100k, 51.3% for AGIs $100k-200k)
Taxable interest for individuals: $454 (reported on 13.5% of returns)
This zip code:
$454
Illinois:
$1,969
(% of AGI for various income ranges: 0.2% for AGIs below $25k, 0.2% for AGIs $25k-50k, 0.3% for AGIs $75k-100k, 0.5% for AGIs $100k-200k)
Ordinary dividends: $594 (reported on 5.3% of returns)
Here:
$594
State:
$7,786
(% of AGI for various income ranges: 0.1% for AGIs $50k-75k, 0.1% for AGIs $75k-100k, 0.3% for AGIs $100k-200k)
Net capital gain/loss in AGI: +$200 (reported on 2.3% of returns)
Here:
+$200
State:
+$22,183
Profit/loss from business: +$4,944 (reported on 14.1% of returns)
Here:
+$4,944
State:
+$12,903
(% of AGI for various income ranges: 9.8% for AGIs below $25k)
Taxable individual retirement arrangement distribution: $11,433 (reported on 3.9% of returns)
62203:
$11,433
Illinois:
$17,929
(% of AGI for various income ranges: 1.0% for AGIs below $25k, 1.1% for AGIs $25k-50k, 1.0% for AGIs $50k-75k, 7.7% for AGIs $75k-100k)
Total itemized deductions: $16,455 (27% of AGI, reported on 12.5% of returns)
Here:
$16,455
State:
$26,433
Here:
27.0% of AGI
State:
19.2% of AGI
(% of AGI for various income ranges: 2.3% for AGIs below $25k, 6.4% for AGIs $25k-50k, 8.7% for AGIs $50k-75k, 10.7% for AGIs $75k-100k, 12.8% for AGIs $100k-200k)
Charity contributions: $5,513 (reported on 10.2% of returns)
Here:
$5,513
State:
$4,525
(% of AGI for various income ranges: 0.5% for AGIs below $25k, 1.6% for AGIs $25k-50k, 2.6% for AGIs $50k-75k, 2.9% for AGIs $75k-100k, 3.8% for AGIs $100k-200k)
Taxes paid: $3,978 (reported on 11.8% of returns)
62203:
$3,978
State:
$11,968
(% of AGI for various income ranges: 0.4% for AGIs below $25k, 1.3% for AGIs $25k-50k, 2.3% for AGIs $50k-75k, 2.0% for AGIs $75k-100k, 3.5% for AGIs $100k-200k)
Earned income credit: $2,819 (reported on 42.4% of returns)
Here:
$2,819
State:
$2,349
(% of AGI for various income ranges: 13.7% for AGIs below $25k, 1.5% for AGIs $25k-50k)
Percentage of individuals using paid preparers for their 2012 taxes: 47.0%
Here:
47%
State:
57%
(% for various income ranges: 46.4% for AGIs below $25k, 45.3% for AGIs $25k-50k, 48.4% for AGIs $50k-75k, 60.0% for AGIs $75k-100k, 55.6% for AGIs $100k-200k)
Averages for the 2004 tax year for zip code 62203, filed in 2005:
Average Adjusted Gross Income (AGI) in 2004: $26,642 (Individual Income Tax Returns)
Here:
$26,642
State:
$54,625
Salary/wage: $23,895 (reported on 91.2% of returns)
Here:
$23,895
State:
$46,811
(% of AGI for various income ranges: 87.4% for AGIs below $10k, 87.7% for AGIs $10k-25k, 85.2% for AGIs $25k-50k, 78.6% for AGIs $50k-75k, 74.0% for AGIs $75k-100k, 65.9% for AGIs over 100k)
Taxable interest for individuals: $509 (reported on 16.9% of returns)
This zip code:
$509
Illinois:
$2,101
(% of AGI for various income ranges: 0.6% for AGIs below $10k, 0.4% for AGIs $10k-25k, 0.3% for AGIs $25k-50k, 0.3% for AGIs $50k-75k, 0.2% for AGIs $75k-100k, 0.5% for AGIs over 100k)
Taxable dividends: $493 (reported on 6.3% of returns)
Here:
$493
State:
$4,306
(% of AGI for various income ranges: 0.2% for AGIs below $10k, 0.1% for AGIs $10k-25k, 0.1% for AGIs $25k-50k, 0.1% for AGIs $50k-75k, 0.1% for AGIs $75k-100k, 0.2% for AGIs over 100k)
Profit/loss from business: +$2,935 (reported on 7.8% of returns)
Here:
+$2,935
State:
+$11,771
(% of AGI for various income ranges: 4.7% for AGIs below $10k, 1.5% for AGIs $10k-25k, 0.8% for AGIs $25k-50k, 0.3% for AGIs $50k-75k, -0.4% for AGIs $75k-100k)
IRA payment deduction: $1,611 (reported on 0.5% of returns)
62203:
$1,611
Illinois:
$3,087
Total itemized deductions: $13,797 (26% of AGI, reported on 17.7% of returns)
Here:
$13,797
State:
$20,239
Here:
25.6% of AGI
State:
19.5% of AGI
(% of AGI for various income ranges: 2.9% for AGIs below $10k, 4.5% for AGIs $10k-25k, 8.2% for AGIs $25k-50k, 13.3% for AGIs $50k-75k, 12.6% for AGIs $75k-100k, 15.5% for AGIs over 100k)
Charity contributions deductions: $4,325 (8% of AGI, reported on 15.8% of returns)
Here:
$4,325
State:
$3,719
Here:
7.9% of AGI
State:
3.4% of AGI
(% of AGI for various income ranges: 0.3% for AGIs below $10k, 0.8% for AGIs $10k-25k, 2.2% for AGIs $25k-50k, 4.0% for AGIs $50k-75k, 4.1% for AGIs $75k-100k, 5.0% for AGIs over 100k)
Total tax: $3,469 (reported on 56.6% of returns)
62203:
$3,469
State:
$9,882
(% of AGI for various income ranges: 1.4% for AGIs below $10k, 2.4% for AGIs $10k-25k, 6.3% for AGIs $25k-50k, 10.2% for AGIs $50k-75k, 12.1% for AGIs $75k-100k, 16.2% for AGIs over 100k)
Earned income credit: $2,096 (reported on 42.3% of returns)
Here:
$2,096
State:
$1,788
Percentage of individuals using paid preparers for their 2004 taxes: 66.1%
Here:
66%
State:
61%
(% for various income ranges: 64.2% for AGIs below $10k, 70.7% for AGIs $10k-25k, 61.9% for AGIs $25k-50k, 65.6% for AGIs $50k-75k, 64.9% for AGIs $75k-100k, 70.2% for AGIs over 100k)
Household received Food Stamps/SNAP in the past 12 months: 533 Household did not receive Food Stamps/SNAP in the past 12 months: 1,633
Women who had a birth in the past 12 months: 55 (0 now married, 56 unmarried) Women who did not have a birth in the past 12 months: 1,273 (106 now married, 1,181 unmarried)
Housing units in zip code 62203 with a mortgage: 508 (23 second mortgage, 13 both second mortgage and home equity loan) Median monthly owner costs for units with a mortgage: $971 Median monthly owner costs for units without a mortgage: $421
Residents with income below the poverty level in 2022:
This zip code:
30.5%
Whole state:
11.9%
Residents with income below 50% of the poverty level in 2022:
This zip code:
8.4%
Whole state:
5.7%
Median number of rooms in houses and condos:
Here:
5.9
State:
6.4
Median number of rooms in apartments:
Here:
4.9
State:
4.1
Notable locations in this zip code not listed on our city pages
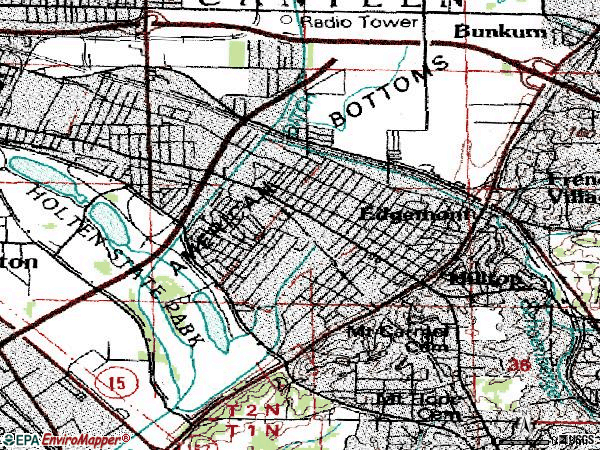
Notable locations in zip code 62203: Grand Marais Picnic Area (A), Grand Marais Boat Ramp (B), Whispering Willow Picnic Area (C), Green Acres Farm (D), Midway Volunteer Fire Department (E), East Saint Louis Fire Department Company 426 (F). Display/hide their locations on the map
Churches in zip code 62203 include: Edgemont Bible Church (A), First Presbyterian Church (B), Kingshighway Church of Christ (C), Saint Constantine and Saint Helen Greek Orthodox Church (D), State Street Baptist Church (E). Display/hide their locations on the map
In group quarters: 336 (-1 institutionalized population)
Size of family households: 520 2-persons, 285 3-persons, 210 4-persons, 41 5-persons, 37 6-persons, 25 7-or-more-persons
Size of nonfamily households: 850 1-person, 136 2-persons, 40 3-persons
134 married couples with children.
290 single-parent households (79 men, 211 women).
98.6% of residents of 62203 zip code speak English at home.
0.7% of residents speak Spanish at home (100% very well).
0.4% of residents speak Asian or Pacific Island language at home (100% very well).
Foreign born population: 44 (0.7%) (100.0% of them are naturalized citizens)
This zip code:
0.7%
Whole state:
14.4%
48%Japan
43%Malaysia
2%France
1%American
1%Irish
0%German
0%African
0%Nigerian
Year of entry for the foreign-born population
62010 or later
202000 to 2009
191990 to 1999
7Before 1990
Facilities with environmental interests located in this zip code:
KEELEY & SONS INC (5 LOISEL VILLAGE SHOPPING CENTER in EAST ST LOUIS, IL)
STATE MASTER (Illinois EPA Project) - SOLID WASTE PROGRAM National Pollutant Discharge Elimination System NON-MAJOR (Tracking pollutant discharge elimination systems) - permit Small Quantity Generators, between 100 kg and 1000 kg of hazardous waste/month (Resource Conservation and Recovery Act (tracking hazardous waste)) - notification Organizations: MACLAIR ASPHALT COMPANY, INC. (CONTACT/OWNER)
Alternative names: KEELEY & SONS ASPHALT CO, MACLAIR ASPHALT COMPANY, INC.
NEW YORK CLEANERS INC (5900 STATE ST in EAST SAINT LOUIS, IL)
STATE MASTER (Illinois EPA Project) - HAZARDOUS WASTE PROGRAM, AIR PROGRAM AIR MINOR (AIRS/AFS) CRITERIA AND HAZARDOUS AIR POLLUTANT INVENTORY (Inventory of air pollution sources) Small Quantity Generators, between 100 kg and 1000 kg of hazardous waste/month (Resource Conservation and Recovery Act (tracking hazardous waste)) Business SIC classification: DRYCLEANING PLANTS, EXCEPT RUG CLEANING Organizations: MCINTOSH JOHN (CONTACT/OWNER)
CONTINENTAL GRAIN CO (901 N 59TH STREET in EAST SAINT LOUIS, IL)
STATE MASTER (Illinois EPA Project) - SOLID WASTE PROGRAM, HAZARDOUS WASTE PROGRAM Conditionally Exempt Small Quantity Generators, less than 100 kg/month of hazardous waste (Resource Conservation and Recovery Act (tracking hazardous waste)) - notification TRI REPORTER (Tracking of toxic chemicals releasing facilities) Business SIC classification: PREPARED FEEDS AND FEED INGREDIENTS FOR ANIMALS AND FOWLS, EXCEPT DOGS AND CATS Alternative names: CONTINENTAL GRAIN CO. INC., WAYNE FEED DIV.
HARDING ELEM SCHOOL (731 N 74TH ST in EAST SAINT LOUIS, IL)
(National Center for Education Statistics) - STATE ID-5008218902016 Organizations: EAST ST LOUIS SCHOOL DIST 189 (SCHOOL DISTRICT)
HAYDEN WRECKING CORP (4201 ST CLAIR AVE in WASHINGTON PARK, IL)
STATE MASTER (Illinois EPA Project) - SCRAP TIRE MANAGEMENT COMPLIANCE ACTIVITY (Tracking inspections of insecticide, fungicide, and rodenticide, and toxic substances)
MORRISON ELEM SCHOOL (630 N 59TH ST in EAST SAINT LOUIS, IL)
(National Center for Education Statistics) - STATE ID-5008218902031 Organizations: EAST ST LOUIS SCHOOL DIST 189 (SCHOOL DISTRICT)
40 MINUTE CLEANERS (7621 STATE in EAST ST LOUIS, IL)
(Resource Conservation and Recovery Act (tracking hazardous waste))
OAK PARK PUMP STATION 2 (6210 SUMMIT in EAST ST LOUIS, IL)
Small Quantity Generators, between 100 kg and 1000 kg of hazardous waste/month (Resource Conservation and Recovery Act (tracking hazardous waste)) Organizations: CITY OF EAST ST LOUIS (CONTACT/OPERATOR)
OAK PARK PUMP STATION 3 (6301 STATE in EAST ST LOUIS, IL)
Small Quantity Generators, between 100 kg and 1000 kg of hazardous waste/month (Resource Conservation and Recovery Act (tracking hazardous waste)) Organizations: CITY OF EAST ST LOUIS (CONTACT/OPERATOR)
MATLACK INC (8895 ST CLAIR AVE in E ST LOUIS, IL)
Conditionally Exempt Small Quantity Generators, less than 100 kg/month of hazardous waste (Resource Conservation and Recovery Act (tracking hazardous waste)) - notification Organizations: TTC INC (CONTACT/OWNER)
CLARK OIL STATION 485 (6800 STATE ST in EAST ST LOUIS, IL)
Small Quantity Generators, between 100 kg and 1000 kg of hazardous waste/month (Resource Conservation and Recovery Act (tracking hazardous waste)) - notification Organizations: CLARK REFINING AND MARKETING (CONTACT/OWNER)
JOHN F KENNEDY ELEMENTARY SCH (7000 RIDGE AVE in E ST LOUIS, IL)
COMPLIANCE ACTIVITY (Tracking inspections of insecticide, fungicide, and rodenticide, and toxic substances)
Housing units lacking complete plumbing facilities: 10.7% Housing units lacking complete kitchen facilities: 10.1%
74.7%Utility gas
20.8%Electricity
2.3%No fuel used
1.3%Fuel oil, kerosene, etc.
1.0%Bottled, tank, or LP gas
Population in 1990: 12,435.
Place of birth for U.S.-born residents:
This state: 3,463
Northeast: 7
Midwest: 1,353
South: 1,033
West: 47
69% of the 62203 zip code residents lived in the same house 5 years ago. Out of people who lived in different houses, 75% lived in this county. Out of people who lived in different counties, 50% lived in Illinois.
91% of the 62203 zip code residents lived in the same house 1 year ago. Out of people who lived in different houses, 42% moved from this county. Out of people who lived in different houses, 48% moved from different county within same state. Out of people who lived in different houses, 12% moved from different state.
Private vs. public school enrollment:
Students in private schools in grades 1 to 8 (elementary and middle school): 48
Here:
18.6%
Illinois:
13.3%
Students in private schools in grades 9 to 12 (high school): 2
Here:
0.8%
Illinois:
9.9%
Students in private undergraduate colleges:
Here:
0.0%
Illinois:
27.4%
Occupation by median earnings in the past 12 months ($)
50,880Community and social service occupations
47,173Education, training, and library occupations
46,605Office and administrative support occupations
41,080Business and financial operations occupations
34,472Personal care and service occupations
30,204Management occupations
Top industries in this zip code by the number of employees in 2005:
Health Care and Social Assistance: Nursing Care Facilities (100-249 employees: 1 establishment)
Management of Companies and Enterprises: Corporate, Subsidiary, and Regional Managing Offices (50-99: 1)
Health Care and Social Assistance: Emergency and Other Relief Services (50-99: 1)
Health Care and Social Assistance: Other Residential Care Facilities (50-99: 1)
Health Care and Social Assistance: Child Day Care Services (20-49: 1, 5-9: 1, 1-4: 2)
Health Care and Social Assistance: Child and Youth Services (20-49: 1, 5-9: 1)
Other Services (except Public Administration): General Automotive Repair (10-19: 2, 1-4: 2)
People in group quarters in 2010:
701 people in state prisons
44 people in emergency and transitional shelters (with sleeping facilities) for people experiencing homelessness
People in group quarters in 2000:
596 people in state prisons
119 people in nursing homes
40 people in mental (psychiatric) hospitals or wards
8 people in homes for the mentally retarded
Fatal accident statistics in 2014:
Fatal accident count: 1
Vehicles involved in fatal accidents: 3
Fatal accidents caused by drunken drivers: 1
Fatalities: 1
Persons involved in fatal accidents: 1
Pedestrians involved in fatal accidents: 0
Fatal accident statistics in 2012:
Fatal accident count: 2
Vehicles involved in fatal accidents: 4
Fatal accidents caused by drunken drivers: 1
Fatalities: 2
Persons involved in fatal accidents: 4
Pedestrians involved in fatal accidents: 0
Home Mortgage Disclosure Act Aggregated Statistics For Year 2009 (Based on 2 full and 10 partial tracts)
A) FHA, FSA/RHS & VA Home Purchase Loans
B) Conventional Home Purchase Loans
C) Refinancings
D) Home Improvement Loans
E) Loans on Dwellings For 5+ Families
F) Non-occupant Loans on < 5 Family Dwellings (A B C & D)
G) Loans On Manufactured Home Dwelling (A B C & D)
Number
Average Value
Number
Average Value
Number
Average Value
Number
Average Value
Number
Average Value
Number
Average Value
Number
Average Value
LOANS ORIGINATED
9
$75,312
15
$46,021
53
$77,292
4
$44,920
0
$0
12
$46,268
3
$40,207
APPLICATIONS APPROVED, NOT ACCEPTED
3
$48,603
3
$22,993
5
$64,542
3
$23,787
0
$0
0
$0
1
$25,800
APPLICATIONS DENIED
9
$85,916
12
$32,216
128
$56,462
51
$20,369
2
$50,705
14
$33,552
2
$66,075
APPLICATIONS WITHDRAWN
7
$146,636
3
$52,560
52
$85,257
8
$47,480
0
$0
3
$72,030
1
$65,300
FILES CLOSED FOR INCOMPLETENESS
0
$0
0
$0
9
$56,517
2
$35,295
0
$0
2
$49,710
0
$0
Aggregated Statistics For Year 2008 (Based on 2 full and 10 partial tracts)
A) FHA, FSA/RHS & VA Home Purchase Loans
B) Conventional Home Purchase Loans
C) Refinancings
D) Home Improvement Loans
E) Loans on Dwellings For 5+ Families
F) Non-occupant Loans on < 5 Family Dwellings (A B C & D)
G) Loans On Manufactured Home Dwelling (A B C & D)
Number
Average Value
Number
Average Value
Number
Average Value
Number
Average Value
Number
Average Value
Number
Average Value
Number
Average Value
LOANS ORIGINATED
17
$56,700
28
$53,877
105
$64,759
36
$20,870
1
$500,960
44
$42,282
2
$47,785
APPLICATIONS APPROVED, NOT ACCEPTED
3
$50,757
5
$66,700
35
$61,633
8
$26,176
0
$0
8
$46,212
1
$55,040
APPLICATIONS DENIED
8
$71,632
29
$59,212
239
$61,514
89
$36,097
0
$0
32
$67,104
7
$66,179
APPLICATIONS WITHDRAWN
2
$91,010
7
$72,849
69
$72,422
7
$23,506
0
$0
6
$27,218
0
$0
FILES CLOSED FOR INCOMPLETENESS
2
$111,625
2
$57,745
14
$63,813
2
$56,805
0
$0
2
$49,730
0
$0
Aggregated Statistics For Year 2007 (Based on 2 full and 10 partial tracts)
A) FHA, FSA/RHS & VA Home Purchase Loans
B) Conventional Home Purchase Loans
C) Refinancings
D) Home Improvement Loans
E) Loans on Dwellings For 5+ Families
F) Non-occupant Loans on < 5 Family Dwellings (A B C & D)
G) Loans On Manufactured Home Dwelling (A B C & D)
Number
Average Value
Number
Average Value
Number
Average Value
Number
Average Value
Number
Average Value
Number
Average Value
Number
Average Value
LOANS ORIGINATED
14
$78,209
92
$61,783
195
$61,558
58
$37,330
0
$0
59
$51,038
3
$38,557
APPLICATIONS APPROVED, NOT ACCEPTED
2
$71,580
25
$55,391
78
$59,402
19
$44,879
0
$0
14
$54,128
3
$64,070
APPLICATIONS DENIED
11
$85,503
80
$59,372
358
$62,170
154
$38,114
2
$276,270
79
$46,091
10
$67,495
APPLICATIONS WITHDRAWN
2
$77,185
39
$70,203
111
$66,588
37
$66,265
0
$0
23
$48,537
0
$0
FILES CLOSED FOR INCOMPLETENESS
0
$0
13
$72,142
48
$61,752
2
$64,435
0
$0
8
$58,082
0
$0
Aggregated Statistics For Year 2006 (Based on 2 full and 10 partial tracts)
A) FHA, FSA/RHS & VA Home Purchase Loans
B) Conventional Home Purchase Loans
C) Refinancings
D) Home Improvement Loans
F) Non-occupant Loans on < 5 Family Dwellings (A B C & D)
G) Loans On Manufactured Home Dwelling (A B C & D)
Number
Average Value
Number
Average Value
Number
Average Value
Number
Average Value
Number
Average Value
Number
Average Value
LOANS ORIGINATED
11
$78,321
150
$60,121
243
$66,819
76
$34,171
98
$62,025
4
$65,935
APPLICATIONS APPROVED, NOT ACCEPTED
3
$40,517
48
$57,960
89
$60,538
15
$38,187
18
$46,282
8
$61,978
APPLICATIONS DENIED
2
$57,665
154
$58,779
424
$58,081
134
$38,175
86
$51,419
7
$58,264
APPLICATIONS WITHDRAWN
3
$80,387
38
$68,800
168
$63,419
16
$63,209
21
$55,405
1
$78,620
FILES CLOSED FOR INCOMPLETENESS
3
$51,527
17
$87,912
68
$69,484
7
$42,017
13
$64,195
1
$81,290
Aggregated Statistics For Year 2005 (Based on 2 full and 10 partial tracts)
A) FHA, FSA/RHS & VA Home Purchase Loans
B) Conventional Home Purchase Loans
C) Refinancings
D) Home Improvement Loans
F) Non-occupant Loans on < 5 Family Dwellings (A B C & D)
G) Loans On Manufactured Home Dwelling (A B C & D)
Number
Average Value
Number
Average Value
Number
Average Value
Number
Average Value
Number
Average Value
Number
Average Value
LOANS ORIGINATED
8
$82,056
169
$56,450
278
$55,950
91
$39,745
115
$44,045
10
$55,761
APPLICATIONS APPROVED, NOT ACCEPTED
0
$0
73
$46,780
84
$58,689
22
$34,621
24
$40,028
5
$49,032
APPLICATIONS DENIED
1
$107,940
141
$61,834
477
$58,230
148
$24,965
86
$51,281
26
$75,686
APPLICATIONS WITHDRAWN
4
$68,540
92
$65,584
198
$71,030
37
$94,041
25
$48,910
5
$128,788
FILES CLOSED FOR INCOMPLETENESS
2
$64,625
12
$81,475
31
$63,027
5
$44,966
0
$0
3
$77,290
Aggregated Statistics For Year 2004 (Based on 2 full and 10 partial tracts)
A) FHA, FSA/RHS & VA Home Purchase Loans
B) Conventional Home Purchase Loans
C) Refinancings
D) Home Improvement Loans
E) Loans on Dwellings For 5+ Families
F) Non-occupant Loans on < 5 Family Dwellings (A B C & D)
G) Loans On Manufactured Home Dwelling (A B C & D)
Number
Average Value
Number
Average Value
Number
Average Value
Number
Average Value
Number
Average Value
Number
Average Value
Number
Average Value
LOANS ORIGINATED
15
$63,077
142
$49,029
271
$53,926
61
$22,612
0
$0
93
$44,265
10
$39,064
APPLICATIONS APPROVED, NOT ACCEPTED
0
$0
57
$47,694
105
$57,038
15
$46,595
0
$0
18
$47,100
8
$48,868
APPLICATIONS DENIED
6
$84,377
82
$54,165
503
$54,495
127
$21,260
1
$171,260
39
$42,477
24
$42,438
APPLICATIONS WITHDRAWN
3
$59,967
22
$53,031
260
$61,667
6
$39,283
0
$0
14
$41,119
6
$71,523
FILES CLOSED FOR INCOMPLETENESS
2
$68,980
5
$59,792
23
$79,011
1
$66,630
0
$0
3
$57,323
1
$93,280
Aggregated Statistics For Year 2003 (Based on 2 full and 10 partial tracts)
A) FHA, FSA/RHS & VA Home Purchase Loans
B) Conventional Home Purchase Loans
C) Refinancings
D) Home Improvement Loans
E) Loans on Dwellings For 5+ Families
F) Non-occupant Loans on < 5 Family Dwellings (A B C & D)
2002 - 2018 National Fire Incident Reporting System (NFIRS) incidents
According to the data from the years 2002 - 2018 the average number of fire incidents per year is 128. The highest number of fire incidents - 223 took place in 2012, and the least - 14 in 2004. The data has a growing trend.
When looking into fire subcategories, the most reports belonged to: Structure Fires (42.1%), and Outside Fires (40.0%).
Fire incident types reported to NFIRS in Zip Code 62203


 Nearest zip codes: 62204, 62205, 62207, 62223, 62208, 62201.


 According to the data from the years 2002 - 2018 the average number of fire incidents per year is 128. The highest number of fire incidents - 223 took place in 2012, and the least - 14 in 2004. The data has a growing trend.
 When looking into fire subcategories, the most reports belonged to: Structure Fires (42.1%), and Outside Fires (40.0%).