Estimated zip code population in 2022: 4,331 Zip code population in 2010: 4,748 Zip code population in 2000: 4,576
Houses and condos: 1,933 Renter-occupied apartments: 370
% of renters here:
20%
State:
33%
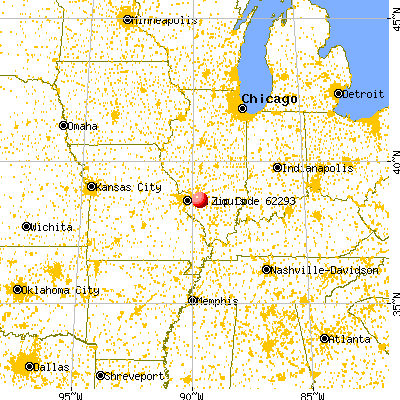
March 2022 cost of living index in zip code 62293: 94.8 (less than average, U.S. average is 100)
Land area: 59.5 sq. mi. Water area: 0.1 sq. mi.
Population density: 73 people per square mile
(very low).
OSM Map
General Map
Google Map
MSN Map
OSM Map
General Map
Google Map
MSN Map
OSM Map
General Map
Google Map
MSN Map
OSM Map
General Map
Google Map
MSN Map
Please wait while loading the map...
Real estate property taxes paid for housing units in 2022:
This zip code:
1.7% ($3,518)
Illinois:
2.0% ($4,912)
Median real estate property taxes paid for housing units with mortgages in 2022: $3,467 (1.7%) Median real estate property taxes paid for housing units with no mortgage in 2022: $3,598 (1.6%)
Estimated median house/condo value in 2022: $207,404
62293:
$207,404
Illinois:
$251,600
According to our research of Illinois and other state lists, there were 2 registered sex offenders living in 62293 zip code as of May 28, 2024. The ratio of all residents to sex offenders in zip code 62293 is 2,402 to 1. The ratio of registered sex offenders to all residents in this zip code is much lower than the state average.
Median resident age:
This zip code:
42.7 years
Illinois median age:
39.1 years
Average household size:
This zip code:
2.3 people
Illinois:
2.4 people
Averages for the 2020 tax year for zip code 62293, filed in 2021:
Average Adjusted Gross Income (AGI) in 2020: $77,163 (Individual Income Tax Returns)
Here:
$77,163
State:
$82,626
Salary/wage: $65,590 (reported on 79.9% of returns)
Here:
$65,590
State:
$66,640
(% of AGI for various income ranges: 1091.2% for AGIs below $25k, 3383.9% for AGIs $25k-50k, 5904.8% for AGIs $50k-75k, 8773.3% for AGIs $75k-100k, 16851.8% for AGIs $100k-200k, 65743.3% for AGIs over 200k)
Taxable interest for individuals: $1,057 (reported on 51.7% of returns)
This zip code:
$1,057
Illinois:
$2,376
(% of AGI for various income ranges: 31.7% for AGIs below $25k, 30.8% for AGIs $25k-50k, 84.4% for AGIs $50k-75k, 115.6% for AGIs $75k-100k, 131.8% for AGIs $100k-200k, 603.3% for AGIs over 200k)
Ordinary dividends: $3,846 (reported on 30.8% of returns)
Here:
$3,846
State:
$9,061
(% of AGI for various income ranges: 35.0% for AGIs below $25k, 50.0% for AGIs $25k-50k, 108.0% for AGIs $50k-75k, 192.2% for AGIs $75k-100k, 338.2% for AGIs $100k-200k, 2366.7% for AGIs over 200k)
Net capital gain/loss in AGI: +$6,532 (reported on 25.2% of returns)
Here:
+$6,532
State:
+$31,684
(% of AGI for various income ranges: 21.9% for AGIs below $25k, 50.8% for AGIs $25k-50k, 57.6% for AGIs $50k-75k, 179.4% for AGIs $75k-100k, 506.7% for AGIs $100k-200k, 4800.0% for AGIs over 200k)
Profit/loss from business: +$12,126 (reported on 13.2% of returns)
Here:
+$12,126
State:
+$12,175
(% of AGI for various income ranges: 98.1% for AGIs below $25k, 145.8% for AGIs $25k-50k, 143.6% for AGIs $50k-75k, 324.4% for AGIs $75k-100k, 410.0% for AGIs $100k-200k, 1753.3% for AGIs over 200k)
Taxable individual retirement arrangement distribution: $17,816 (reported on 13.2% of returns)
62293:
$17,816
Illinois:
$21,613
(% of AGI for various income ranges: 67.9% for AGIs below $25k, 132.8% for AGIs $25k-50k, 258.4% for AGIs $50k-75k, 331.7% for AGIs $75k-100k, 1065.8% for AGIs $100k-200k)
Total itemized deductions: $25,564 (reported on 4.7% of returns)
Here:
$25,564
State:
$34,948
(% of AGI for various income ranges: 211.1% for AGIs $25k-50k, 262.8% for AGIs $75k-100k, 478.5% for AGIs $100k-200k)
Charity contributions: $6,214 (reported on 3.0% of returns)
Here:
$6,214
State:
$13,122
(% of AGI for various income ranges: 34.4% for AGIs $50k-75k, 105.8% for AGIs $100k-200k)
Taxes paid: $6,900 (reported on 4.7% of returns)
62293:
$6,900
State:
$8,563
(% of AGI for various income ranges: 37.2% for AGIs $25k-50k, 76.1% for AGIs $75k-100k, 147.9% for AGIs $100k-200k)
Earned income credit: $1,919 (reported on 9.0% of returns)
Here:
$1,919
State:
$2,311
(% of AGI for various income ranges: 54.0% for AGIs below $25k, 48.9% for AGIs $25k-50k)
Percentage of individuals using paid preparers for their 2020 taxes: 95.3%
Here:
95%
State:
93%
(% for various income ranges: 93.3% for AGIs below $25k, 95.6% for AGIs $25k-50k, 97.1% for AGIs $50k-75k, 92.6% for AGIs $75k-100k, 96.5% for AGIs $100k-200k, 100.0% for AGIs over 200k)
Averages for the 2012 tax year for zip code 62293, filed in 2013:
Average Adjusted Gross Income (AGI) in 2012: $59,422 (Individual Income Tax Returns)
Here:
$59,422
State:
$68,058
Salary/wage: $49,395 (reported on 82.1% of returns)
Here:
$49,395
State:
$55,396
(% of AGI for various income ranges: 74.0% for AGIs below $25k, 72.1% for AGIs $25k-50k, 69.2% for AGIs $50k-75k, 70.1% for AGIs $75k-100k, 72.3% for AGIs $100k-200k, 45.3% for AGIs over 200k)
Taxable interest for individuals: $1,291 (reported on 56.6% of returns)
This zip code:
$1,291
Illinois:
$1,969
(% of AGI for various income ranges: 3.3% for AGIs below $25k, 1.4% for AGIs $25k-50k, 1.1% for AGIs $50k-75k, 0.8% for AGIs $75k-100k, 0.8% for AGIs $100k-200k, 2.0% for AGIs over 200k)
Ordinary dividends: $3,238 (reported on 30.6% of returns)
Here:
$3,238
State:
$7,786
(% of AGI for various income ranges: 2.2% for AGIs below $25k, 1.4% for AGIs $25k-50k, 1.4% for AGIs $50k-75k, 1.0% for AGIs $75k-100k, 1.4% for AGIs $100k-200k, 3.8% for AGIs over 200k)
Net capital gain/loss in AGI: +$6,829 (reported on 20.9% of returns)
Here:
+$6,829
State:
+$22,183
(% of AGI for various income ranges: 0.5% for AGIs $25k-50k, 0.5% for AGIs $50k-75k, 0.6% for AGIs $75k-100k, 0.8% for AGIs $100k-200k, 15.7% for AGIs over 200k)
Profit/loss from business: +$8,878 (reported on 11.5% of returns)
Here:
+$8,878
State:
+$12,903
(% of AGI for various income ranges: 2.6% for AGIs below $25k, 1.4% for AGIs $25k-50k, 1.2% for AGIs $50k-75k, 1.1% for AGIs $75k-100k, 2.9% for AGIs $100k-200k)
Taxable individual retirement arrangement distribution: $11,220 (reported on 12.8% of returns)
62293:
$11,220
Illinois:
$17,929
(% of AGI for various income ranges: 3.4% for AGIs below $25k, 1.9% for AGIs $25k-50k, 2.4% for AGIs $50k-75k, 2.3% for AGIs $75k-100k, 3.3% for AGIs $100k-200k)
Total itemized deductions: $18,910 (19% of AGI, reported on 34.9% of returns)
Here:
$18,910
State:
$26,433
Here:
19.0% of AGI
State:
19.2% of AGI
(% of AGI for various income ranges: 7.3% for AGIs below $25k, 9.7% for AGIs $25k-50k, 10.4% for AGIs $50k-75k, 11.1% for AGIs $75k-100k, 12.0% for AGIs $100k-200k, 13.1% for AGIs over 200k)
Charity contributions: $2,784 (reported on 27.2% of returns)
Here:
$2,784
State:
$4,525
(% of AGI for various income ranges: 0.6% for AGIs below $25k, 0.8% for AGIs $25k-50k, 1.2% for AGIs $50k-75k, 1.1% for AGIs $75k-100k, 1.5% for AGIs $100k-200k, 1.7% for AGIs over 200k)
Taxes paid: $8,307 (reported on 34.9% of returns)
62293:
$8,307
State:
$11,968
(% of AGI for various income ranges: 1.6% for AGIs below $25k, 3.0% for AGIs $25k-50k, 3.8% for AGIs $50k-75k, 4.4% for AGIs $75k-100k, 6.0% for AGIs $100k-200k, 7.6% for AGIs over 200k)
Earned income credit: $1,960 (reported on 10.6% of returns)
Here:
$1,960
State:
$2,349
(% of AGI for various income ranges: 4.5% for AGIs below $25k, 0.6% for AGIs $25k-50k)
Percentage of individuals using paid preparers for their 2012 taxes: 65.5%
Here:
66%
State:
57%
(% for various income ranges: 57.1% for AGIs below $25k, 65.3% for AGIs $25k-50k, 71.8% for AGIs $50k-75k, 71.4% for AGIs $75k-100k, 70.3% for AGIs $100k-200k, 80.0% for AGIs over 200k)
Averages for the 2004 tax year for zip code 62293, filed in 2005:
Average Adjusted Gross Income (AGI) in 2004: $48,473 (Individual Income Tax Returns)
Here:
$48,473
State:
$54,625
Salary/wage: $42,327 (reported on 83.2% of returns)
Here:
$42,327
State:
$46,811
(% of AGI for various income ranges: 135.1% for AGIs below $10k, 70.4% for AGIs $10k-25k, 74.0% for AGIs $25k-50k, 77.0% for AGIs $50k-75k, 79.7% for AGIs $75k-100k, 61.6% for AGIs over 100k)
Taxable interest for individuals: $1,767 (reported on 69.7% of returns)
This zip code:
$1,767
Illinois:
$2,101
(% of AGI for various income ranges: 14.0% for AGIs below $10k, 5.3% for AGIs $10k-25k, 2.9% for AGIs $25k-50k, 1.9% for AGIs $50k-75k, 1.6% for AGIs $75k-100k, 2.4% for AGIs over 100k)
Taxable dividends: $1,699 (reported on 36.2% of returns)
Here:
$1,699
State:
$4,306
(% of AGI for various income ranges: 6.0% for AGIs below $10k, 1.5% for AGIs $10k-25k, 1.0% for AGIs $25k-50k, 1.0% for AGIs $50k-75k, 1.2% for AGIs $75k-100k, 1.4% for AGIs over 100k)
Net capital gain/loss: +$5,794 (reported on 25.5% of returns)
Here:
+$5,794
State:
+$17,321
(% of AGI for various income ranges: 3.8% for AGIs below $10k, 0.3% for AGIs $10k-25k, 1.0% for AGIs $25k-50k, 1.0% for AGIs $50k-75k, 1.4% for AGIs $75k-100k, 7.6% for AGIs over 100k)
Profit/loss from business: +$8,403 (reported on 14.0% of returns)
Here:
+$8,403
State:
+$11,771
(% of AGI for various income ranges: 3.3% for AGIs below $10k, 3.1% for AGIs $10k-25k, 2.2% for AGIs $25k-50k, 1.5% for AGIs $50k-75k, 2.9% for AGIs $75k-100k, 2.7% for AGIs over 100k)
Profit/loss from farming: +$152 (reported on 4.4% of returns)
Here:
+$152
State:
+$2,327
(% of AGI for various income ranges: -11.7% for AGIs below $10k, 0.3% for AGIs $10k-25k, 0.2% for AGIs $25k-50k, -0.0% for AGIs $50k-75k, 0.5% for AGIs $75k-100k, -0.1% for AGIs over 100k)
IRA payment deduction: $2,640 (reported on 3.4% of returns)
62293:
$2,640
Illinois:
$3,087
(% of AGI for various income ranges: 0.3% for AGIs $25k-50k, 0.2% for AGIs $50k-75k, 0.1% for AGIs $75k-100k, 0.2% for AGIs over 100k)
Self-employed pension: $4,364 (reported on 0.5% of returns)
Here:
$4,364
Illinois:
$16,965
Total itemized deductions: $15,032 (19% of AGI, reported on 32.1% of returns)
Here:
$15,032
State:
$20,239
Here:
18.6% of AGI
State:
19.5% of AGI
(% of AGI for various income ranges: 13.6% for AGIs below $10k, 10.6% for AGIs $10k-25k, 9.5% for AGIs $25k-50k, 8.6% for AGIs $50k-75k, 10.2% for AGIs $75k-100k, 10.7% for AGIs over 100k)
Charity contributions deductions: $2,465 (3% of AGI, reported on 26.5% of returns)
Here:
$2,465
State:
$3,719
Here:
2.8% of AGI
State:
3.4% of AGI
(% of AGI for various income ranges: 0.8% for AGIs below $10k, 0.9% for AGIs $10k-25k, 1.1% for AGIs $25k-50k, 0.9% for AGIs $50k-75k, 1.3% for AGIs $75k-100k, 2.0% for AGIs over 100k)
Total tax: $6,315 (reported on 82.7% of returns)
62293:
$6,315
State:
$9,882
(% of AGI for various income ranges: 2.6% for AGIs below $10k, 4.7% for AGIs $10k-25k, 7.3% for AGIs $25k-50k, 8.7% for AGIs $50k-75k, 10.4% for AGIs $75k-100k, 16.4% for AGIs over 100k)
Earned income credit: $1,459 (reported on 7.1% of returns)
Here:
$1,459
State:
$1,788
Percentage of individuals using paid preparers for their 2004 taxes: 67.8%
Here:
68%
State:
61%
(% for various income ranges: 58.3% for AGIs below $10k, 64.8% for AGIs $10k-25k, 70.4% for AGIs $25k-50k, 71.1% for AGIs $50k-75k, 73.5% for AGIs $75k-100k, 72.2% for AGIs over 100k)
Likely homosexual households (counted as self-reported same-sex unmarried-partner households)
Lesbian couples: 2.4% of all households
Gay men: 0.0% of all households
Household received Food Stamps/SNAP in the past 12 months: 69 Household did not receive Food Stamps/SNAP in the past 12 months: 1,783
Women who had a birth in the past 12 months: 59 (36 now married, 23 unmarried) Women who did not have a birth in the past 12 months: 852 (459 now married, 387 unmarried)
Housing units in zip code 62293 with a mortgage: 805 (55 second mortgage, 56 both second mortgage and home equity loan) Houses without a mortgage: 53
Median monthly owner costs for units with a mortgage: $1,589 Median monthly owner costs for units without a mortgage: $701
Residents with income below the poverty level in 2022:
This zip code:
8.4%
Whole state:
11.9%
Residents with income below 50% of the poverty level in 2022:
This zip code:
3.3%
Whole state:
5.7%
Median number of rooms in houses and condos:
Here:
6.1
State:
6.4
Median number of rooms in apartments:
Here:
3.7
State:
4.1
Notable locations in this zip code not listed on our city pages
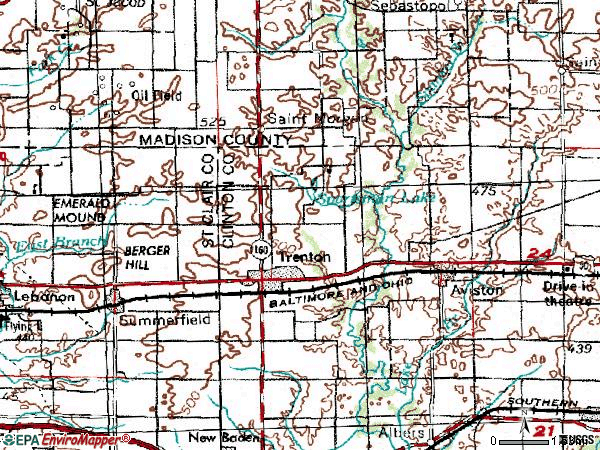
Notable locations in zip code 62293: Bizenberger Dairy Farm (A), Sugar Creek Ambulance (B), Sugar Creek Township Fire Protection District (C). Display/hide their locations on the map
Churches in zip code 62293 include: Sugar Creek Church (A), First United Methodist Church (B), Grace Community Baptist Church (C), Saint John United Church of Christ (D), Saint Marys Church (E), Saint Johns United Church of Christ (F). Display/hide their locations on the map
Cemeteries: Wittmer Cemetery (1), Trenton Cemetery (2), Saint Marys Cemetery (3), Sugar Creek Presbyterian Cemetery (4). Display/hide their locations on the map
In group quarters: 33 (-1 institutionalized population)
Size of family households: 619 2-persons, 266 3-persons, 183 4-persons, 117 5-persons, 37 6-persons, 11 7-or-more-persons
Size of nonfamily households: 568 1-person, 70 2-persons
669 married couples with children.
128 single-parent households (43 men, 85 women).
98.1% of residents of 62293 zip code speak English at home.
1.2% of residents speak other Indo-European language at home (100% very well).
0.5% of residents speak Asian or Pacific Island language at home (100% very well).
Foreign born population: 23 (0.5%) (100.0% of them are naturalized citizens)
This zip code:
0.5%
Whole state:
14.4%
70%France
13%Serbia
13%Malaysia
60%German
9%Irish
6%American
5%English
3%French
1%Dutch
1%European
Year of entry for the foreign-born population
02010 or later
22000 to 2009
171990 to 1999
33Before 1990
Facilities with environmental interests located in this zip code:
PACTIV CORPORATION (11620 OLD HIGHWAY 50 WEST in TRENTON, IL)
STATE MASTER (Illinois EPA Project) - AIR PROGRAM STATE MASTER (Illinois EPA Project) - National Pollutant Discharge Elimination System Permit AIR MAJOR (AIRS/AFS) CRITERIA AND HAZARDOUS AIR POLLUTANT INVENTORY (Inventory of air pollution sources) National Pollutant Discharge Elimination System NON-MAJOR (Tracking pollutant discharge elimination systems) - permit Conditionally Exempt Small Quantity Generators, less than 100 kg/month of hazardous waste (Resource Conservation and Recovery Act (tracking hazardous waste)) TRI REPORTER (Tracking of toxic chemicals releasing facilities) Business SIC classification: CONVERTED PAPER AND PAPERBOARD PRODUCTS; PLASTICS PRODUCTS Business NAICS classification: CORRUGATED AND SOLID FIBER BOX MANUFACTURING. Organizations: HEXACOMB CORP (CONTACT/OPERATOR)
, HEXACOMB CORPORATION (CONTACT/OWNER)
Alternative names: HEXACOMB CORP, HEXACOMB CORPORATION-TRENTON, PULSAR PLASTICS INC., TENNECO PACKAGING, HEXACOMB
JIM S FORMAL WEAR (ONE TUXEDO PARK in TRENTON, IL)
STATE MASTER (Illinois EPA Project) - HAZARDOUS WASTE PROGRAM, AIR PROGRAM, SOLID WASTE PROGRAM AIR MINOR (AIRS/AFS) CRITERIA AND HAZARDOUS AIR POLLUTANT INVENTORY (Inventory of air pollution sources) Small Quantity Generators, between 100 kg and 1000 kg of hazardous waste/month (Resource Conservation and Recovery Act (tracking hazardous waste)) Business SIC classification: DRYCLEANING PLANTS, EXCEPT RUG CLEANING Organizations: DAVIS GARY (CONTACT/OWNER)
Alternative names: JIMS FORMAL WEAR, JIMS FORMALWEAR CO
KAMPWERTH OIL CO (GRAVEL RD in TRENTON, IL)
STATE MASTER (Illinois EPA Project) - AIR PROGRAM AIR MINOR (AIRS/AFS) CRITERIA AND HAZARDOUS AIR POLLUTANT INVENTORY (Inventory of air pollution sources) Business SIC classification: PETROLEUM BULK STATIONS AND TERMINALS
KAPP MARBLE INC (467 E. BROADWAY in TRENTON, IL)
STATE MASTER (Illinois EPA Project) - AIR PROGRAM AIR MINOR (AIRS/AFS) CRITERIA AND HAZARDOUS AIR POLLUTANT INVENTORY (Inventory of air pollution sources) Business SIC classification: CUT STONE AND STONE PRODUCTS Business NAICS classification: CUT STONE AND STONE PRODUCT MANUFACTURING.
MEYER CONCRETE PRODUCTS INC (600 N. ASH ST. in TRENTON, IL)
STATE MASTER (Illinois EPA Project) - AIR PROGRAM AIR MINOR (AIRS/AFS) Business SIC classification: CONCRETE PRODUCTS, EXCEPT BLOCK AND BRICK
COMMUNITY BANK OF TRENTON (104 E BROADWAY in TRENTON, IL)
STATE MASTER (Illinois EPA Project) - AIR PROGRAM AIR MINOR (AIRS/AFS) Business SIC classification: OPERATORS OF NONRESIDENTIAL BUILDINGS
ILLINOIS VALLEY PAVING CO (ROUTE 160 NORTH in TRENTON, IL)
STATE MASTER (Illinois EPA Project) - AIR PROGRAM AIR MINOR (AIRS/AFS) Business SIC classification: ASPHALT PAVING MIXTURES AND BLOCKS
JERRY MIDDEKE (1005 E 3RD ST in TRENTON, IL)
STATE MASTER (Illinois EPA Project) - AIR PROGRAM AIR MINOR (AIRS/AFS) Business SIC classification: NONCLASSIFIABLE ESTABLISHMENTS
KUNZ CARPENTRY (16 E. BROADWAY in TRENTON, IL)
STATE MASTER (Illinois EPA Project) - AIR PROGRAM AIR MINOR (AIRS/AFS) Business SIC classification: NONCLASSIFIABLE ESTABLISHMENTS
ART CO LONDON (11 E WISCONSIN ST STE 200 in TRENTON, IL)
STATE MASTER (Illinois EPA Project) - SOLID WASTE PROGRAM, HAZARDOUS WASTE PROGRAM Conditionally Exempt Small Quantity Generators, less than 100 kg/month of hazardous waste (Resource Conservation and Recovery Act (tracking hazardous waste))
DEIEN CHEVROLET GEO (555 N MADISON in TRENTON, IL)
STATE MASTER (Illinois EPA Project) - SOLID WASTE PROGRAM, HAZARDOUS WASTE PROGRAM, SCRAP TIRE MANAGEMENT Conditionally Exempt Small Quantity Generators, less than 100 kg/month of hazardous waste (Resource Conservation and Recovery Act (tracking hazardous waste)) Organizations: DEIEN MELVIN (CONTACT/OWNER)
AMOCO FERTILIZER PLANT (W FRONT ST in TRENTON, IL)
(Resource Conservation and Recovery Act (tracking hazardous waste))
JIMS FORMAL WEAR CO (11 E WISCONSIN ST in TRENTON, IL)
(Resource Conservation and Recovery Act (tracking hazardous waste))
Housing units lacking complete plumbing facilities: 0.2% Housing units lacking complete kitchen facilities: 3.8%
48.9%Utility gas
23.9%Electricity
17.7%Bottled, tank, or LP gas
4.5%Other fuel
3.6%No fuel used
1.6%Wood
Population in 1990: 5,574.
Place of birth for U.S.-born residents:
This state: 3,208
Northeast: 277
Midwest: 400
South: 222
West: 157
67% of the 62293 zip code residents lived in the same house 5 years ago. Out of people who lived in different houses, 60% lived in this county. Out of people who lived in different counties, 50% lived in Illinois.
93% of the 62293 zip code residents lived in the same house 1 year ago. Out of people who lived in different houses, 38% moved from this county. Out of people who lived in different houses, 42% moved from different county within same state. Out of people who lived in different houses, 20% moved from different state. Out of people who lived in different houses, 2% moved from abroad.
Private vs. public school enrollment:
Students in private schools in grades 1 to 8 (elementary and middle school): 10
Here:
2.4%
Illinois:
13.3%
Students in private schools in grades 9 to 12 (high school): 13
Here:
8.2%
Illinois:
9.9%
Students in private undergraduate colleges: 78
Here:
51.4%
Illinois:
27.4%
Occupation by median earnings in the past 12 months ($)
161,035Law enforcement workers including supervisors
107,004Computer and mathematical occupations
88,835Management occupations
77,919Building and grounds cleaning and maintenance occupations
73,025Education, training, and library occupations
71,402Business and financial operations occupations
Companies with federal contracts located in this zip code:
BARTON ELECTRIC, INC (247 STATE ROUTE 160 in TRENTON, IL; small business) : $234,731 in 2 contractsin 2004
$232,378 with Air Force for Maintenance, Repair or Alteration of Real Property -- Office Buildings. Signed on 2004-05-17. Completion date: 2004-04-14.
$2,353, same as above.Signed on 2004-11-17. Completion date: 2004-12-01.
IE COMMUNICATIONS INC (21 W FRONT ST in TRENTON, IL; small business)
$3,192 with Army for Miscellaneous Communication Equipment. Signed on 2005-04-07. Completion date: 2005-04-11.
Top industries in this zip code by the number of employees in 2005:
Real Estate and Rental and Leasing: Formal Wear and Costume Rental (100-249 employees: 1 establishment)
Other Services (except Public Administration): Computer and Office Machine Repair and Maintenance (50-99: 1)
Accommodation and Food Services: Full-Service Restaurants (20-49: 1, 10-19: 1)
Wholesale Trade: Grain and Field Bean Merchant Wholesalers (20-49: 1, 10-19: 1)
Construction: New Single-Family Housing Construction (except Operative Builders) (20-49: 1, 1-4: 4)
Construction: Electrical Contractors (20-49: 1)
Wholesale Trade: Electrical Apparatus and Equipment, Wiring Supplies, and Related Equipment Merchant Wholesalers (20-49: 1)
People in group quarters in 2000:
16 people in other nonhousehold living situations
Fatal accident statistics in 2014:
Fatal accident count: 1
Vehicles involved in fatal accidents: 3
Fatal accidents caused by drunken drivers: 0
Fatalities: 1
Persons involved in fatal accidents: 3
Pedestrians involved in fatal accidents: 0
Home Mortgage Disclosure Act Aggregated Statistics For Year 2009 (Based on 4 partial tracts)
A) FHA, FSA/RHS & VA Home Purchase Loans
B) Conventional Home Purchase Loans
C) Refinancings
D) Home Improvement Loans
E) Loans on Dwellings For 5+ Families
F) Non-occupant Loans on < 5 Family Dwellings (A B C & D)
G) Loans On Manufactured Home Dwelling (A B C & D)
Number
Average Value
Number
Average Value
Number
Average Value
Number
Average Value
Number
Average Value
Number
Average Value
Number
Average Value
LOANS ORIGINATED
77
$153,819
110
$132,866
551
$156,288
50
$83,646
1
$1,415,830
33
$97,892
7
$43,016
APPLICATIONS APPROVED, NOT ACCEPTED
2
$83,040
7
$199,229
47
$189,276
1
$43,970
0
$0
2
$99,650
0
$0
APPLICATIONS DENIED
12
$127,295
13
$110,430
79
$152,470
10
$17,796
0
$0
5
$80,948
2
$69,145
APPLICATIONS WITHDRAWN
3
$186,377
15
$106,106
95
$143,501
0
$0
0
$0
4
$65,528
2
$92,865
FILES CLOSED FOR INCOMPLETENESS
1
$96,630
2
$120,980
17
$150,040
0
$0
0
$0
1
$60,170
2
$69,775
Aggregated Statistics For Year 2008 (Based on 4 partial tracts)
A) FHA, FSA/RHS & VA Home Purchase Loans
B) Conventional Home Purchase Loans
C) Refinancings
D) Home Improvement Loans
F) Non-occupant Loans on < 5 Family Dwellings (A B C & D)
G) Loans On Manufactured Home Dwelling (A B C & D)
Number
Average Value
Number
Average Value
Number
Average Value
Number
Average Value
Number
Average Value
Number
Average Value
LOANS ORIGINATED
53
$143,308
160
$143,427
279
$147,162
67
$51,794
41
$95,050
13
$62,283
APPLICATIONS APPROVED, NOT ACCEPTED
1
$61,910
8
$131,620
29
$129,976
2
$28,930
1
$14,470
5
$84,762
APPLICATIONS DENIED
3
$109,000
22
$114,566
88
$142,446
17
$61,886
9
$93,938
1
$79,850
APPLICATIONS WITHDRAWN
8
$120,829
13
$106,629
76
$144,702
7
$52,509
3
$84,090
1
$23,140
FILES CLOSED FOR INCOMPLETENESS
4
$132,275
1
$115,720
7
$144,571
0
$0
0
$0
0
$0
Aggregated Statistics For Year 2007 (Based on 4 partial tracts)
A) FHA, FSA/RHS & VA Home Purchase Loans
B) Conventional Home Purchase Loans
C) Refinancings
D) Home Improvement Loans
E) Loans on Dwellings For 5+ Families
F) Non-occupant Loans on < 5 Family Dwellings (A B C & D)
G) Loans On Manufactured Home Dwelling (A B C & D)
Number
Average Value
Number
Average Value
Number
Average Value
Number
Average Value
Number
Average Value
Number
Average Value
Number
Average Value
LOANS ORIGINATED
46
$121,934
208
$119,312
236
$125,800
87
$49,336
2
$194,820
38
$111,333
13
$137,362
APPLICATIONS APPROVED, NOT ACCEPTED
2
$143,720
14
$114,006
38
$118,739
7
$39,970
0
$0
2
$86,500
1
$51,500
APPLICATIONS DENIED
2
$127,005
22
$91,467
103
$113,932
41
$52,753
0
$0
8
$71,891
8
$60,810
APPLICATIONS WITHDRAWN
6
$121,383
20
$97,784
55
$139,664
10
$90,163
0
$0
1
$44,550
1
$24,880
FILES CLOSED FOR INCOMPLETENESS
0
$0
2
$166,925
12
$135,512
3
$131,757
0
$0
1
$70,590
0
$0
Aggregated Statistics For Year 2006 (Based on 4 partial tracts)
A) FHA, FSA/RHS & VA Home Purchase Loans
B) Conventional Home Purchase Loans
C) Refinancings
D) Home Improvement Loans
E) Loans on Dwellings For 5+ Families
F) Non-occupant Loans on < 5 Family Dwellings (A B C & D)
G) Loans On Manufactured Home Dwelling (A B C & D)
Number
Average Value
Number
Average Value
Number
Average Value
Number
Average Value
Number
Average Value
Number
Average Value
Number
Average Value
LOANS ORIGINATED
58
$135,917
248
$120,891
230
$107,584
73
$52,314
2
$135,805
41
$92,722
10
$58,114
APPLICATIONS APPROVED, NOT ACCEPTED
4
$143,928
13
$100,492
19
$85,384
9
$26,272
0
$0
3
$72,597
4
$40,358
APPLICATIONS DENIED
3
$119,370
34
$87,491
113
$124,988
22
$65,056
0
$0
6
$90,402
10
$68,217
APPLICATIONS WITHDRAWN
6
$100,027
19
$110,569
64
$110,453
7
$56,164
0
$0
5
$76,128
2
$86,210
FILES CLOSED FOR INCOMPLETENESS
1
$109,360
10
$106,636
21
$95,598
3
$44,840
0
$0
4
$123,428
0
$0
Aggregated Statistics For Year 2005 (Based on 4 partial tracts)
A) FHA, FSA/RHS & VA Home Purchase Loans
B) Conventional Home Purchase Loans
C) Refinancings
D) Home Improvement Loans
F) Non-occupant Loans on < 5 Family Dwellings (A B C & D)
G) Loans On Manufactured Home Dwelling (A B C & D)
Number
Average Value
Number
Average Value
Number
Average Value
Number
Average Value
Number
Average Value
Number
Average Value
LOANS ORIGINATED
51
$146,632
291
$121,840
314
$112,622
76
$42,800
57
$89,143
14
$55,433
APPLICATIONS APPROVED, NOT ACCEPTED
2
$169,885
14
$121,169
30
$122,462
6
$22,123
2
$80,425
1
$92,000
APPLICATIONS DENIED
3
$142,243
47
$105,430
123
$124,732
19
$23,769
2
$87,945
10
$70,678
APPLICATIONS WITHDRAWN
2
$133,670
27
$92,537
99
$109,048
14
$96,056
2
$82,450
5
$67,106
FILES CLOSED FOR INCOMPLETENESS
2
$104,630
5
$109,938
18
$110,503
1
$13,310
0
$0
0
$0
Aggregated Statistics For Year 2004 (Based on 4 partial tracts)
A) FHA, FSA/RHS & VA Home Purchase Loans
B) Conventional Home Purchase Loans
C) Refinancings
D) Home Improvement Loans
F) Non-occupant Loans on < 5 Family Dwellings (A B C & D)
G) Loans On Manufactured Home Dwelling (A B C & D)
Number
Average Value
Number
Average Value
Number
Average Value
Number
Average Value
Number
Average Value
Number
Average Value
LOANS ORIGINATED
40
$138,533
237
$117,795
317
$110,960
70
$29,739
41
$100,698
14
$60,190
APPLICATIONS APPROVED, NOT ACCEPTED
3
$130,570
19
$137,141
38
$101,807
6
$35,077
1
$108,200
6
$74,880
APPLICATIONS DENIED
6
$141,777
19
$81,261
118
$100,265
29
$49,270
7
$77,663
12
$63,212
APPLICATIONS WITHDRAWN
5
$105,972
14
$83,569
71
$96,848
3
$33,110
1
$131,920
1
$37,610
FILES CLOSED FOR INCOMPLETENESS
1
$85,630
3
$107,763
10
$72,922
1
$20,250
2
$90,840
0
$0
Aggregated Statistics For Year 2003 (Based on 4 partial tracts)
A) FHA, FSA/RHS & VA Home Purchase Loans
B) Conventional Home Purchase Loans
C) Refinancings
D) Home Improvement Loans
F) Non-occupant Loans on < 5 Family Dwellings (A B C & D)
Number
Average Value
Number
Average Value
Number
Average Value
Number
Average Value
Number
Average Value
LOANS ORIGINATED
30
$124,296
183
$109,988
892
$109,678
80
$39,551
41
$70,084
APPLICATIONS APPROVED, NOT ACCEPTED
3
$113,983
7
$90,684
75
$101,977
7
$20,641
1
$52,650
APPLICATIONS DENIED
6
$145,195
19
$112,308
129
$96,187
11
$27,346
7
$77,533
APPLICATIONS WITHDRAWN
0
$0
19
$92,321
85
$110,359
1
$59,020
2
$36,935
FILES CLOSED FOR INCOMPLETENESS
1
$48,600
4
$96,098
12
$94,769
0
$0
0
$0
Aggregated Statistics For Year 2002 (Based on 2 partial tracts)
A) FHA, FSA/RHS & VA Home Purchase Loans
B) Conventional Home Purchase Loans
C) Refinancings
D) Home Improvement Loans
E) Loans on Dwellings For 5+ Families
F) Non-occupant Loans on < 5 Family Dwellings (A B C & D)
Number
Average Value
Number
Average Value
Number
Average Value
Number
Average Value
Number
Average Value
Number
Average Value
LOANS ORIGINATED
22
$129,165
108
$97,234
390
$112,044
58
$26,659
0
$0
18
$87,838
APPLICATIONS APPROVED, NOT ACCEPTED
3
$112,933
8
$132,656
23
$115,606
3
$37,643
0
$0
0
$0
APPLICATIONS DENIED
2
$80,550
5
$101,308
23
$102,753
10
$24,746
0
$0
2
$71,415
APPLICATIONS WITHDRAWN
0
$0
10
$105,295
28
$109,494
2
$16,610
2
$103,800
0
$0
FILES CLOSED FOR INCOMPLETENESS
0
$0
3
$254,657
12
$115,841
0
$0
0
$0
0
$0
Aggregated Statistics For Year 2001 (Based on 2 partial tracts)
A) FHA, FSA/RHS & VA Home Purchase Loans
B) Conventional Home Purchase Loans
C) Refinancings
D) Home Improvement Loans
E) Loans on Dwellings For 5+ Families
F) Non-occupant Loans on < 5 Family Dwellings (A B C & D)
Number
Average Value
Number
Average Value
Number
Average Value
Number
Average Value
Number
Average Value
Number
Average Value
LOANS ORIGINATED
23
$96,976
118
$92,794
284
$93,917
66
$24,157
2
$91,345
25
$88,155
APPLICATIONS APPROVED, NOT ACCEPTED
0
$0
5
$83,704
27
$104,630
2
$5,815
0
$0
0
$0
APPLICATIONS DENIED
3
$132,310
17
$119,578
38
$93,617
12
$30,032
0
$0
2
$12,455
APPLICATIONS WITHDRAWN
0
$0
5
$137,514
28
$83,396
2
$67,260
0
$0
2
$149,470
FILES CLOSED FOR INCOMPLETENESS
0
$0
0
$0
7
$151,844
0
$0
0
$0
0
$0
Aggregated Statistics For Year 2000 (Based on 2 partial tracts)
A) FHA, FSA/RHS & VA Home Purchase Loans
B) Conventional Home Purchase Loans
C) Refinancings
D) Home Improvement Loans
F) Non-occupant Loans on < 5 Family Dwellings (A B C & D)
Number
Average Value
Number
Average Value
Number
Average Value
Number
Average Value
Number
Average Value
LOANS ORIGINATED
17
$108,734
76
$99,386
125
$79,931
71
$18,245
15
$53,921
APPLICATIONS APPROVED, NOT ACCEPTED
2
$84,700
0
$0
17
$63,013
3
$32,663
2
$74,735
APPLICATIONS DENIED
2
$58,960
8
$86,361
43
$65,157
12
$30,171
0
$0
APPLICATIONS WITHDRAWN
2
$95,495
2
$49,825
13
$103,736
5
$42,516
2
$49,825
FILES CLOSED FOR INCOMPLETENESS
2
$69,755
2
$81,380
8
$91,136
0
$0
0
$0
Aggregated Statistics For Year 1999 (Based on 1 partial tract)
A) FHA, FSA/RHS & VA Home Purchase Loans
B) Conventional Home Purchase Loans
C) Refinancings
D) Home Improvement Loans
F) Non-occupant Loans on < 5 Family Dwellings (A B C & D)
Detailed PMIC statistics for the following Tracts:5043.02
, 9001.00
2002 - 2018 National Fire Incident Reporting System (NFIRS) incidents
According to the data from the years 2002 - 2018 the average number of fires per year is 13. The highest number of fire incidents - 27 took place in 2006, and the least - 1 in 2002. The data has a growing trend.
When looking into fire subcategories, the most reports belonged to: Structure Fires (40.9%), and Outside Fires (40.5%).
Fire incident types reported to NFIRS in Zip Code 62293


 Nearest zip codes: 62289, 62216, 62281, 62265, 62254, 62266.


 According to the data from the years 2002 - 2018 the average number of fires per year is 13. The highest number of fire incidents - 27 took place in 2006, and the least - 1 in 2002. The data has a growing trend.
 When looking into fire subcategories, the most reports belonged to: Structure Fires (40.9%), and Outside Fires (40.5%).