Estimated zip code population in 2022: 863 Zip code population in 2010: 660 Zip code population in 2000: 740
Houses and condos: 322 Renter-occupied apartments: 63
% of renters here:
20%
State:
33%
March 2022 cost of living index in zip code 62316: 82.0 (low, U.S. average is 100)
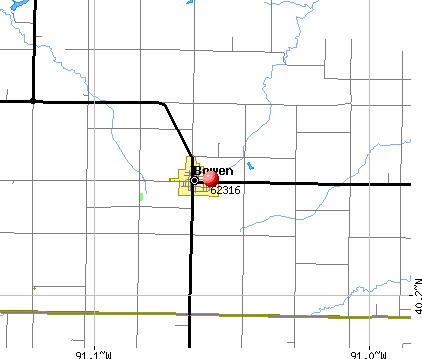
Land area: 41.2 sq. mi. Water area: 0.0 sq. mi.
Population density: 21 people per square mile
(very low).
OSM Map
General Map
Google Map
MSN Map
OSM Map
General Map
Google Map
MSN Map
OSM Map
General Map
Google Map
MSN Map
OSM Map
General Map
Google Map
MSN Map
Please wait while loading the map...
Real estate property taxes paid for housing units in 2022:
This zip code:
1.4% ($1,012)
Illinois:
2.0% ($4,912)
Median real estate property taxes paid for housing units with mortgages in 2022: $701 (0.9%) Median real estate property taxes paid for housing units with no mortgage in 2022: $1,521 (2.4%)
Business Search- 14 Million verified businesses
Males: 439
(50.8%)
Females: 424
(49.2%)
For population 25 years and over in 62316:
High school or higher: 88.9%
Bachelor's degree or higher: 13.5%
Graduate or professional degree: 3.5%
Unemployed: 4.3%
Mean travel time to work (commute): 26.9 minutes
For population 15 years and over in 62316:
Never married: 20.8%
Now married: 54.7%
Separated: 2.1%
Widowed: 10.4%
Divorced: 11.9%
Zip code 62316 compared to state average:
Median house value significantly below state average.
Black race population percentage significantly below state average.
Hispanic race population percentage significantly below state average.
Foreign-born population percentage significantly below state average.
Renting percentage below state average.
Length of stay since moving in above state average.
Percentage of population with a bachelor's degree or higher significantly below state average.
Estimated median house/condo value in 2022: $72,397
62316:
$72,397
Illinois:
$251,600
Median resident age:
This zip code:
38.5 years
Illinois median age:
39.1 years
Average household size:
This zip code:
2.7 people
Illinois:
2.4 people
Averages for the 2020 tax year for zip code 62316, filed in 2021:
Average Adjusted Gross Income (AGI) in 2020: $55,468 (Individual Income Tax Returns)
Here:
$55,468
State:
$82,626
Salary/wage: $43,436 (reported on 78.6% of returns)
Here:
$43,436
State:
$66,640
(% of AGI for various income ranges: 1350.0% for AGIs below $25k, 4712.0% for AGIs $25k-50k, 7023.3% for AGIs $50k-75k, 4967.5% for AGIs $75k-100k)
Taxable interest for individuals: $645 (reported on 39.3% of returns)
This zip code:
$645
Illinois:
$2,376
(% of AGI for various income ranges: 42.0% for AGIs $25k-50k, 40.0% for AGIs $50k-75k)
Ordinary dividends: $1,025 (reported on 14.3% of returns)
Here:
$1,025
State:
$9,061
(% of AGI for various income ranges: 34.0% for AGIs below $25k, 60.0% for AGIs $75k-100k)
Net capital gain/loss in AGI: +$375 (reported on 14.3% of returns)
Here:
+$375
State:
+$31,684
(% of AGI for various income ranges: 50.0% for AGIs $50k-75k)
Profit/loss from business: +$5,525 (reported on 14.3% of returns)
Here:
+$5,525
State:
+$12,175
(% of AGI for various income ranges: 442.0% for AGIs $25k-50k)
Earned income credit: $2,840 (reported on 17.9% of returns)
Here:
$2,840
State:
$2,311
(% of AGI for various income ranges: 284.0% for AGIs below $25k)
Percentage of individuals using paid preparers for their 2020 taxes: 96.4%
Here:
96%
State:
93%
(% for various income ranges: 87.5% for AGIs below $25k, 100.0% for AGIs $25k-50k, 100.0% for AGIs $50k-75k, 100.0% for AGIs $75k-100k, 100.0% for AGIs $100k-200k)
Averages for the 2012 tax year for zip code 62316, filed in 2013:
Average Adjusted Gross Income (AGI) in 2012: $44,143 (Individual Income Tax Returns)
Here:
$44,143
State:
$68,058
Salary/wage: $36,583 (reported on 85.7% of returns)
Here:
$36,583
State:
$55,396
(% of AGI for various income ranges: 78.7% for AGIs below $25k, 85.9% for AGIs $25k-50k, 75.6% for AGIs $50k-75k, 75.0% for AGIs $75k-100k, 46.6% for AGIs $100k-200k)
Taxable interest for individuals: $540 (reported on 35.7% of returns)
This zip code:
$540
Illinois:
$1,969
(% of AGI for various income ranges: 0.2% for AGIs below $25k, 0.3% for AGIs $25k-50k, 1.0% for AGIs $50k-75k, 0.5% for AGIs $75k-100k)
Ordinary dividends: $900 (reported on 14.3% of returns)
Here:
$900
State:
$7,786
Net capital gain/loss in AGI: +$25 (reported on 14.3% of returns)
Here:
+$25
State:
+$22,183
Profit/loss from business: +$2,340 (reported on 17.9% of returns)
Here:
+$2,340
State:
+$12,903
Taxable individual retirement arrangement distribution: $3,367 (reported on 10.7% of returns)
62316:
$3,367
Illinois:
$17,929
Total itemized deductions: $18,850 (24% of AGI, reported on 14.3% of returns)
Here:
$18,850
State:
$26,433
Here:
24.1% of AGI
State:
19.2% of AGI
Charity contributions: $4,400 (reported on 7.1% of returns)
Here:
$4,400
State:
$4,525
Taxes paid: $4,950 (reported on 14.3% of returns)
62316:
$4,950
State:
$11,968
Earned income credit: $2,150 (reported on 21.4% of returns)
Here:
$2,150
State:
$2,349
(% of AGI for various income ranges: 5.9% for AGIs below $25k, 1.8% for AGIs $25k-50k)
Percentage of individuals using paid preparers for their 2012 taxes: 82.1%
Here:
82%
State:
57%
(% for various income ranges: 72.7% for AGIs below $25k, 85.7% for AGIs $25k-50k, 100.0% for AGIs $50k-75k, 66.7% for AGIs $75k-100k, 100.0% for AGIs $100k-200k)
Averages for the 2004 tax year for zip code 62316, filed in 2005:
Average Adjusted Gross Income (AGI) in 2004: $32,273 (Individual Income Tax Returns)
Here:
$32,273
State:
$54,625
Salary/wage: $26,477 (reported on 83.6% of returns)
Here:
$26,477
State:
$46,811
(% of AGI for various income ranges: 85.6% for AGIs below $10k, 72.9% for AGIs $10k-25k, 70.3% for AGIs $25k-50k, 80.5% for AGIs $50k-75k, 54.7% for AGIs $75k-100k)
Taxable interest for individuals: $992 (reported on 40.5% of returns)
This zip code:
$992
Illinois:
$2,101
(% of AGI for various income ranges: 5.8% for AGIs below $10k, 1.8% for AGIs $10k-25k, 1.8% for AGIs $25k-50k, 0.3% for AGIs $50k-75k, 0.7% for AGIs $75k-100k)
Taxable dividends: $603 (reported on 21.9% of returns)
Here:
$603
State:
$4,306
(% of AGI for various income ranges: 0.8% for AGIs below $10k, 1.2% for AGIs $10k-25k, 0.5% for AGIs $25k-50k, 0.2% for AGIs $50k-75k, 0.1% for AGIs $75k-100k)
Net capital gain/loss: +$3,059 (reported on 16.4% of returns)
Here:
+$3,059
State:
+$17,321
(% of AGI for various income ranges: 0.0% for AGIs below $10k, -0.1% for AGIs $25k-50k, 0.7% for AGIs $50k-75k, 4.4% for AGIs $75k-100k)
Profit/loss from business: +$1,632 (reported on 12.2% of returns)
Here:
+$1,632
State:
+$11,771
Profit/loss from farming: +$5,350 (reported on 12.9% of returns)
Here:
+$5,350
State:
+$2,327
Total itemized deductions: $13,900 (20% of AGI, reported on 9.6% of returns)
Here:
$13,900
State:
$20,239
Here:
20.2% of AGI
State:
19.5% of AGI
Charity contributions deductions: $2,500 (4% of AGI, reported on 6.4% of returns)
Here:
$2,500
State:
$3,719
Here:
4.1% of AGI
State:
3.4% of AGI
Total tax: $4,090 (reported on 71.7% of returns)
62316:
$4,090
State:
$9,882
(% of AGI for various income ranges: 2.1% for AGIs below $10k, 3.9% for AGIs $10k-25k, 6.9% for AGIs $25k-50k, 7.8% for AGIs $50k-75k, 15.0% for AGIs $75k-100k)
Earned income credit: $2,038 (reported on 16.7% of returns)
Here:
$2,038
State:
$1,788
Percentage of individuals using paid preparers for their 2004 taxes: 84.6%
Here:
85%
State:
61%
(% for various income ranges: 78.3% for AGIs below $10k, 85.5% for AGIs $10k-25k, 85.7% for AGIs $25k-50k, 92.1% for AGIs $50k-75k, 86.7% for AGIs $75k-100k)
Household received Food Stamps/SNAP in the past 12 months: 56 Household did not receive Food Stamps/SNAP in the past 12 months: 265
Women who had a birth in the past 12 months: 12 (3 now married, 8 unmarried) Women who did not have a birth in the past 12 months: 146 (97 now married, 46 unmarried)
Housing units in zip code 62316 with a mortgage: 148 (1 second mortgage, 1 both second mortgage and home equity loan) Median monthly owner costs for units with a mortgage: $918 Median monthly owner costs for units without a mortgage: $402
Residents with income below the poverty level in 2022:
This zip code:
10.0%
Whole state:
11.9%
Residents with income below 50% of the poverty level in 2022:
This zip code:
7.6%
Whole state:
5.7%
Median number of rooms in houses and condos:
Here:
6.7
State:
6.4
Median number of rooms in apartments:
Here:
5.4
State:
4.1
Notable locations in this zip code not listed on our city pages
Size of family households: 61 2-persons, 25 3-persons, 55 4-persons, 17 5-persons, 10 6-persons, 3 7-or-more-persons
Size of nonfamily households: 131 1-person, 15 2-persons
153 married couples with children.
72 single-parent households (48 men, 24 women).
99.0% of residents of 62316 zip code speak English at home.
0.1% of residents speak other language at home (100% not well).
Foreign born population: 4 (0.5%) (50.2% of them are naturalized citizens)
This zip code:
0.5%
Whole state:
14.4%
25%North Macedonia (Macedonia)
27%German
13%Irish
9%English
8%American
7%Scottish
3%Italian
2%Norwegian
Year of entry for the foreign-born population
22010 or later
02000 to 2009
01990 to 1999
21Before 1990
Facilities with environmental interests located in this zip code:
HANCOCK SERVICE CO (STATE ROUTE NO 61 in BOWEN, IL)
STATE MASTER (Illinois EPA Project) - AIR PROGRAM AIR MINOR (AIRS/AFS) Business SIC classification: PETROLEUM BULK STATIONS AND TERMINALS
BOWEN STP (250 N. 2200 E. in BOWEN, IL)
STATE MASTER (Illinois EPA Project) - National Pollutant Discharge Elimination System Permit National Pollutant Discharge Elimination System NON-MAJOR (Tracking pollutant discharge elimination systems) - permit Business SIC classification: SEWERAGE SYSTEMS Alternative names: BOWEN STP, VILLAGE OF
HANCOCK SERVICE CO (HWY 61 in BOWEN, IL)
(Resource Conservation and Recovery Act (tracking hazardous waste)) Organizations: HANCOCK SERVICE COMPANY (CONTACT/OWNER)
BOWEN MINI MART (HWY 61 B in BOWEN, IL)
Large Quantity Generators, more that 1000 kg of hazardous waste/month (Resource Conservation and Recovery Act (tracking hazardous waste)) - notification TRANSPORTER (Resource Conservation and Recovery Act (tracking hazardous waste)) - notification Organizations: MUNGER DONALD AND CAROLYN (CONTACT/OWNER)
MECUM SVC STATION (5TH ST in BOWEN, IL)
Large Quantity Generators, more that 1000 kg of hazardous waste/month (Resource Conservation and Recovery Act (tracking hazardous waste)) - notification Organizations: MECUM FLOYD L (CONTACT/OWNER)
CHEM GRO INC (330 N CO RD 2300 in BOWEN, IL)
ENFORCEMENT/COMPLIANCE ACTIVITY (Integrated Compliance Information System) COMPLIANCE ACTIVITY (Tracking inspections of insecticide, fungicide, and rodenticide, and toxic substances) Alternative names: CHEM BRO INC
CHEM GRO INC. (NORTHEAST) (1740 E. COUNTY ROAD 400 in BOWEN, IL)
ENFORCEMENT/COMPLIANCE ACTIVITY (Integrated Compliance Information System)
CHEM GRO INC. (NORTHWEST) (330 NORTH COUNTY ROAD 2300 in BOWEN, IL)
ENFORCEMENT/COMPLIANCE ACTIVITY (Integrated Compliance Information System)
48.6%Utility gas
33.0%Electricity
16.0%Bottled, tank, or LP gas
1.6%Wood
1.6%Other fuel
Population in 1990: 693. Population change in the 1990s: +47 (+6.8%).
Place of birth for U.S.-born residents:
This state: 671
Northeast: 2
Midwest: 132
South: 16
West: 16
66% of the 62316 zip code residents lived in the same house 5 years ago. Out of people who lived in different houses, 55% lived in this county. Out of people who lived in different counties, 50% lived in Illinois.
90% of the 62316 zip code residents lived in the same house 1 year ago. Out of people who lived in different houses, 30% moved from this county. Out of people who lived in different houses, 64% moved from different county within same state. Out of people who lived in different houses, 4% moved from different state. Out of people who lived in different houses, 4% moved from abroad.
Private vs. public school enrollment:
Students in private schools in grades 1 to 8 (elementary and middle school): 9
Here:
8.7%
Illinois:
13.3%
Students in private schools in grades 9 to 12 (high school):
Here:
0.0%
Illinois:
9.9%
Students in private undergraduate colleges:
Here:
0.0%
Illinois:
27.4%
Occupation by median earnings in the past 12 months ($)
59,358Transportation occupations
57,923Management occupations
55,085Health technologists and technicians
53,542Construction and extraction occupations
48,329Production occupations
40,554Material moving occupations
Top industries in this zip code by the number of employees in 2005:
Finance and Insurance: Insurance Agencies and Brokerages (5-9 employees: 1 establishment)
Other Services (except Public Administration): Religious Organizations (1-4: 2)
Professional, Scientific, and Technical Services: Other Accounting Services (1-4: 1)
Accommodation and Food Services: Snack and Nonalcoholic Beverage Bars (1-4: 1)
Other Services (except Public Administration): Commercial and Industrial Machinery and Equipment (except Automotive and Electronic) Repair and Maintenance (1-4: 1)
Most common first names in zip code 62316 among deceased individuals
Name
Count
Lived (average)
John
8
77.4 years
William
8
75.5 years
Fred
6
81.8 years
Mary
6
78.3 years
Donald
5
63.8 years
Frank
5
82.6 years
James
5
78.6 years
Kenneth
4
71.5 years
Alice
4
90.5 years
Anna
4
85.0 years
Most common last names in zip code 62316 among deceased individuals
Last name
Count
Lived (average)
Akers
7
83.4 years
Harrison
7
80.1 years
Veach
5
79.6 years
Nelson
5
78.4 years
Mecum
4
83.2 years
Koch
4
77.8 years
Crossland
4
80.5 years
Witt
4
73.0 years
Esslinger
4
77.7 years
Sherrick
4
78.0 years
Discuss Bowen, Illinois (IL) on our hugely popular Illinois forum.

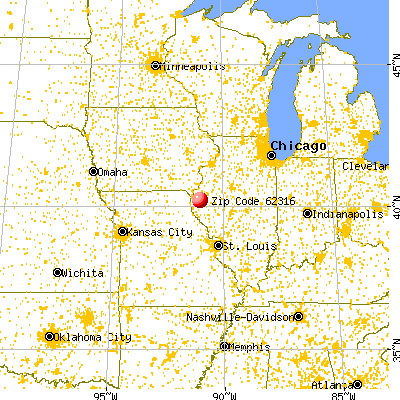


 Nearest zip codes: 62339, 62311, 62346, 62380, 62349, 62321.


