Estimated zip code population in 2022: 2,521 Zip code population in 2010: 2,185 Zip code population in 2000: 2,257
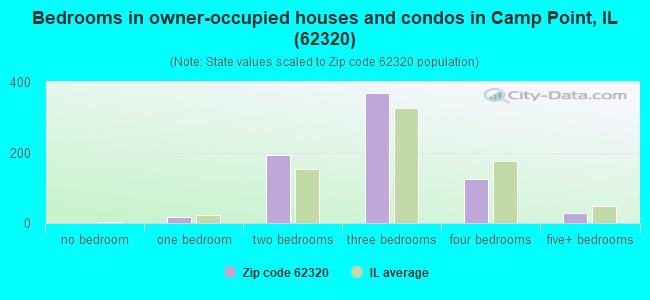
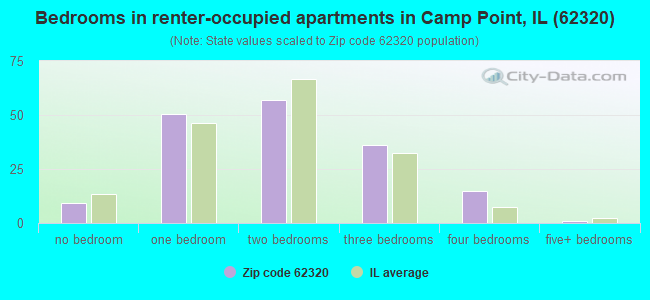
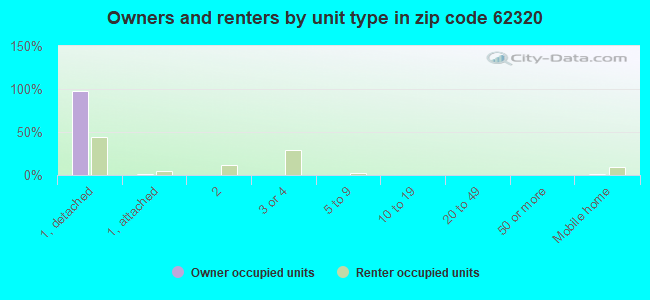
Houses and condos: 977 Renter-occupied apartments: 169
% of renters here:
19%
State:
33%
March 2022 cost of living index in zip code 62320: 84.1 (less than average, U.S. average is 100)
Land area: 87.1 sq. mi. Water area: 0.1 sq. mi.
Population density: 29 people per square mile
(very low).
OSM Map
General Map
Google Map
MSN Map
OSM Map
General Map
Google Map
MSN Map
OSM Map
General Map
Google Map
MSN Map
OSM Map
General Map
Google Map
MSN Map
Please wait while loading the map...
Real estate property taxes paid for housing units in 2022:
This zip code:
1.4% ($2,369)
Illinois:
2.0% ($4,912)
Median real estate property taxes paid for housing units with mortgages in 2022: $2,854 (1.5%) Median real estate property taxes paid for housing units with no mortgage in 2022: $1,873 (1.4%)
Business Search- 14 Million verified businesses
Males: 1,270
(50.4%)
Females: 1,250
(49.6%)
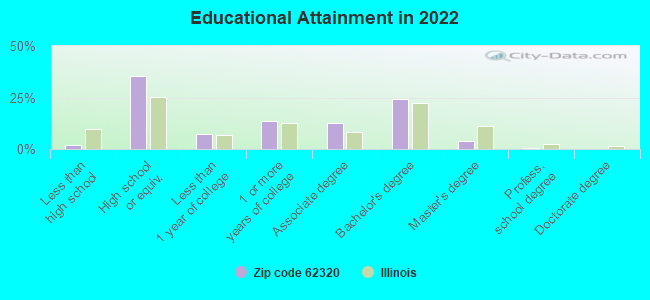
For population 25 years and over in 62320:
High school or higher: 97.6%
Bachelor's degree or higher: 28.5%
Graduate or professional degree: 4.6%
Unemployed: 1.0%
Mean travel time to work (commute): 23.1 minutes
For population 15 years and over in 62320:
Never married: 28.9%
Now married: 48.4%
Separated: 0.7%
Widowed: 8.7%
Divorced: 13.3%
Zip code 62320 compared to state average:
Unemployed percentage significantly below state average.
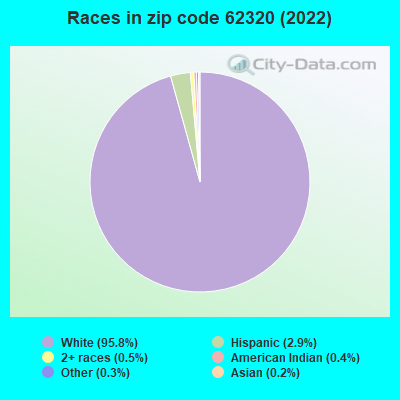
Black race population percentage significantly below state average.
Hispanic race population percentage significantly below state average.
Foreign-born population percentage significantly below state average.
Averages for the 2020 tax year for zip code 62320, filed in 2021:
Average Adjusted Gross Income (AGI) in 2020: $63,640 (Individual Income Tax Returns)
Here:
$63,640
State:
$82,626
Salary/wage: $52,479 (reported on 85.9% of returns)
Here:
$52,479
State:
$66,640
(% of AGI for various income ranges: 1362.4% for AGIs below $25k, 4218.9% for AGIs $25k-50k, 6831.8% for AGIs $50k-75k, 10583.8% for AGIs $75k-100k, 18715.0% for AGIs $100k-200k)
Taxable interest for individuals: $930 (reported on 43.4% of returns)
This zip code:
$930
Illinois:
$2,376
(% of AGI for various income ranges: 17.1% for AGIs below $25k, 36.1% for AGIs $25k-50k, 19.1% for AGIs $50k-75k, 55.0% for AGIs $75k-100k, 241.0% for AGIs $100k-200k)
Ordinary dividends: $3,368 (reported on 19.2% of returns)
Here:
$3,368
State:
$9,061
(% of AGI for various income ranges: 9.4% for AGIs below $25k, 55.6% for AGIs $25k-50k, 70.0% for AGIs $50k-75k, 41.2% for AGIs $75k-100k, 414.0% for AGIs $100k-200k)
Net capital gain/loss in AGI: +$5,200 (reported on 19.2% of returns)
Here:
+$5,200
State:
+$31,684
(% of AGI for various income ranges: 4.7% for AGIs below $25k, 47.8% for AGIs $25k-50k, 86.2% for AGIs $75k-100k, 825.0% for AGIs $100k-200k)
Profit/loss from business: +$6,594 (reported on 17.2% of returns)
Here:
+$6,594
State:
+$12,175
(% of AGI for various income ranges: 105.9% for AGIs below $25k, 135.6% for AGIs $25k-50k, 126.4% for AGIs $50k-75k, 280.0% for AGIs $75k-100k, 334.0% for AGIs $100k-200k)
Taxable individual retirement arrangement distribution: $14,500 (reported on 9.1% of returns)
62320:
$14,500
Illinois:
$21,613
(% of AGI for various income ranges: 226.5% for AGIs below $25k, 428.2% for AGIs $50k-75k, 449.0% for AGIs $100k-200k)
Total itemized deductions: $33,650 (reported on 2.0% of returns)
Here:
$33,650
State:
$34,948
(% of AGI for various income ranges: 841.2% for AGIs $75k-100k)
Taxes paid: $9,050 (reported on 2.0% of returns)
62320:
$9,050
State:
$8,563
(% of AGI for various income ranges: 226.3% for AGIs $75k-100k)
Earned income credit: $2,115 (reported on 13.1% of returns)
Here:
$2,115
State:
$2,311
(% of AGI for various income ranges: 75.9% for AGIs below $25k, 81.1% for AGIs $25k-50k)
Percentage of individuals using paid preparers for their 2020 taxes: 92.9%
Here:
93%
State:
93%
(% for various income ranges: 88.9% for AGIs below $25k, 96.0% for AGIs $25k-50k, 93.3% for AGIs $50k-75k, 92.3% for AGIs $75k-100k, 94.1% for AGIs $100k-200k, 100.0% for AGIs over 200k)
Averages for the 2012 tax year for zip code 62320, filed in 2013:
Average Adjusted Gross Income (AGI) in 2012: $46,183 (Individual Income Tax Returns)
Here:
$46,183
State:
$68,058
Salary/wage: $39,625 (reported on 85.3% of returns)
Here:
$39,625
State:
$55,396
(% of AGI for various income ranges: 75.3% for AGIs below $25k, 82.8% for AGIs $25k-50k, 76.2% for AGIs $50k-75k, 76.2% for AGIs $75k-100k, 60.9% for AGIs $100k-200k)
Taxable interest for individuals: $926 (reported on 42.2% of returns)
This zip code:
$926
Illinois:
$1,969
(% of AGI for various income ranges: 1.6% for AGIs below $25k, 0.6% for AGIs $25k-50k, 0.7% for AGIs $50k-75k, 0.8% for AGIs $75k-100k, 1.0% for AGIs $100k-200k)
Ordinary dividends: $1,994 (reported on 17.6% of returns)
Here:
$1,994
State:
$7,786
(% of AGI for various income ranges: 0.8% for AGIs below $25k, 0.5% for AGIs $25k-50k, 0.3% for AGIs $50k-75k, 1.1% for AGIs $75k-100k, 1.1% for AGIs $100k-200k)
Net capital gain/loss in AGI: +$4,188 (reported on 16.7% of returns)
Here:
+$4,188
State:
+$22,183
(% of AGI for various income ranges: 1.6% for AGIs below $25k, 0.4% for AGIs $25k-50k, 0.8% for AGIs $50k-75k, 2.4% for AGIs $75k-100k, 2.3% for AGIs $100k-200k)
Profit/loss from business: +$7,553 (reported on 16.7% of returns)
Here:
+$7,553
State:
+$12,903
(% of AGI for various income ranges: 6.3% for AGIs below $25k, 2.4% for AGIs $25k-50k, 2.1% for AGIs $50k-75k, 2.9% for AGIs $75k-100k, 2.2% for AGIs $100k-200k)
Taxable individual retirement arrangement distribution: $10,056 (reported on 8.8% of returns)
62320:
$10,056
Illinois:
$17,929
(% of AGI for various income ranges: 3.3% for AGIs below $25k, 1.6% for AGIs $25k-50k, 2.8% for AGIs $50k-75k, 3.1% for AGIs $75k-100k)
Total itemized deductions: $18,505 (23% of AGI, reported on 20.6% of returns)
Here:
$18,505
State:
$26,433
Here:
23.0% of AGI
State:
19.2% of AGI
(% of AGI for various income ranges: 13.1% for AGIs below $25k, 4.9% for AGIs $25k-50k, 8.0% for AGIs $50k-75k, 8.5% for AGIs $75k-100k, 8.9% for AGIs $100k-200k)
Charity contributions: $4,142 (reported on 11.8% of returns)
Here:
$4,142
State:
$4,525
(% of AGI for various income ranges: 1.1% for AGIs below $25k, 0.9% for AGIs $50k-75k, 1.3% for AGIs $75k-100k, 1.8% for AGIs $100k-200k)
Taxes paid: $6,110 (reported on 19.6% of returns)
62320:
$6,110
State:
$11,968
(% of AGI for various income ranges: 1.1% for AGIs below $25k, 1.4% for AGIs $25k-50k, 1.9% for AGIs $50k-75k, 2.9% for AGIs $75k-100k, 4.5% for AGIs $100k-200k)
Earned income credit: $2,118 (reported on 16.7% of returns)
Here:
$2,118
State:
$2,349
(% of AGI for various income ranges: 5.0% for AGIs below $25k, 1.5% for AGIs $25k-50k)
Percentage of individuals using paid preparers for their 2012 taxes: 77.5%
Here:
77%
State:
57%
(% for various income ranges: 69.2% for AGIs below $25k, 80.0% for AGIs $25k-50k, 84.2% for AGIs $50k-75k, 90.0% for AGIs $75k-100k, 77.8% for AGIs $100k-200k)
Averages for the 2004 tax year for zip code 62320, filed in 2005:
Average Adjusted Gross Income (AGI) in 2004: $35,637 (Individual Income Tax Returns)
Here:
$35,637
State:
$54,625
Salary/wage: $33,207 (reported on 84.4% of returns)
Here:
$33,207
State:
$46,811
(% of AGI for various income ranges: 77.4% for AGIs below $10k, 77.8% for AGIs $10k-25k, 78.7% for AGIs $25k-50k, 80.3% for AGIs $50k-75k, 87.8% for AGIs $75k-100k, 63.1% for AGIs over 100k)
Taxable interest for individuals: $1,137 (reported on 51.8% of returns)
This zip code:
$1,137
Illinois:
$2,101
(% of AGI for various income ranges: 8.9% for AGIs below $10k, 3.3% for AGIs $10k-25k, 1.9% for AGIs $25k-50k, 1.0% for AGIs $50k-75k, 0.4% for AGIs $75k-100k, 1.4% for AGIs over 100k)
Taxable dividends: $1,140 (reported on 23.9% of returns)
Here:
$1,140
State:
$4,306
(% of AGI for various income ranges: 0.9% for AGIs below $10k, 0.7% for AGIs $10k-25k, 1.3% for AGIs $25k-50k, 0.4% for AGIs $50k-75k, 0.1% for AGIs $75k-100k, 1.2% for AGIs over 100k)
Net capital gain/loss: +$2,104 (reported on 19.5% of returns)
Here:
+$2,104
State:
+$17,321
(% of AGI for various income ranges: -1.8% for AGIs below $10k, -0.2% for AGIs $10k-25k, 1.8% for AGIs $25k-50k, 1.5% for AGIs $50k-75k, 1.0% for AGIs $75k-100k, 1.1% for AGIs over 100k)
Profit/loss from business: +$5,418 (reported on 17.2% of returns)
Here:
+$5,418
State:
+$11,771
(% of AGI for various income ranges: 5.0% for AGIs below $10k, 6.6% for AGIs $10k-25k, 2.6% for AGIs $25k-50k, 2.0% for AGIs $50k-75k, 2.3% for AGIs $75k-100k)
Profit/loss from farming: +$3,024 (reported on 12.4% of returns)
Here:
+$3,024
State:
+$2,327
(% of AGI for various income ranges: 4.5% for AGIs below $10k, -1.0% for AGIs $10k-25k, 1.0% for AGIs $25k-50k, 2.0% for AGIs $50k-75k, 1.0% for AGIs $75k-100k)
IRA payment deduction: $3,344 (reported on 3.2% of returns)
62320:
$3,344
Illinois:
$3,087
Total itemized deductions: $15,820 (23% of AGI, reported on 16.9% of returns)
Here:
$15,820
State:
$20,239
Here:
22.8% of AGI
State:
19.5% of AGI
(% of AGI for various income ranges: 4.3% for AGIs $10k-25k, 7.6% for AGIs $25k-50k, 6.4% for AGIs $50k-75k, 10.5% for AGIs $75k-100k, 10.5% for AGIs over 100k)
Charity contributions deductions: $3,115 (4% of AGI, reported on 13.2% of returns)
Here:
$3,115
State:
$3,719
Here:
4.1% of AGI
State:
3.4% of AGI
(% of AGI for various income ranges: 1.0% for AGIs $25k-50k, 1.0% for AGIs $50k-75k, 1.9% for AGIs $75k-100k, 2.2% for AGIs over 100k)
Total tax: $4,158 (reported on 74.2% of returns)
62320:
$4,158
State:
$9,882
(% of AGI for various income ranges: 2.8% for AGIs below $10k, 4.6% for AGIs $10k-25k, 6.7% for AGIs $25k-50k, 8.2% for AGIs $50k-75k, 9.8% for AGIs $75k-100k, 17.8% for AGIs over 100k)
Earned income credit: $1,693 (reported on 13.9% of returns)
Here:
$1,693
State:
$1,788
Percentage of individuals using paid preparers for their 2004 taxes: 75.0%
Here:
75%
State:
61%
(% for various income ranges: 68.2% for AGIs below $10k, 75.4% for AGIs $10k-25k, 76.3% for AGIs $25k-50k, 77.9% for AGIs $50k-75k, 78.3% for AGIs $75k-100k, 88.0% for AGIs over 100k)
Likely homosexual households (counted as self-reported same-sex unmarried-partner households)
Lesbian couples: 0.0% of all households
Gay men: 0.3% of all households
Household received Food Stamps/SNAP in the past 12 months: 104 Household did not receive Food Stamps/SNAP in the past 12 months: 793
Women who had a birth in the past 12 months: 45 (38 now married, 6 unmarried) Women who did not have a birth in the past 12 months: 505 (197 now married, 308 unmarried)
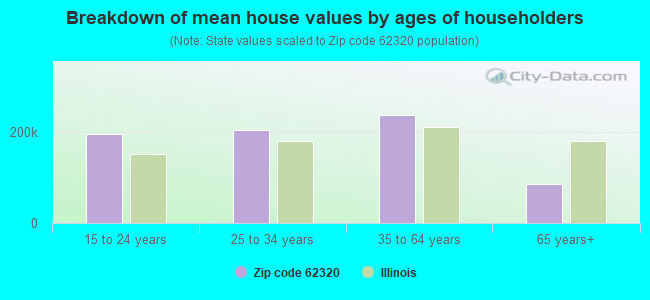
Housing units in zip code 62320 with a mortgage: 448 (17 second mortgage, 3 both second mortgage and home equity loan) Median monthly owner costs for units with a mortgage: $1,520 Median monthly owner costs for units without a mortgage: $551
Residents with income below the poverty level in 2022:
This zip code:
7.0%
Whole state:
11.9%
Residents with income below 50% of the poverty level in 2022:
This zip code:
3.2%
Whole state:
5.7%
Median number of rooms in houses and condos:
Here:
6.6
State:
6.4
Median number of rooms in apartments:
Here:
4.2
State:
4.1
Notable locations in this zip code not listed on our city pages
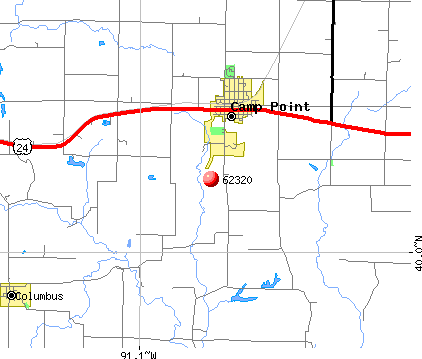
Notable locations in zip code 62320: Camp Mohawk (A), Camp Callahan (B), Adams County Ambulance Emergency Medical Services (C), Camp Point Fire Protection District (D). Display/hide their locations on the map
Churches in zip code 62320 include: Camp Point United Methodist Church (A), First Christian Church (B), Saint Thomas Church (C), Faith Church (D), Lost Prairie Church (E). Display/hide their locations on the map
Cemeteries: Earel Cemetery (1), Hufnagel Cemetery (2), Pleasant View Cemetery (3), Saint Peters Evangelical Lutheran Cemetery (4), Wilkes Cemetery (5), Wolf Ridge Cemetery (6), York Neck Cemetery (7). Display/hide their locations on the map
In group quarters: 82 (-1 institutionalized population)
Size of family households: 203 2-persons, 164 3-persons, 97 4-persons, 95 5-persons, 36 6-persons, 9 7-or-more-persons
Size of nonfamily households: 257 1-person, 28 2-persons
548 married couples with children.
249 single-parent households (123 men, 126 women).
98.5% of residents of 62320 zip code speak English at home.
0.4% of residents speak other Indo-European language at home (100% very well).
0.2% of residents speak Asian or Pacific Island language at home (100% very well).
0.3% of residents speak other language at home (100% very well).
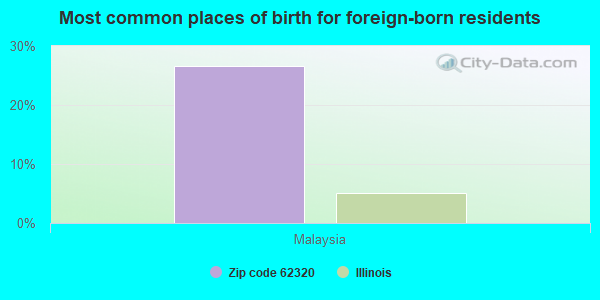
Foreign born population: 15 (0.6%) (100.0% of them are naturalized citizens)
This zip code:
0.6%
Whole state:
14.4%
27%Malaysia
45%German
29%English
9%American
6%Irish
2%Dutch
2%Scottish
1%Welsh
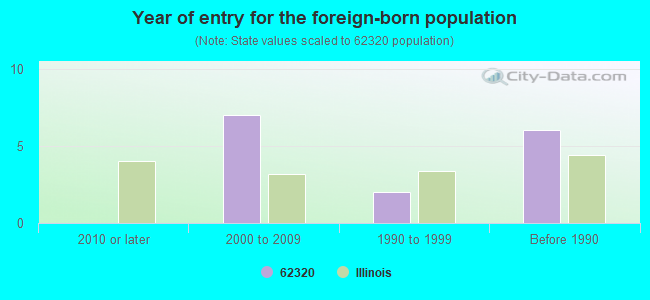
Year of entry for the foreign-born population
02010 or later
72000 to 2009
21990 to 1999
6Before 1990
Facilities with environmental interests located in this zip code:
GUNN CONSTRUCTION CO (211 E WOOD in CAMP POINT, IL)
STATE MASTER (Illinois EPA Project) - HAZARDOUS WASTE PROGRAM (Resource Conservation and Recovery Act (tracking hazardous waste)) Organizations: GUNN JERRY (CONTACT/OWNER)
LEE FERTILIZER INCORPORATED CAMP POINT FACILITY (101 S.E. HAMPSHIRE ST. in CAMP POINT, IL)
AIR MINOR (AIRS/AFS) ENFORCEMENT/COMPLIANCE ACTIVITY (Integrated Compliance Information System) Business SIC classification: FARM SUPPLIES Alternative names: DW LEE
HERREN AUTO BODY (RTE 2 in CAMP POINT, IL)
Conditionally Exempt Small Quantity Generators, less than 100 kg/month of hazardous waste (Resource Conservation and Recovery Act (tracking hazardous waste)) Organizations: HERREN JERRY (CONTACT/OWNER)
MEIER AUTOBODY (206 W STATE ST in CAMP POINT, IL)
Conditionally Exempt Small Quantity Generators, less than 100 kg/month of hazardous waste (Resource Conservation and Recovery Act (tracking hazardous waste)) - notification Organizations: MEIER MARK (CONTACT/OWNER)
LEE FERT INC (PO BOX 347 in CAMP POINT, IL)
COMPLIANCE ACTIVITY (Tracking inspections of insecticide, fungicide, and rodenticide, and toxic substances)
Housing units lacking complete plumbing facilities: 0.8% Housing units lacking complete kitchen facilities: 1.1%
40.9%Electricity
40.1%Utility gas
14.7%Bottled, tank, or LP gas
2.5%No fuel used
1.2%Wood
0.8%Other fuel
Population in 1990: 2,113. Population change in the 1990s: +144 (+6.8%).
Place of birth for U.S.-born residents:
This state: 2,165
Northeast: 22
Midwest: 213
South: 20
West: 74
61% of the 62320 zip code residents lived in the same house 5 years ago. Out of people who lived in different houses, 71% lived in this county. Out of people who lived in different counties, 50% lived in Illinois.
95% of the 62320 zip code residents lived in the same house 1 year ago. Out of people who lived in different houses, 82% moved from this county. Out of people who lived in different houses, 12% moved from different county within same state.
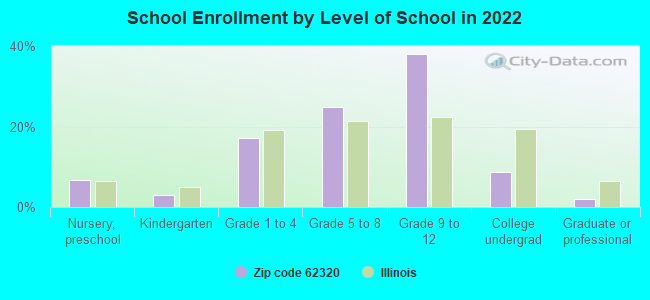
Private vs. public school enrollment:
Students in private schools in grades 1 to 8 (elementary and middle school): 1
Here:
0.4%
Illinois:
13.3%
Students in private schools in grades 9 to 12 (high school):
Here:
0.0%
Illinois:
9.9%
Students in private undergraduate colleges: 19
Here:
32.5%
Illinois:
27.4%
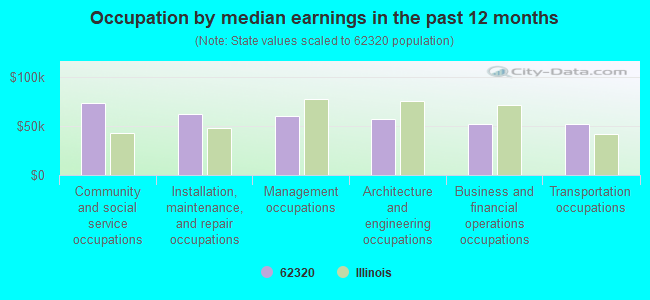
Occupation by median earnings in the past 12 months ($)
73,191Community and social service occupations
62,199Installation, maintenance, and repair occupations
59,946Management occupations
57,570Architecture and engineering occupations
52,178Business and financial operations occupations
51,727Transportation occupations
Top industries in this zip code by the number of employees in 2005:
Health Care and Social Assistance: Nursing Care Facilities (20-49 employees: 2 establishments)
Finance and Insurance: Direct Property and Casualty Insurance Carriers (10-19: 1, 1-4: 1)
Wholesale Trade: Farm and Garden Machinery and Equipment Merchant Wholesalers (5-9: 1, 1-4: 1)
Finance and Insurance: Commercial Banking (5-9: 1)
People in group quarters in 2010:
58 people in nursing facilities/skilled-nursing facilities
People in group quarters in 2000:
77 people in nursing homes
Fatal accident statistics in 2014:
Fatal accident count: 1
Vehicles involved in fatal accidents: 2
Fatal accidents caused by drunken drivers: 0
Fatalities: 1
Persons involved in fatal accidents: 3
Pedestrians involved in fatal accidents: 0
2002 - 2018 National Fire Incident Reporting System (NFIRS) incidents
According to the data from the years 2002 - 2018 the average number of fire incidents per year is 18. The highest number of reported fires - 30 took place in 2008, and the least - 4 in 2004. The data has a declining trend.
When looking into fire subcategories, the most incidents belonged to: Outside Fires (48.2%), and Structure Fires (31.6%).
Fire incident types reported to NFIRS in Zip Code 62320

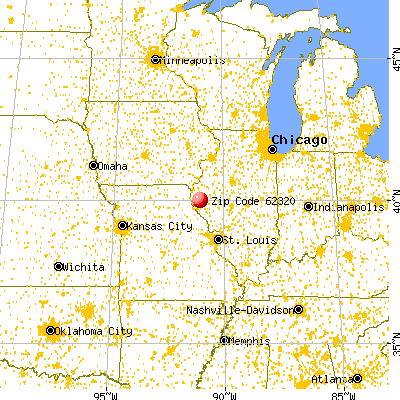


 Nearest zip codes: 62325, 62339, 62359, 62324, 62347, 62338.


 According to the data from the years 2002 - 2018 the average number of fire incidents per year is 18. The highest number of reported fires - 30 took place in 2008, and the least - 4 in 2004. The data has a declining trend.
 When looking into fire subcategories, the most incidents belonged to: Outside Fires (48.2%), and Structure Fires (31.6%).