Estimated zip code population in 2022: 1,090 Zip code population in 2010: 1,198 Zip code population in 2000: 1,143
Houses and condos: 534 Renter-occupied apartments: 82
% of renters here:
17%
State:
33%
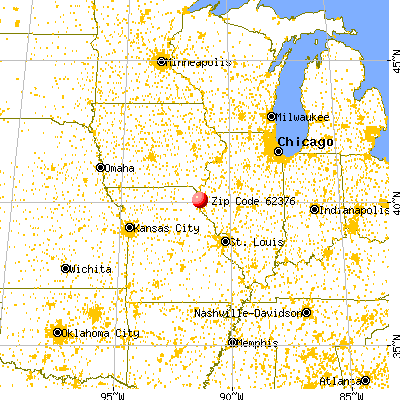
March 2022 cost of living index in zip code 62376: 84.5 (less than average, U.S. average is 100)
Land area: 75.5 sq. mi. Water area: 3.9 sq. mi.
Population density: 14 people per square mile
(very low).
OSM Map
General Map
Google Map
MSN Map
OSM Map
General Map
Google Map
MSN Map
OSM Map
General Map
Google Map
MSN Map
OSM Map
General Map
Google Map
MSN Map
Please wait while loading the map...
Real estate property taxes paid for housing units in 2022:
This zip code:
1.5% ($2,602)
Illinois:
2.0% ($4,912)
Median real estate property taxes paid for housing units with mortgages in 2022: $3,570 (1.9%) Median real estate property taxes paid for housing units with no mortgage in 2022: $2,281 (1.4%)
Business Search- 14 Million verified businesses
Males: 567
(52.0%)
Females: 523
(48.0%)
For population 25 years and over in 62376:
High school or higher: 95.8%
Bachelor's degree or higher: 29.5%
Graduate or professional degree: 1.2%
Unemployed: 3.6%
Mean travel time to work (commute): 22.5 minutes
For population 15 years and over in 62376:
Never married: 19.6%
Now married: 59.5%
Separated: 0.0%
Widowed: 6.5%
Divorced: 14.5%
Zip code 62376 compared to state average:
Black race population percentage significantly below state average.
Hispanic race population percentage significantly below state average.
Foreign-born population percentage significantly below state average.
Renting percentage below state average.
Length of stay since moving in significantly above state average.
Averages for the 2020 tax year for zip code 62376, filed in 2021:
Average Adjusted Gross Income (AGI) in 2020: $66,105 (Individual Income Tax Returns)
Here:
$66,105
State:
$82,626
Salary/wage: $49,308 (reported on 86.2% of returns)
Here:
$49,308
State:
$66,640
(% of AGI for various income ranges: 1490.0% for AGIs below $25k, 3572.3% for AGIs $25k-50k, 6422.9% for AGIs $50k-75k, 10555.0% for AGIs $75k-100k, 15880.0% for AGIs $100k-200k)
Taxable interest for individuals: $1,232 (reported on 37.9% of returns)
This zip code:
$1,232
Illinois:
$2,376
(% of AGI for various income ranges: 34.4% for AGIs below $25k, 23.1% for AGIs $25k-50k, 41.4% for AGIs $50k-75k, 102.5% for AGIs $75k-100k, 280.0% for AGIs $100k-200k)
Ordinary dividends: $4,455 (reported on 19.0% of returns)
Here:
$4,455
State:
$9,061
(% of AGI for various income ranges: 50.0% for AGIs below $25k, 44.6% for AGIs $25k-50k, 47.1% for AGIs $50k-75k, 708.0% for AGIs $100k-200k)
Net capital gain/loss in AGI: +$27,260 (reported on 17.2% of returns)
Here:
+$27,260
State:
+$31,684
(% of AGI for various income ranges: 113.1% for AGIs $25k-50k, 98.6% for AGIs $50k-75k, 5020.0% for AGIs $100k-200k)
Profit/loss from business: +$9,086 (reported on 12.1% of returns)
Here:
+$9,086
State:
+$12,175
(% of AGI for various income ranges: 230.8% for AGIs $25k-50k, 672.0% for AGIs $100k-200k)
Taxable individual retirement arrangement distribution: $9,100 (reported on 10.3% of returns)
62376:
$9,100
Illinois:
$21,613
(% of AGI for various income ranges: 214.6% for AGIs $25k-50k, 667.5% for AGIs $75k-100k)
Earned income credit: $2,214 (reported on 12.1% of returns)
Here:
$2,214
State:
$2,311
(% of AGI for various income ranges: 61.1% for AGIs below $25k, 76.9% for AGIs $25k-50k)
Percentage of individuals using paid preparers for their 2020 taxes: 93.1%
Here:
93%
State:
93%
(% for various income ranges: 87.5% for AGIs below $25k, 93.8% for AGIs $25k-50k, 100.0% for AGIs $50k-75k, 100.0% for AGIs $75k-100k, 88.9% for AGIs $100k-200k, 100.0% for AGIs over 200k)
Averages for the 2012 tax year for zip code 62376, filed in 2013:
Average Adjusted Gross Income (AGI) in 2012: $55,821 (Individual Income Tax Returns)
Here:
$55,821
State:
$68,058
Salary/wage: $42,462 (reported on 85.7% of returns)
Here:
$42,462
State:
$55,396
(% of AGI for various income ranges: 69.9% for AGIs below $25k, 79.2% for AGIs $25k-50k, 77.7% for AGIs $50k-75k, 77.1% for AGIs $75k-100k, 47.4% for AGIs $100k-200k)
Taxable interest for individuals: $1,008 (reported on 42.9% of returns)
This zip code:
$1,008
Illinois:
$1,969
(% of AGI for various income ranges: 1.7% for AGIs below $25k, 0.7% for AGIs $25k-50k, 0.2% for AGIs $50k-75k, 0.3% for AGIs $75k-100k, 1.1% for AGIs $100k-200k)
Ordinary dividends: $3,293 (reported on 25.0% of returns)
Here:
$3,293
State:
$7,786
(% of AGI for various income ranges: 2.5% for AGIs below $25k, 0.4% for AGIs $25k-50k, 0.3% for AGIs $75k-100k, 2.9% for AGIs $100k-200k)
Net capital gain/loss in AGI: +$24,900 (reported on 14.3% of returns)
Here:
+$24,900
State:
+$22,183
(% of AGI for various income ranges: 2.6% for AGIs $50k-75k, 15.0% for AGIs $100k-200k)
Profit/loss from business: +$6,188 (reported on 14.3% of returns)
Here:
+$6,188
State:
+$12,903
Taxable individual retirement arrangement distribution: $10,133 (reported on 10.7% of returns)
62376:
$10,133
Illinois:
$17,929
Total itemized deductions: $15,967 (15% of AGI, reported on 21.4% of returns)
Here:
$15,967
State:
$26,433
Here:
15.1% of AGI
State:
19.2% of AGI
(% of AGI for various income ranges: 6.4% for AGIs $25k-50k, 6.3% for AGIs $50k-75k, 6.9% for AGIs $75k-100k, 6.7% for AGIs $100k-200k)
Charity contributions: $2,486 (reported on 12.5% of returns)
Here:
$2,486
State:
$4,525
Taxes paid: $7,550 (reported on 21.4% of returns)
62376:
$7,550
State:
$11,968
(% of AGI for various income ranges: 2.5% for AGIs $25k-50k, 2.4% for AGIs $50k-75k, 2.4% for AGIs $75k-100k, 4.1% for AGIs $100k-200k)
Earned income credit: $1,938 (reported on 14.3% of returns)
Here:
$1,938
State:
$2,349
(% of AGI for various income ranges: 3.9% for AGIs below $25k, 1.3% for AGIs $25k-50k)
Percentage of individuals using paid preparers for their 2012 taxes: 71.4%
Here:
71%
State:
57%
(% for various income ranges: 68.4% for AGIs below $25k, 64.3% for AGIs $25k-50k, 75.0% for AGIs $50k-75k, 75.0% for AGIs $75k-100k, 85.7% for AGIs $100k-200k)
Averages for the 2004 tax year for zip code 62376, filed in 2005:
Average Adjusted Gross Income (AGI) in 2004: $41,788 (Individual Income Tax Returns)
Here:
$41,788
State:
$54,625
Salary/wage: $33,976 (reported on 84.2% of returns)
Here:
$33,976
State:
$46,811
(% of AGI for various income ranges: 96.8% for AGIs below $10k, 76.1% for AGIs $10k-25k, 79.8% for AGIs $25k-50k, 85.0% for AGIs $50k-75k, 78.8% for AGIs $75k-100k, 32.5% for AGIs over 100k)
Taxable interest for individuals: $1,416 (reported on 55.8% of returns)
This zip code:
$1,416
Illinois:
$2,101
(% of AGI for various income ranges: 12.2% for AGIs below $10k, 3.4% for AGIs $10k-25k, 2.7% for AGIs $25k-50k, 0.7% for AGIs $50k-75k, 1.1% for AGIs $75k-100k, 1.4% for AGIs over 100k)
Taxable dividends: $805 (reported on 28.4% of returns)
Here:
$805
State:
$4,306
(% of AGI for various income ranges: 4.3% for AGIs below $10k, 1.6% for AGIs $10k-25k, 0.7% for AGIs $25k-50k, 0.3% for AGIs $50k-75k, 0.3% for AGIs $75k-100k, 0.1% for AGIs over 100k)
Net capital gain/loss: +$10,130 (reported on 18.4% of returns)
Here:
+$10,130
State:
+$17,321
(% of AGI for various income ranges: 0.7% for AGIs below $10k, 0.0% for AGIs $10k-25k, 1.8% for AGIs $25k-50k, 0.6% for AGIs $50k-75k, 14.8% for AGIs over 100k)
Profit/loss from business: +$3,417 (reported on 13.3% of returns)
Here:
+$3,417
State:
+$11,771
(% of AGI for various income ranges: -1.8% for AGIs below $10k, 1.4% for AGIs $25k-50k, 1.7% for AGIs $50k-75k, 2.5% for AGIs $75k-100k)
Profit/loss from farming: +$1,161 (reported on 10.3% of returns)
Here:
+$1,161
State:
+$2,327
IRA payment deduction: $1,600 (reported on 1.8% of returns)
62376:
$1,600
Illinois:
$3,087
Total itemized deductions: $16,425 (19% of AGI, reported on 14.7% of returns)
Here:
$16,425
State:
$20,239
Here:
19.4% of AGI
State:
19.5% of AGI
Charity contributions deductions: $1,821 (2% of AGI, reported on 10.3% of returns)
Here:
$1,821
State:
$3,719
Here:
2.3% of AGI
State:
3.4% of AGI
Total tax: $4,782 (reported on 75.1% of returns)
62376:
$4,782
State:
$9,882
(% of AGI for various income ranges: 4.3% for AGIs below $10k, 4.1% for AGIs $10k-25k, 5.7% for AGIs $25k-50k, 8.0% for AGIs $50k-75k, 10.9% for AGIs $75k-100k, 12.3% for AGIs over 100k)
Earned income credit: $1,235 (reported on 12.5% of returns)
Here:
$1,235
State:
$1,788
Percentage of individuals using paid preparers for their 2004 taxes: 75.9%
Here:
76%
State:
61%
(% for various income ranges: 65.6% for AGIs below $10k, 69.8% for AGIs $10k-25k, 79.5% for AGIs $25k-50k, 86.2% for AGIs $50k-75k, 76.2% for AGIs $75k-100k, 96.0% for AGIs over 100k)
Household received Food Stamps/SNAP in the past 12 months: 49 Household did not receive Food Stamps/SNAP in the past 12 months: 442
Women who had a birth in the past 12 months: 8 (0 now married, 8 unmarried) Women who did not have a birth in the past 12 months: 223 (104 now married, 118 unmarried)
Housing units in zip code 62376 with a mortgage: 227 (12 second mortgage, 12 both second mortgage and home equity loan) Houses without a mortgage: 22
Median monthly owner costs for units with a mortgage: $1,292 Median monthly owner costs for units without a mortgage: $585
Residents with income below the poverty level in 2022:
This zip code:
8.1%
Whole state:
11.9%
Residents with income below 50% of the poverty level in 2022:
This zip code:
3.3%
Whole state:
5.7%
Median number of rooms in houses and condos:
Here:
6.5
State:
6.4
Median number of rooms in apartments:
Here:
5.2
State:
4.1
Notable locations in this zip code not listed on our city pages
Cemeteries: Keith Cemetery (1), Lima Cemetery (2), New Providence Cemetery (3), Higgins Cemetery (4), Gallimore Cemetery (5), Stone Family Cemetery (6), Denson Cemetery (7). Display/hide their locations on the map
Streams, rivers, and creeks: Bear Creek (A), Ursa Creek (B), Jenkins Creek (C), Buel Branch (D), Whiteoak Creek (E). Display/hide their locations on the map
Size of family households: 196 2-persons, 40 3-persons, 66 4-persons, 20 5-persons, 8 6-persons
Size of nonfamily households: 133 1-person, 29 2-persons
152 married couples with children.
117 single-parent households (23 men, 94 women).
98.1% of residents of 62376 zip code speak English at home.
0.1% of residents speak other Indo-European language at home (100% very well).
0.9% of residents speak other language at home (100% very well).
Foreign born population: 0 (0.0%)
:
0.0%
Whole state:
14.4%
46%German
19%Irish
14%English
13%American
3%Northern European
1%Scottish
1%Italian
Facilities with environmental interests located in this zip code:
ADAMS FS INC (ROUTE 61 in URSA, IL)
STATE MASTER (Illinois EPA Project) - AIR PROGRAM AIR MINOR (AIRS/AFS) (Resource Conservation and Recovery Act (tracking hazardous waste)) Business SIC classification: PETROLEUM BULK STATIONS AND TERMINALS
GREENFIELD ELEMENTARY SCHOOL (2397 HWY 96 N in URSA, IL)
(Geographic Names Information System) (National Center for Education Statistics) - STATE ID-0100100402004 Organizations: COMMUNITY UNIT SCHOOL DIST 4 (SCHOOL DISTRICT)
MARCELLINE FARM SUPPLY (RTE 96 in MARCELLINE, IL)
STATE MASTER (Illinois EPA Project) - SOLID WASTE PROGRAM SUPERFUND (Superfund database)
HOMAN, INC.?TERRY L. (415 MAPLE ST. in URSA, IL)
National Pollutant Discharge Elimination System NON-MAJOR (Tracking pollutant discharge elimination systems) - permit Alternative names: HOMAN, TERRY L. INC.
MARCELLINE FARM SUPPLY (BOX159 in URSA, IL)
COMPLIANCE ACTIVITY (Tracking inspections of insecticide, fungicide, and rodenticide, and toxic substances)
Housing units lacking complete plumbing facilities: 4.7% Housing units lacking complete kitchen facilities: 4.8%
51.4%Utility gas
26.8%Electricity
12.6%Bottled, tank, or LP gas
6.0%Fuel oil, kerosene, etc.
2.7%Wood
0.8%No fuel used
Population in 1990: 1,074. Population change in the 1990s: +69 (+6.4%).
Place of birth for U.S.-born residents:
This state: 950
Northeast: 4
Midwest: 92
South: 17
West: 22
64% of the 62376 zip code residents lived in the same house 5 years ago. Out of people who lived in different houses, 70% lived in this county. Out of people who lived in different counties, 50% lived in Illinois.
96% of the 62376 zip code residents lived in the same house 1 year ago. Out of people who lived in different houses, 54% moved from this county. Out of people who lived in different houses, 36% moved from different county within same state. Out of people who lived in different houses, 7% moved from different state.
Private vs. public school enrollment:
Students in private schools in grades 1 to 8 (elementary and middle school): 16
Here:
12.8%
Illinois:
13.3%
Students in private schools in grades 9 to 12 (high school): 25
Here:
46.0%
Illinois:
9.9%
Students in private undergraduate colleges:
Here:
0.0%
Illinois:
27.4%
Occupation by median earnings in the past 12 months ($)
127,794Transportation occupations
95,245Installation, maintenance, and repair occupations
73,540Construction and extraction occupations
67,151Management occupations
59,704Health diagnosing and treating practitioners and other technical occupations
56,294Business and financial operations occupations
Top industries in this zip code by the number of employees in 2005:
Wholesale Trade: Grain and Field Bean Merchant Wholesalers (20-49 employees: 1 establishment)
Finance and Insurance: Commercial Banking (10-19: 1)
Other Services (except Public Administration): Religious Organizations (5-9: 1, 1-4: 1)
Accommodation and Food Services: Recreational and Vacation Camps (except Campgrounds) (5-9: 1, 1-4: 1)
Construction: All Other Specialty Trade Contractors (1-4: 1)
Fatal accident statistics in 2013:
Fatal accident count: 1
Vehicles involved in fatal accidents: 1
Fatal accidents caused by drunken drivers: 0
Fatalities: 1
Persons involved in fatal accidents: 1
Pedestrians involved in fatal accidents: 1
2003 - 2018 National Fire Incident Reporting System (NFIRS) incidents
According to the data from the years 2003 - 2018 the average number of fire incidents per year is 7. The highest number of reported fires - 21 took place in 2011, and the least - 0 in 2004. The data has a declining trend.
When looking into fire subcategories, the most incidents belonged to: Outside Fires (49.5%), and Structure Fires (30.3%).
Fire incident types reported to NFIRS in Zip Code 62376


 Nearest zip codes: 62348, 62373, 63448, 62379, 62351, 63435.


 According to the data from the years 2003 - 2018 the average number of fire incidents per year is 7. The highest number of reported fires - 21 took place in 2011, and the least - 0 in 2004. The data has a declining trend.
 When looking into fire subcategories, the most incidents belonged to: Outside Fires (49.5%), and Structure Fires (30.3%).