Estimated zip code population in 2022: 2,440 Zip code population in 2010: 2,092 Zip code population in 2000: 2,069
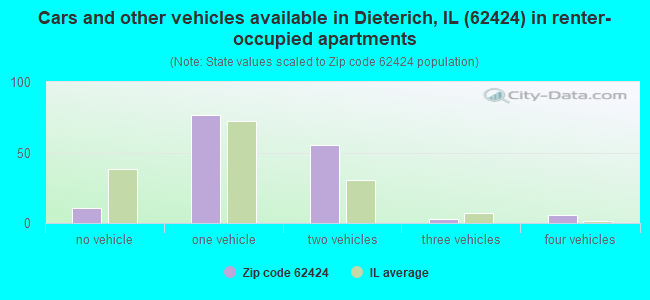
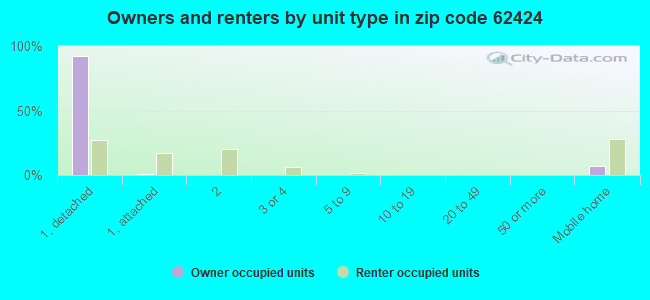
Houses and condos: 922 Renter-occupied apartments: 153
% of renters here:
17%
State:
33%
March 2022 cost of living index in zip code 62424: 84.7 (less than average, U.S. average is 100)
Land area: 86.3 sq. mi. Water area: 0.0 sq. mi.
Population density: 28 people per square mile
(very low).
OSM Map
General Map
Google Map
MSN Map
OSM Map
General Map
Google Map
MSN Map
OSM Map
General Map
Google Map
MSN Map
OSM Map
General Map
Google Map
MSN Map
Please wait while loading the map...
Real estate property taxes paid for housing units in 2022:
This zip code:
1.3% ($2,856)
Illinois:
2.0% ($4,912)
Median real estate property taxes paid for housing units with mortgages in 2022: $3,013 (1.3%) Median real estate property taxes paid for housing units with no mortgage in 2022: $2,679 (1.4%)
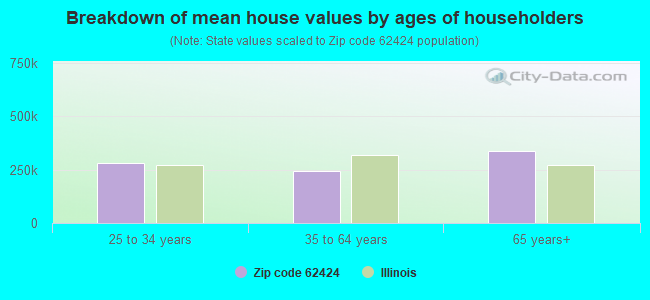
Estimated median house/condo value in 2022: $218,243
62424:
$218,243
Illinois:
$251,600
According to our research of Illinois and other state lists, there was 1 registered sex offender living in 62424 zip code as of May 28, 2024. The ratio of all residents to sex offenders in zip code 62424 is 2,517 to 1. The ratio of registered sex offenders to all residents in this zip code is much lower than the state average.
Median resident age:
This zip code:
32.1 years
Illinois median age:
39.1 years
Average household size:
This zip code:
2.7 people
Illinois:
2.4 people
Averages for the 2020 tax year for zip code 62424, filed in 2021:
Average Adjusted Gross Income (AGI) in 2020: $70,577 (Individual Income Tax Returns)
Here:
$70,577
State:
$82,626
Salary/wage: $57,610 (reported on 85.3% of returns)
Here:
$57,610
State:
$66,640
(% of AGI for various income ranges: 1343.7% for AGIs below $25k, 3644.1% for AGIs $25k-50k, 7091.7% for AGIs $50k-75k, 9708.2% for AGIs $75k-100k, 15171.5% for AGIs $100k-200k)
Taxable interest for individuals: $957 (reported on 61.5% of returns)
This zip code:
$957
Illinois:
$2,376
(% of AGI for various income ranges: 43.2% for AGIs below $25k, 39.4% for AGIs $25k-50k, 80.0% for AGIs $50k-75k, 86.4% for AGIs $75k-100k, 110.8% for AGIs $100k-200k)
Ordinary dividends: $2,393 (reported on 26.6% of returns)
Here:
$2,393
State:
$9,061
(% of AGI for various income ranges: 21.1% for AGIs below $25k, 11.8% for AGIs $25k-50k, 60.0% for AGIs $50k-75k, 70.9% for AGIs $75k-100k, 257.7% for AGIs $100k-200k)
Net capital gain/loss in AGI: +$4,012 (reported on 23.9% of returns)
Here:
+$4,012
State:
+$31,684
(% of AGI for various income ranges: 31.1% for AGIs below $25k, 32.4% for AGIs $25k-50k, 80.8% for AGIs $50k-75k, 115.5% for AGIs $75k-100k, 374.6% for AGIs $100k-200k)
Profit/loss from business: +$7,418 (reported on 15.6% of returns)
Here:
+$7,418
State:
+$12,175
(% of AGI for various income ranges: 81.6% for AGIs below $25k, 105.9% for AGIs $25k-50k, 76.7% for AGIs $50k-75k, 273.6% for AGIs $75k-100k, 410.0% for AGIs $100k-200k)
Taxable individual retirement arrangement distribution: $8,022 (reported on 8.3% of returns)
62424:
$8,022
Illinois:
$21,613
(% of AGI for various income ranges: 122.1% for AGIs below $25k, 260.0% for AGIs $50k-75k, 136.9% for AGIs $100k-200k)
Total itemized deductions: $23,400 (reported on 1.8% of returns)
Here:
$23,400
State:
$34,948
(% of AGI for various income ranges: 275.3% for AGIs $25k-50k)
Taxes paid: $7,550 (reported on 1.8% of returns)
62424:
$7,550
State:
$8,563
(% of AGI for various income ranges: 88.8% for AGIs $25k-50k)
Earned income credit: $2,280 (reported on 9.2% of returns)
Here:
$2,280
State:
$2,311
(% of AGI for various income ranges: 62.1% for AGIs below $25k, 64.7% for AGIs $25k-50k)
Percentage of individuals using paid preparers for their 2020 taxes: 97.2%
Here:
97%
State:
93%
(% for various income ranges: 93.3% for AGIs below $25k, 100.0% for AGIs $25k-50k, 94.4% for AGIs $50k-75k, 100.0% for AGIs $75k-100k, 100.0% for AGIs $100k-200k, 100.0% for AGIs over 200k)
Averages for the 2012 tax year for zip code 62424, filed in 2013:
Average Adjusted Gross Income (AGI) in 2012: $49,145 (Individual Income Tax Returns)
Here:
$49,145
State:
$68,058
Salary/wage: $38,843 (reported on 86.7% of returns)
Here:
$38,843
State:
$55,396
(% of AGI for various income ranges: 78.5% for AGIs below $25k, 76.7% for AGIs $25k-50k, 73.8% for AGIs $50k-75k, 73.5% for AGIs $75k-100k, 55.7% for AGIs $100k-200k)
Taxable interest for individuals: $1,277 (reported on 62.9% of returns)
This zip code:
$1,277
Illinois:
$1,969
(% of AGI for various income ranges: 2.8% for AGIs below $25k, 1.7% for AGIs $25k-50k, 1.7% for AGIs $50k-75k, 1.5% for AGIs $75k-100k, 1.3% for AGIs $100k-200k)
Ordinary dividends: $2,144 (reported on 25.7% of returns)
Here:
$2,144
State:
$7,786
(% of AGI for various income ranges: 0.6% for AGIs below $25k, 0.9% for AGIs $25k-50k, 0.8% for AGIs $50k-75k, 0.9% for AGIs $75k-100k, 1.7% for AGIs $100k-200k)
Net capital gain/loss in AGI: +$1,455 (reported on 19.0% of returns)
Here:
+$1,455
State:
+$22,183
(% of AGI for various income ranges: 0.6% for AGIs $25k-50k, 0.4% for AGIs $50k-75k, 0.8% for AGIs $75k-100k, 0.6% for AGIs $100k-200k)
Profit/loss from business: +$5,900 (reported on 13.3% of returns)
Here:
+$5,900
State:
+$12,903
(% of AGI for various income ranges: 5.2% for AGIs below $25k, 2.1% for AGIs $25k-50k, 0.6% for AGIs $50k-75k, 1.9% for AGIs $75k-100k, 0.9% for AGIs $100k-200k)
Taxable individual retirement arrangement distribution: $6,978 (reported on 8.6% of returns)
62424:
$6,978
Illinois:
$17,929
(% of AGI for various income ranges: 1.8% for AGIs below $25k, 2.3% for AGIs $25k-50k, 3.4% for AGIs $75k-100k)
Total itemized deductions: $17,336 (19% of AGI, reported on 21.0% of returns)
Here:
$17,336
State:
$26,433
Here:
18.6% of AGI
State:
19.2% of AGI
(% of AGI for various income ranges: 6.0% for AGIs below $25k, 9.0% for AGIs $25k-50k, 4.7% for AGIs $50k-75k, 8.1% for AGIs $75k-100k, 8.3% for AGIs $100k-200k)
Charity contributions: $3,257 (reported on 13.3% of returns)
Here:
$3,257
State:
$4,525
(% of AGI for various income ranges: 1.0% for AGIs $25k-50k, 0.4% for AGIs $50k-75k, 0.8% for AGIs $75k-100k, 1.4% for AGIs $100k-200k)
Taxes paid: $6,582 (reported on 21.0% of returns)
62424:
$6,582
State:
$11,968
(% of AGI for various income ranges: 0.9% for AGIs below $25k, 1.7% for AGIs $25k-50k, 1.5% for AGIs $50k-75k, 3.1% for AGIs $75k-100k, 4.5% for AGIs $100k-200k)
Earned income credit: $2,075 (reported on 11.4% of returns)
Here:
$2,075
State:
$2,349
(% of AGI for various income ranges: 3.6% for AGIs below $25k, 1.0% for AGIs $25k-50k)
Percentage of individuals using paid preparers for their 2012 taxes: 79.0%
Here:
79%
State:
57%
(% for various income ranges: 70.7% for AGIs below $25k, 78.3% for AGIs $25k-50k, 88.9% for AGIs $50k-75k, 83.3% for AGIs $75k-100k, 90.9% for AGIs $100k-200k)
Averages for the 2004 tax year for zip code 62424, filed in 2005:
Average Adjusted Gross Income (AGI) in 2004: $35,886 (Individual Income Tax Returns)
Here:
$35,886
State:
$54,625
Salary/wage: $29,093 (reported on 88.9% of returns)
Here:
$29,093
State:
$46,811
(% of AGI for various income ranges: 95.7% for AGIs below $10k, 75.6% for AGIs $10k-25k, 79.1% for AGIs $25k-50k, 75.6% for AGIs $50k-75k, 74.3% for AGIs $75k-100k, 47.9% for AGIs over 100k)
Taxable interest for individuals: $1,448 (reported on 59.4% of returns)
This zip code:
$1,448
Illinois:
$2,101
(% of AGI for various income ranges: 9.4% for AGIs below $10k, 4.6% for AGIs $10k-25k, 2.3% for AGIs $25k-50k, 1.6% for AGIs $50k-75k, 1.0% for AGIs $75k-100k, 2.2% for AGIs over 100k)
Taxable dividends: $2,485 (reported on 26.5% of returns)
Here:
$2,485
State:
$4,306
(% of AGI for various income ranges: 1.0% for AGIs below $10k, 1.8% for AGIs $10k-25k, 0.9% for AGIs $25k-50k, 1.1% for AGIs $50k-75k, 2.4% for AGIs $75k-100k, 4.2% for AGIs over 100k)
Net capital gain/loss: +$2,531 (reported on 19.8% of returns)
Here:
+$2,531
State:
+$17,321
(% of AGI for various income ranges: -1.4% for AGIs below $10k, 0.4% for AGIs $10k-25k, 1.2% for AGIs $25k-50k, 1.7% for AGIs $50k-75k, 2.0% for AGIs $75k-100k, 1.9% for AGIs over 100k)
Profit/loss from business: +$6,007 (reported on 15.6% of returns)
Here:
+$6,007
State:
+$11,771
(% of AGI for various income ranges: 5.6% for AGIs below $10k, 2.4% for AGIs $10k-25k, 1.7% for AGIs $25k-50k, 1.3% for AGIs $50k-75k, 0.1% for AGIs $75k-100k, 7.7% for AGIs over 100k)
IRA payment deduction: $2,750 (reported on 3.3% of returns)
62424:
$2,750
Illinois:
$3,087
Total itemized deductions: $14,093 (21% of AGI, reported on 16.5% of returns)
Here:
$14,093
State:
$20,239
Here:
21.0% of AGI
State:
19.5% of AGI
(% of AGI for various income ranges: 7.9% for AGIs $10k-25k, 4.8% for AGIs $25k-50k, 7.2% for AGIs $50k-75k, 7.4% for AGIs $75k-100k, 7.1% for AGIs over 100k)
Charity contributions deductions: $2,431 (3% of AGI, reported on 12.6% of returns)
Here:
$2,431
State:
$3,719
Here:
3.4% of AGI
State:
3.4% of AGI
(% of AGI for various income ranges: 0.6% for AGIs $10k-25k, 0.7% for AGIs $25k-50k, 0.7% for AGIs $50k-75k, 0.9% for AGIs $75k-100k, 1.7% for AGIs over 100k)
Total tax: $4,065 (reported on 77.0% of returns)
62424:
$4,065
State:
$9,882
(% of AGI for various income ranges: 2.8% for AGIs below $10k, 4.3% for AGIs $10k-25k, 5.9% for AGIs $25k-50k, 7.5% for AGIs $50k-75k, 9.5% for AGIs $75k-100k, 18.4% for AGIs over 100k)
Earned income credit: $1,500 (reported on 11.8% of returns)
Here:
$1,500
State:
$1,788
Percentage of individuals using paid preparers for their 2004 taxes: 78.0%
Here:
78%
State:
61%
(% for various income ranges: 67.9% for AGIs below $10k, 75.7% for AGIs $10k-25k, 81.5% for AGIs $25k-50k, 87.8% for AGIs $50k-75k, 71.9% for AGIs $75k-100k, 95.1% for AGIs over 100k)
Household received Food Stamps/SNAP in the past 12 months: 107 Household did not receive Food Stamps/SNAP in the past 12 months: 793
Women who had a birth in the past 12 months: 70 (46 now married, 24 unmarried) Women who did not have a birth in the past 12 months: 430 (268 now married, 158 unmarried)
Housing units in zip code 62424 with a mortgage: 462 (16 second mortgage, 1 home equity loan, 13 both second mortgage and home equity loan) Houses without a mortgage: 21
Median monthly owner costs for units with a mortgage: $1,505 Median monthly owner costs for units without a mortgage: $684
Residents with income below the poverty level in 2022:
This zip code:
9.9%
Whole state:
11.9%
Residents with income below 50% of the poverty level in 2022:
This zip code:
5.9%
Whole state:
5.7%
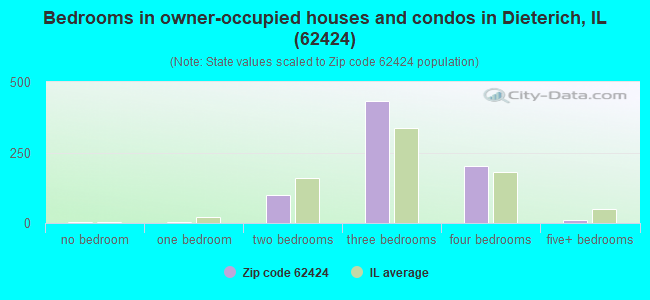
Median number of rooms in houses and condos:
Here:
6.6
State:
6.4
Median number of rooms in apartments:
Here:
4.8
State:
4.1
Notable locations in this zip code not listed on our city pages
Notable locations in zip code 62424: Probst Family Farms (A), Goeckner Farms (B), Bannick Farm (C), Beckman Farms (D), Behrns Farms (E), Holste Brothers Farm (F), Joergens Farm (G), Hamland Acres (H), Niemerg Dairy Farm (I), Zimdars Farm (J), Union Town Hall (K), Dieterich Fire Protection District (L). Display/hide their locations on the map
Cemeteries: Bethsaida Cemetery (1), Saint Matthew Lutheran Cemetery (2), Saint John Lutheran Cemetery (3), Saint Aloysius Cemetery (4), Mount Zion Cemetery (5), Immaculate Conception Cemetery (6), Merry Cemetery (7). Display/hide their locations on the map
Size of family households: 234 2-persons, 144 3-persons, 108 4-persons, 94 5-persons, 45 6-persons, 25 7-or-more-persons
Size of nonfamily households: 227 1-person, 10 2-persons, 2 4-persons
575 married couples with children.
183 single-parent households (112 men, 71 women).
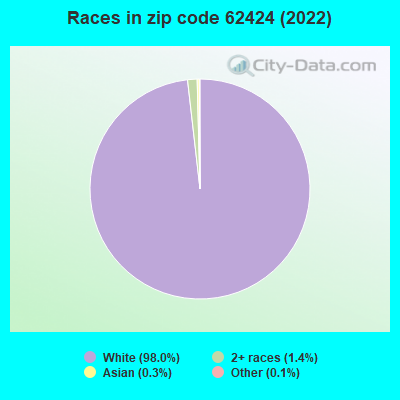
97.6% of residents of 62424 zip code speak English at home.
0.7% of residents speak Spanish at home (94% very well, 6% well).
0.4% of residents speak Asian or Pacific Island language at home (100% not well).
Foreign born population: 0 (0.0%)
:
0.0%
Whole state:
14.4%
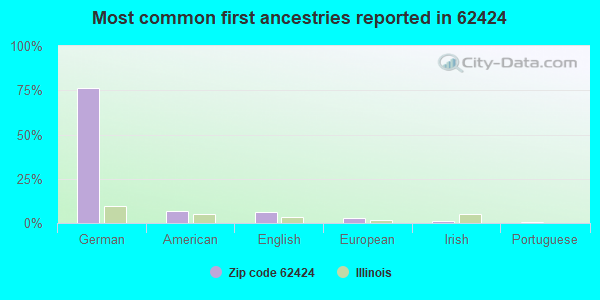
76%German
7%American
6%English
3%European
1%Irish
1%Portuguese
1%Croatian
Facilities with environmental interests located in this zip code:
MEYER OIL CO (RTE 33 in DIETERICH, IL)
STATE MASTER (Illinois EPA Project) - AIR PROGRAM AIR MINOR (AIRS/AFS) Business SIC classification: PETROLEUM BULK STATIONS AND TERMINALS
HIGGS WELDING (101 ZUMBAHLEN AVE in DIETERICH, IL)
Conditionally Exempt Small Quantity Generators, less than 100 kg/month of hazardous waste (Resource Conservation and Recovery Act (tracking hazardous waste)) Business NAICS classification: WELDING AND SOLDERING EQUIPMENT MANUFACTURING. Organizations: TROY & BRETT HIGGS (CONTACT/OWNER)
PROFIGOLD INC (105 PINE ST in DIETERICH, IL)
Small Quantity Generators, between 100 kg and 1000 kg of hazardous waste/month (Resource Conservation and Recovery Act (tracking hazardous waste)) - notification
Housing units lacking complete plumbing facilities: 0.9%
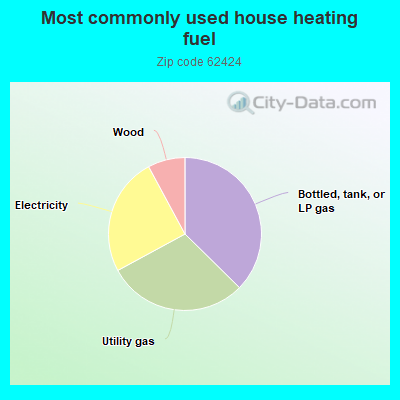
37.5%Bottled, tank, or LP gas
29.8%Utility gas
25.1%Electricity
7.9%Wood
Population in 1990: 1,639. Population change in the 1990s: +430 (+26.2%).
Place of birth for U.S.-born residents:
This state: 2,219
Northeast: 2
Midwest: 62
South: 115
West: 25
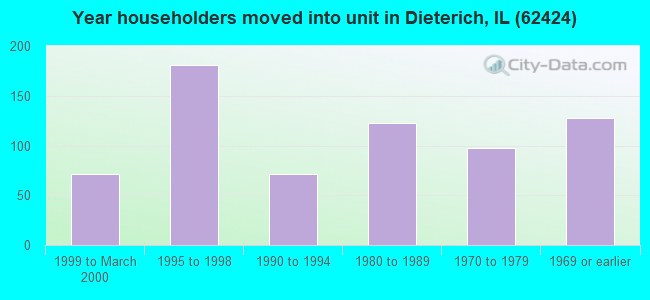
68% of the 62424 zip code residents lived in the same house 5 years ago. Out of people who lived in different houses, 67% lived in this county. Out of people who lived in different counties, 50% lived in Illinois.
95% of the 62424 zip code residents lived in the same house 1 year ago. Out of people who lived in different houses, 68% moved from this county. Out of people who lived in different houses, 28% moved from different county within same state. Out of people who lived in different houses, 2% moved from abroad.
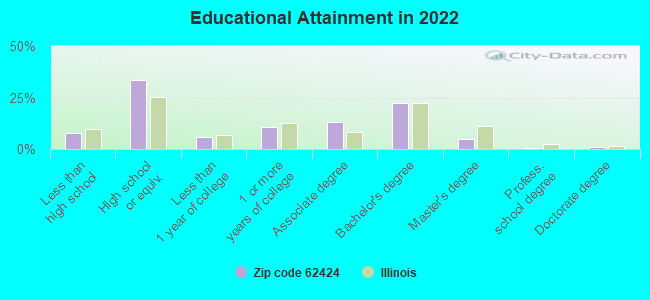
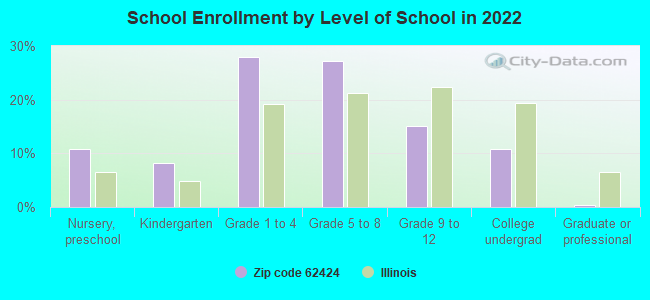
Private vs. public school enrollment:
Students in private schools in grades 1 to 8 (elementary and middle school): 26
Here:
7.0%
Illinois:
13.3%
Students in private schools in grades 9 to 12 (high school): 8
Here:
8.3%
Illinois:
9.9%
Students in private undergraduate colleges: 11
Here:
15.0%
Illinois:
27.4%
Occupation by median earnings in the past 12 months ($)
88,206Business and financial operations occupations
76,630Architecture and engineering occupations
68,365Law enforcement workers including supervisors
60,914Health diagnosing and treating practitioners and other technical occupations
60,866Construction and extraction occupations
56,834Computer and mathematical occupations
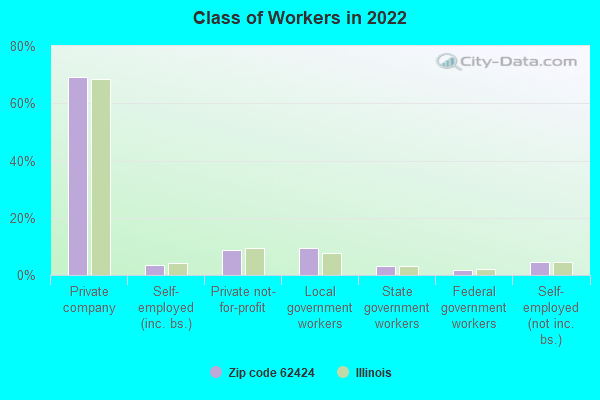
Top industries in this zip code by the number of employees in 2005:
Finance and Insurance: Commercial Banking (20-49: 1)
Construction: Plumbing, Heating, and Air-Conditioning Contractors (10-19: 1, 1-4: 1)
Utilities: Water Supply and Irrigation Systems (10-19: 1)
Construction: New Single-Family Housing Construction (except Operative Builders) (5-9: 1, 1-4: 1)
Other Services (except Public Administration): Religious Organizations (5-9: 1, 1-4: 1)
Professional, Scientific, and Technical Services: All Other Professional, Scientific, and Technical Services (5-9: 1, 1-4: 1)
Accommodation and Food Services: Full-Service Restaurants (5-9: 1)
Fatal accident statistics in 2014:
Fatal accident count: 1
Vehicles involved in fatal accidents: 2
Fatal accidents caused by drunken drivers: 0
Fatalities: 1
Persons involved in fatal accidents: 2
Pedestrians involved in fatal accidents: 0
Fatal accident statistics in 2012:
Fatal accident count: 1
Vehicles involved in fatal accidents: 1
Fatal accidents caused by drunken drivers: 0
Fatalities: 2
Persons involved in fatal accidents: 2
Pedestrians involved in fatal accidents: 0
2002 - 2018 National Fire Incident Reporting System (NFIRS) incidents
According to the data from the years 2002 - 2018 the average number of fires per year is 11. The highest number of reported fire incidents - 29 took place in 2008, and the least - 2 in 2013. The data has a growing trend.
When looking into fire subcategories, the most incidents belonged to: Structure Fires (39.1%), and Outside Fires (31.0%).
Fire incident types reported to NFIRS in Zip Code 62424


 Nearest zip codes: 62479, 62467, 62473, 62434, 62401, 62858.


 According to the data from the years 2002 - 2018 the average number of fires per year is 11. The highest number of reported fire incidents - 29 took place in 2008, and the least - 2 in 2013. The data has a growing trend.
 When looking into fire subcategories, the most incidents belonged to: Structure Fires (39.1%), and Outside Fires (31.0%).