Estimated zip code population in 2022: 1,134 Zip code population in 2010: 998 Zip code population in 2000: 1,057
Houses and condos: 529 Renter-occupied apartments: 118
% of renters here:
25%
State:
33%
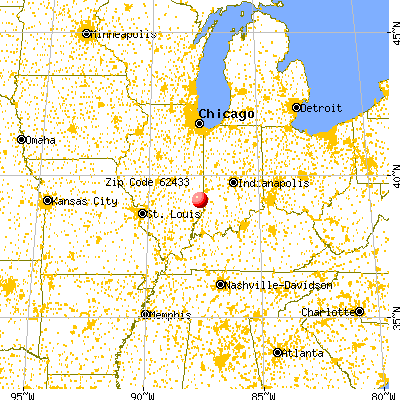
March 2022 cost of living index in zip code 62433: 83.6 (less than average, U.S. average is 100)
Land area: 32.2 sq. mi. Water area: 0.4 sq. mi.
Population density: 35 people per square mile
(very low).
OSM Map
General Map
Google Map
MSN Map
OSM Map
General Map
Google Map
MSN Map
OSM Map
General Map
Google Map
MSN Map
OSM Map
General Map
Google Map
MSN Map
Please wait while loading the map...
Real estate property taxes paid for housing units in 2022:
This zip code:
1.5% ($1,404)
Illinois:
2.0% ($4,912)
Median real estate property taxes paid for housing units with mortgages in 2022: $1,659 (1.6%) Median real estate property taxes paid for housing units with no mortgage in 2022: $862 (1.2%)
Business Search- 14 Million verified businesses
Males: 566
(49.9%)
Females: 567
(50.1%)
For population 25 years and over in 62433:
High school or higher: 96.7%
Bachelor's degree or higher: 27.8%
Graduate or professional degree: 7.7%
Unemployed: 1.9%
Mean travel time to work (commute): 25.2 minutes
For population 15 years and over in 62433:
Never married: 24.2%
Now married: 59.5%
Separated: 0.5%
Widowed: 3.8%
Divorced: 11.9%
Zip code 62433 compared to state average:
Median house value significantly below state average.
Unemployed percentage below state average.
Black race population percentage significantly below state average.
Hispanic race population percentage significantly below state average.
Foreign-born population percentage significantly below state average.
Length of stay since moving in significantly above state average.
Averages for the 2020 tax year for zip code 62433, filed in 2021:
Average Adjusted Gross Income (AGI) in 2020: $67,042 (Individual Income Tax Returns)
Here:
$67,042
State:
$82,626
Salary/wage: $54,160 (reported on 75.0% of returns)
Here:
$54,160
State:
$66,640
(% of AGI for various income ranges: 970.0% for AGIs below $25k, 3652.9% for AGIs $25k-50k, 6740.0% for AGIs $50k-75k, 6540.0% for AGIs $75k-100k, 19250.0% for AGIs $100k-200k)
Taxable interest for individuals: $867 (reported on 45.0% of returns)
This zip code:
$867
Illinois:
$2,376
(% of AGI for various income ranges: 32.9% for AGIs below $25k, 17.1% for AGIs $25k-50k, 30.0% for AGIs $50k-75k, 60.0% for AGIs $75k-100k, 212.5% for AGIs $100k-200k)
Ordinary dividends: $2,670 (reported on 25.0% of returns)
Here:
$2,670
State:
$9,061
(% of AGI for various income ranges: 90.0% for AGIs below $25k, 95.0% for AGIs $50k-75k, 415.0% for AGIs $100k-200k)
Net capital gain/loss in AGI: +$5,986 (reported on 17.5% of returns)
Here:
+$5,986
State:
+$31,684
(% of AGI for various income ranges: 45.0% for AGIs $50k-75k, 1002.5% for AGIs $100k-200k)
Profit/loss from business: +$2,660 (reported on 12.5% of returns)
Here:
+$2,660
State:
+$12,175
(% of AGI for various income ranges: 174.3% for AGIs $25k-50k, 27.5% for AGIs $75k-100k)
Taxable individual retirement arrangement distribution: $25,260 (reported on 12.5% of returns)
62433:
$25,260
Illinois:
$21,613
(% of AGI for various income ranges: 298.6% for AGIs below $25k, 2635.0% for AGIs $75k-100k)
Earned income credit: $2,120 (reported on 12.5% of returns)
Here:
$2,120
State:
$2,311
(% of AGI for various income ranges: 151.4% for AGIs below $25k)
Percentage of individuals using paid preparers for their 2020 taxes: 95.0%
Here:
95%
State:
93%
(% for various income ranges: 90.9% for AGIs below $25k, 100.0% for AGIs $25k-50k, 100.0% for AGIs $50k-75k, 80.0% for AGIs $75k-100k, 100.0% for AGIs $100k-200k)
Averages for the 2012 tax year for zip code 62433, filed in 2013:
Average Adjusted Gross Income (AGI) in 2012: $53,933 (Individual Income Tax Returns)
Here:
$53,933
State:
$68,058
Salary/wage: $42,081 (reported on 78.3% of returns)
Here:
$42,081
State:
$55,396
(% of AGI for various income ranges: 69.4% for AGIs below $25k, 72.7% for AGIs $25k-50k, 80.3% for AGIs $50k-75k, 61.8% for AGIs $75k-100k, 46.8% for AGIs $100k-200k)
Taxable interest for individuals: $1,290 (reported on 43.5% of returns)
This zip code:
$1,290
Illinois:
$1,969
(% of AGI for various income ranges: 2.5% for AGIs below $25k, 1.0% for AGIs $25k-50k, 0.4% for AGIs $50k-75k, 0.9% for AGIs $75k-100k, 1.0% for AGIs $100k-200k)
Ordinary dividends: $2,031 (reported on 28.3% of returns)
Here:
$2,031
State:
$7,786
(% of AGI for various income ranges: 1.5% for AGIs below $25k, 1.8% for AGIs $25k-50k, 1.1% for AGIs $50k-75k, 1.0% for AGIs $100k-200k)
Net capital gain/loss in AGI: +$700 (reported on 15.2% of returns)
Here:
+$700
State:
+$22,183
(% of AGI for various income ranges: 0.9% for AGIs $100k-200k)
Profit/loss from business: +$3,400 (reported on 13.0% of returns)
Here:
+$3,400
State:
+$12,903
Taxable individual retirement arrangement distribution: $13,620 (reported on 10.9% of returns)
62433:
$13,620
Illinois:
$17,929
Total itemized deductions: $20,733 (19% of AGI, reported on 19.6% of returns)
Here:
$20,733
State:
$26,433
Here:
18.8% of AGI
State:
19.2% of AGI
(% of AGI for various income ranges: 17.6% for AGIs below $25k, 13.2% for AGIs $50k-75k, 7.7% for AGIs $100k-200k)
Charity contributions: $4,160 (reported on 10.9% of returns)
Here:
$4,160
State:
$4,525
Taxes paid: $7,100 (reported on 19.6% of returns)
62433:
$7,100
State:
$11,968
(% of AGI for various income ranges: 2.2% for AGIs below $25k, 3.3% for AGIs $50k-75k, 4.0% for AGIs $100k-200k)
Earned income credit: $2,414 (reported on 15.2% of returns)
Here:
$2,414
State:
$2,349
(% of AGI for various income ranges: 7.3% for AGIs below $25k)
Percentage of individuals using paid preparers for their 2012 taxes: 71.7%
Here:
72%
State:
57%
(% for various income ranges: 66.7% for AGIs below $25k, 70.0% for AGIs $25k-50k, 75.0% for AGIs $50k-75k, 75.0% for AGIs $75k-100k, 83.3% for AGIs $100k-200k)
Averages for the 2004 tax year for zip code 62433, filed in 2005:
Average Adjusted Gross Income (AGI) in 2004: $37,279 (Individual Income Tax Returns)
Here:
$37,279
State:
$54,625
Salary/wage: $33,393 (reported on 79.9% of returns)
Here:
$33,393
State:
$46,811
(% of AGI for various income ranges: 77.8% for AGIs below $10k, 64.5% for AGIs $10k-25k, 79.5% for AGIs $25k-50k, 71.9% for AGIs $50k-75k, 74.1% for AGIs $75k-100k, 61.4% for AGIs over 100k)
Taxable interest for individuals: $1,815 (reported on 50.4% of returns)
This zip code:
$1,815
Illinois:
$2,101
(% of AGI for various income ranges: 11.0% for AGIs below $10k, 4.7% for AGIs $10k-25k, 0.7% for AGIs $25k-50k, 2.8% for AGIs $50k-75k, 1.7% for AGIs $75k-100k, 2.3% for AGIs over 100k)
Taxable dividends: $1,898 (reported on 27.5% of returns)
Here:
$1,898
State:
$4,306
(% of AGI for various income ranges: 1.5% for AGIs below $10k, 1.7% for AGIs $10k-25k, 0.8% for AGIs $25k-50k, 1.1% for AGIs $50k-75k, 0.4% for AGIs $75k-100k, 3.1% for AGIs over 100k)
Net capital gain/loss: +$690 (reported on 15.4% of returns)
Here:
+$690
State:
+$17,321
(% of AGI for various income ranges: -1.2% for AGIs below $10k, 0.2% for AGIs $10k-25k, -0.3% for AGIs $25k-50k, 0.9% for AGIs $50k-75k, 0.7% for AGIs $75k-100k)
Profit/loss from business: +$3,071 (reported on 12.1% of returns)
Here:
+$3,071
State:
+$11,771
Profit/loss from farming: +$6,929 (reported on 6.1% of returns)
Here:
+$6,929
State:
+$2,327
IRA payment deduction: $2,500 (reported on 2.2% of returns)
62433:
$2,500
Illinois:
$3,087
Total itemized deductions: $13,537 (19% of AGI, reported on 11.7% of returns)
Here:
$13,537
State:
$20,239
Here:
18.8% of AGI
State:
19.5% of AGI
Charity contributions deductions: $3,324 (5% of AGI, reported on 7.4% of returns)
Here:
$3,324
State:
$3,719
Here:
4.5% of AGI
State:
3.4% of AGI
Total tax: $4,858 (reported on 74.7% of returns)
62433:
$4,858
State:
$9,882
(% of AGI for various income ranges: 2.3% for AGIs below $10k, 3.3% for AGIs $10k-25k, 7.0% for AGIs $25k-50k, 9.7% for AGIs $50k-75k, 11.0% for AGIs $75k-100k, 17.0% for AGIs over 100k)
Earned income credit: $1,701 (reported on 14.5% of returns)
Here:
$1,701
State:
$1,788
Percentage of individuals using paid preparers for their 2004 taxes: 70.6%
Here:
71%
State:
61%
(% for various income ranges: 64.5% for AGIs below $10k, 71.6% for AGIs $10k-25k, 74.4% for AGIs $25k-50k, 70.2% for AGIs $50k-75k, 70.8% for AGIs $75k-100k, 76.2% for AGIs over 100k)
Household received Food Stamps/SNAP in the past 12 months: 86 Household did not receive Food Stamps/SNAP in the past 12 months: 395
Women who had a birth in the past 12 months: 14 (14 now married, 0 unmarried) Women who did not have a birth in the past 12 months: 243 (148 now married, 92 unmarried)
Housing units in zip code 62433 with a mortgage: 234 (20 second mortgage, 16 both second mortgage and home equity loan) Median monthly owner costs for units with a mortgage: $1,197 Median monthly owner costs for units without a mortgage: $422
Residents with income below the poverty level in 2022:
This zip code:
17.5%
Whole state:
11.9%
Residents with income below 50% of the poverty level in 2022:
This zip code:
7.2%
Whole state:
5.7%
Median number of rooms in houses and condos:
Here:
6.3
State:
6.4
Median number of rooms in apartments:
Here:
5.0
State:
4.1
Notable locations in this zip code not listed on our city pages
Notable locations in zip code 62433: Hutsonville Township Fire Protection District (A), Hutsonville Power Station (B). Display/hide their locations on the map
Cemeteries: Ball Cemetery (1), Musgrave Cemetery (2), Hutson Old Cemetery (3), Hutsonville New Cemetery (4), Draper Cemetery (5). Display/hide their locations on the map
In group quarters: 35 (-1 institutionalized population)
Size of family households: 153 2-persons, 74 3-persons, 53 4-persons, 18 5-persons, 9 6-persons
Size of nonfamily households: 153 1-person, 4 2-persons, 12 3-persons
138 married couples with children.
44 single-parent households (13 men, 31 women).
98.5% of residents of 62433 zip code speak English at home.
0.8% of residents speak Spanish at home (100% very well).
Foreign born population: 2 (0.2%) (100.0% of them are naturalized citizens)
This zip code:
0.2%
Whole state:
14.4%
100%France
30%English
22%American
9%German
7%Irish
7%European
6%Scottish
2%French
Year of entry for the foreign-born population
02010 or later
02000 to 2009
01990 to 1999
4Before 1990
Facilities with environmental interests located in this zip code:
HUTSONVILLE ELEM AND JR HIGH SCH (PO BOX 218 in HUTSONVILLE, IL)
(Geographic Names Information System) (National Center for Education Statistics) - STATE ID-1201700102002 (National Center for Education Statistics) - STATE ID-1201700100001 Organizations: HUTSONVILLE C U SCHOOL DIST 1 (SCHOOL DISTRICT)
AMEREN ENERGY GENERATING CO HUTSONVILLE POWER STATION (15142 EAST 1900 AVENUE in HUTSONVILLE, IL)
AIR MAJOR (AIRS/AFS) AIR PROGRAM (Clean Air Markets Division Business System) CRITERIA AND HAZARDOUS AIR POLLUTANT INVENTORY (Inventory of air pollution sources) National Pollutant Discharge Elimination System MAJOR (Tracking pollutant discharge elimination systems) - permit Small Quantity Generators, between 100 kg and 1000 kg of hazardous waste/month (Resource Conservation and Recovery Act (tracking hazardous waste)) USED OIL PROGRAM (Resource Conservation and Recovery Act (tracking hazardous waste)) TRI REPORTER (Tracking of toxic chemicals releasing facilities) Business SIC classification: ELECTRIC SERVICES; ELECTRIC AND OTHER SERVICES COMBINED Business NAICS classification: FOSSIL FUEL ELECTRIC POWER GENERATION. Organizations: AMEREN CIPS (CONTACT/OWNER)
, AMEREN ENERGY GENERATING COMPANY (OWNER/OPERATOR)
Alternative names: AMEREN CORP. HUTSONVILLE POWER STATION, AMEREN CIPS, AMEREN CIPS - HUTSONVILLE, AMEREN CORP. C/O STEVEN L. BURNS, AMEREN ENERGY GENERATING HUTSONVILLE POWER STATION, AMEREN HUTSONVILLE POWER STATION, CEN ILL PUB SER CO HUTSONVILLE
HUTSONVILLE STP (600 EAST CHURCH STREET in HUTSONVILLE, IL)
STATE MASTER (Illinois EPA Project) - National Pollutant Discharge Elimination System Permit National Pollutant Discharge Elimination System NON-MAJOR (Tracking pollutant discharge elimination systems) - permit National Pollutant Discharge Elimination System NON-MAJOR (Tracking pollutant discharge elimination systems) - permit Business SIC classification: SEWERAGE SYSTEMS Alternative names: HUTSONVILLE STP, VILLAGE OF, HUTSONVILLE, VILLAGE OF
CHEMICALS-FERTILIZERS SERVICE INC (PO BOX 146 in HUTSONVILLE, IL)
STATE MASTER (Illinois EPA Project) - AIR PROGRAM AIR MINOR (AIRS/AFS) CRITERIA AND HAZARDOUS AIR POLLUTANT INVENTORY (Inventory of air pollution sources) Business SIC classification: FARM SUPPLIES
AMEREN ENERGY GENERATING CO (PO BOX 216 in HUTSONVILLE, IL)
National Pollutant Discharge Elimination System NON-MAJOR (Tracking pollutant discharge elimination systems) - permit
Housing units lacking complete plumbing facilities: 2.5% Housing units lacking complete kitchen facilities: 3.4%
44.8%Utility gas
30.2%Bottled, tank, or LP gas
24.2%Electricity
1.1%Wood
Population in 1990: 1,039. Population change in the 1990s: +18 (+1.7%).
Place of birth for U.S.-born residents:
This state: 617
Midwest: 427
South: 56
West: 30
64% of the 62433 zip code residents lived in the same house 5 years ago. Out of people who lived in different houses, 63% lived in this county. Out of people who lived in different counties, 50% lived in Illinois.
94% of the 62433 zip code residents lived in the same house 1 year ago. Out of people who lived in different houses, 30% moved from this county. Out of people who lived in different houses, 59% moved from different county within same state. Out of people who lived in different houses, 11% moved from different state.
Private vs. public school enrollment:
Students in private schools in grades 1 to 8 (elementary and middle school): 16
Here:
20.5%
Illinois:
13.3%
Students in private schools in grades 9 to 12 (high school):
Here:
0.0%
Illinois:
9.9%
Students in private undergraduate colleges: 8
Here:
10.5%
Illinois:
27.4%
Occupation by median earnings in the past 12 months ($)
98,038Management occupations
66,561Health diagnosing and treating practitioners and other technical occupations
55,947Production occupations
49,631Transportation occupations
44,262Farming, fishing, and forestry occupations
38,635Office and administrative support occupations
Top industries in this zip code by the number of employees in 2005:
Utilities: Electric Power Distribution (50-99 employees: 1 establishment)
Health Care and Social Assistance: Residential Mental Health and Substance Abuse Facilities (10-19: 2)
63 people in other noninstitutional group quarters
17 people in homes for abused, dependent, and neglected children
10 people in homes or halfway houses for drug/alcohol abuse
Fatal accident statistics in 2012:
Fatal accident count: 1
Vehicles involved in fatal accidents: 1
Fatal accidents caused by drunken drivers: 0
Fatalities: 1
Persons involved in fatal accidents: 4
Pedestrians involved in fatal accidents: 0
2002 - 2018 National Fire Incident Reporting System (NFIRS) incidents
According to the data from the years 2002 - 2018 the average number of fires per year is 7. The highest number of reported fire incidents - 17 took place in 2010, and the least - 1 in 2007. The data has a growing trend.
When looking into fire subcategories, the most incidents belonged to: Structure Fires (39.0%), and Outside Fires (36.6%).
Fire incident types reported to NFIRS in Zip Code 62433


 Nearest zip codes: 62478, 62454, 62413, 62477, 47861, 62451.


 According to the data from the years 2002 - 2018 the average number of fires per year is 7. The highest number of reported fire incidents - 17 took place in 2010, and the least - 1 in 2007. The data has a growing trend.
 When looking into fire subcategories, the most incidents belonged to: Structure Fires (39.0%), and Outside Fires (36.6%).