Estimated zip code population in 2022: 1,823 Zip code population in 2010: 1,623 Zip code population in 2000: 1,458
Houses and condos: 780 Renter-occupied apartments: 57
% of renters here:
8%
State:
33%
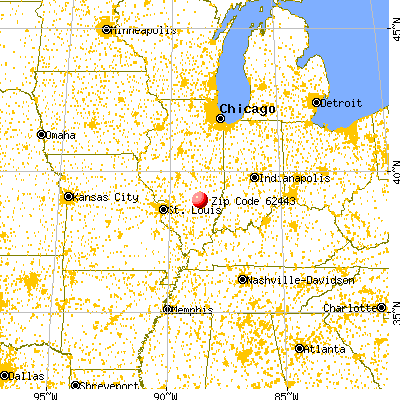
March 2022 cost of living index in zip code 62443: 82.9 (low, U.S. average is 100)
Land area: 73.4 sq. mi. Water area: 0.1 sq. mi.
Population density: 25 people per square mile
(very low).
OSM Map
General Map
Google Map
MSN Map
OSM Map
General Map
Google Map
MSN Map
OSM Map
General Map
Google Map
MSN Map
OSM Map
General Map
Google Map
MSN Map
Please wait while loading the map...
Real estate property taxes paid for housing units in 2022:
This zip code:
1.4% ($2,258)
Illinois:
2.0% ($4,912)
Median real estate property taxes paid for housing units with mortgages in 2022: $2,357 (1.4%) Median real estate property taxes paid for housing units with no mortgage in 2022: $2,249 (1.4%)
Business Search- 14 Million verified businesses
Males: 863
(47.3%)
Females: 960
(52.7%)
For population 25 years and over in 62443:
High school or higher: 88.5%
Bachelor's degree or higher: 10.4%
Graduate or professional degree: 1.6%
Unemployed: 1.4%
Mean travel time to work (commute): 23.2 minutes
For population 15 years and over in 62443:
Never married: 25.8%
Now married: 63.8%
Separated: 1.3%
Widowed: 2.4%
Divorced: 6.7%
Zip code 62443 compared to state average:
Median house value below state average.
Unemployed percentage significantly below state average.
Black race population percentage significantly below state average.
Hispanic race population percentage significantly below state average.
Foreign-born population percentage significantly below state average.
Renting percentage significantly below state average.
Length of stay since moving in significantly below state average.
Number of college students significantly below state average.
Percentage of population with a bachelor's degree or higher significantly below state average.
Averages for the 2020 tax year for zip code 62443, filed in 2021:
Average Adjusted Gross Income (AGI) in 2020: $54,330 (Individual Income Tax Returns)
Here:
$54,330
State:
$82,626
Salary/wage: $46,584 (reported on 85.1% of returns)
Here:
$46,584
State:
$66,640
(% of AGI for various income ranges: 1442.9% for AGIs below $25k, 3705.7% for AGIs $25k-50k, 6593.8% for AGIs $50k-75k, 10755.0% for AGIs $75k-100k, 19958.0% for AGIs $100k-200k)
Taxable interest for individuals: $818 (reported on 45.9% of returns)
This zip code:
$818
Illinois:
$2,376
(% of AGI for various income ranges: 11.8% for AGIs below $25k, 38.6% for AGIs $25k-50k, 28.7% for AGIs $50k-75k, 40.0% for AGIs $75k-100k, 314.0% for AGIs $100k-200k)
Ordinary dividends: $1,650 (reported on 18.9% of returns)
Here:
$1,650
State:
$9,061
(% of AGI for various income ranges: 4.7% for AGIs below $25k, 20.7% for AGIs $25k-50k, 56.2% for AGIs $50k-75k, 298.0% for AGIs $100k-200k)
Net capital gain/loss in AGI: +$3,108 (reported on 17.6% of returns)
Here:
+$3,108
State:
+$31,684
(% of AGI for various income ranges: 6.5% for AGIs below $25k, 41.4% for AGIs $25k-50k, 26.2% for AGIs $50k-75k, 53.3% for AGIs $75k-100k, 564.0% for AGIs $100k-200k)
Profit/loss from business: +$5,310 (reported on 13.5% of returns)
Here:
+$5,310
State:
+$12,175
(% of AGI for various income ranges: 143.5% for AGIs below $25k, 286.2% for AGIs $50k-75k, 116.0% for AGIs $100k-200k)
Taxable individual retirement arrangement distribution: $10,225 (reported on 10.8% of returns)
62443:
$10,225
Illinois:
$21,613
(% of AGI for various income ranges: 131.2% for AGIs below $25k, 328.8% for AGIs $50k-75k, 664.0% for AGIs $100k-200k)
Earned income credit: $2,540 (reported on 13.5% of returns)
Here:
$2,540
State:
$2,311
(% of AGI for various income ranges: 106.5% for AGIs below $25k, 52.1% for AGIs $25k-50k)
Percentage of individuals using paid preparers for their 2020 taxes: 97.3%
Here:
97%
State:
93%
(% for various income ranges: 95.8% for AGIs below $25k, 100.0% for AGIs $25k-50k, 100.0% for AGIs $50k-75k, 88.9% for AGIs $75k-100k, 100.0% for AGIs $100k-200k)
Averages for the 2012 tax year for zip code 62443, filed in 2013:
Average Adjusted Gross Income (AGI) in 2012: $44,347 (Individual Income Tax Returns)
Here:
$44,347
State:
$68,058
Salary/wage: $37,852 (reported on 85.3% of returns)
Here:
$37,852
State:
$55,396
(% of AGI for various income ranges: 80.3% for AGIs below $25k, 79.8% for AGIs $25k-50k, 81.5% for AGIs $50k-75k, 71.5% for AGIs $75k-100k, 55.9% for AGIs $100k-200k)
Taxable interest for individuals: $627 (reported on 44.0% of returns)
This zip code:
$627
Illinois:
$1,969
(% of AGI for various income ranges: 1.1% for AGIs below $25k, 0.5% for AGIs $25k-50k, 0.5% for AGIs $50k-75k, 0.6% for AGIs $75k-100k, 0.6% for AGIs $100k-200k)
Ordinary dividends: $1,042 (reported on 16.0% of returns)
Here:
$1,042
State:
$7,786
(% of AGI for various income ranges: 0.3% for AGIs below $25k, 0.1% for AGIs $25k-50k, 0.2% for AGIs $50k-75k, 1.3% for AGIs $75k-100k)
Net capital gain/loss in AGI: +$1,967 (reported on 12.0% of returns)
Here:
+$1,967
State:
+$22,183
(% of AGI for various income ranges: 1.7% for AGIs below $25k, 0.2% for AGIs $50k-75k, 1.2% for AGIs $100k-200k)
Profit/loss from business: +$5,200 (reported on 16.0% of returns)
Here:
+$5,200
State:
+$12,903
(% of AGI for various income ranges: 1.0% for AGIs below $25k, 2.8% for AGIs $25k-50k, 1.3% for AGIs $50k-75k, 4.1% for AGIs $75k-100k)
Taxable individual retirement arrangement distribution: $8,000 (reported on 8.0% of returns)
62443:
$8,000
Illinois:
$17,929
Total itemized deductions: $21,067 (22% of AGI, reported on 16.0% of returns)
Here:
$21,067
State:
$26,433
Here:
21.9% of AGI
State:
19.2% of AGI
(% of AGI for various income ranges: 8.4% for AGIs $25k-50k, 6.9% for AGIs $50k-75k, 8.6% for AGIs $75k-100k, 10.3% for AGIs $100k-200k)
Charity contributions: $3,944 (reported on 12.0% of returns)
Here:
$3,944
State:
$4,525
(% of AGI for various income ranges: 1.1% for AGIs $50k-75k, 1.9% for AGIs $75k-100k, 1.7% for AGIs $100k-200k)
Taxes paid: $7,425 (reported on 16.0% of returns)
62443:
$7,425
State:
$11,968
(% of AGI for various income ranges: 1.4% for AGIs $25k-50k, 2.2% for AGIs $50k-75k, 2.8% for AGIs $75k-100k, 5.4% for AGIs $100k-200k)
Earned income credit: $2,008 (reported on 16.0% of returns)
Here:
$2,008
State:
$2,349
(% of AGI for various income ranges: 4.7% for AGIs below $25k, 1.0% for AGIs $25k-50k)
Percentage of individuals using paid preparers for their 2012 taxes: 76.0%
Here:
76%
State:
57%
(% for various income ranges: 61.3% for AGIs below $25k, 83.3% for AGIs $25k-50k, 84.6% for AGIs $50k-75k, 87.5% for AGIs $75k-100k, 100.0% for AGIs $100k-200k)
Averages for the 2004 tax year for zip code 62443, filed in 2005:
Average Adjusted Gross Income (AGI) in 2004: $31,966 (Individual Income Tax Returns)
Here:
$31,966
State:
$54,625
Salary/wage: $29,152 (reported on 86.2% of returns)
Here:
$29,152
State:
$46,811
(% of AGI for various income ranges: 107.5% for AGIs below $10k, 76.9% for AGIs $10k-25k, 82.9% for AGIs $25k-50k, 79.3% for AGIs $50k-75k, 76.2% for AGIs $75k-100k, 55.2% for AGIs over 100k)
Taxable interest for individuals: $1,278 (reported on 49.1% of returns)
This zip code:
$1,278
Illinois:
$2,101
(% of AGI for various income ranges: 10.8% for AGIs below $10k, 2.8% for AGIs $10k-25k, 1.3% for AGIs $25k-50k, 1.6% for AGIs $50k-75k, 1.7% for AGIs $75k-100k, 2.1% for AGIs over 100k)
Taxable dividends: $583 (reported on 21.1% of returns)
Here:
$583
State:
$4,306
(% of AGI for various income ranges: 0.9% for AGIs below $10k, 0.4% for AGIs $10k-25k, 0.2% for AGIs $25k-50k, 0.2% for AGIs $50k-75k, 1.2% for AGIs $75k-100k)
Net capital gain/loss: +$1,867 (reported on 15.3% of returns)
Here:
+$1,867
State:
+$17,321
(% of AGI for various income ranges: -1.7% for AGIs below $10k, 1.4% for AGIs $10k-25k, 1.2% for AGIs $25k-50k, 0.6% for AGIs $50k-75k, 1.2% for AGIs $75k-100k)
Profit/loss from business: +$4,028 (reported on 14.6% of returns)
Here:
+$4,028
State:
+$11,771
(% of AGI for various income ranges: 0.4% for AGIs below $10k, 4.0% for AGIs $10k-25k, 0.2% for AGIs $25k-50k, 3.8% for AGIs $50k-75k)
IRA payment deduction: $2,667 (reported on 3.2% of returns)
62443:
$2,667
Illinois:
$3,087
Total itemized deductions: $15,546 (27% of AGI, reported on 13.1% of returns)
Here:
$15,546
State:
$20,239
Here:
26.7% of AGI
State:
19.5% of AGI
(% of AGI for various income ranges: 5.1% for AGIs $10k-25k, 4.3% for AGIs $25k-50k, 6.4% for AGIs $50k-75k, 18.6% for AGIs $75k-100k)
Charity contributions deductions: $2,901 (5% of AGI, reported on 9.6% of returns)
Here:
$2,901
State:
$3,719
Here:
4.7% of AGI
State:
3.4% of AGI
Total tax: $3,110 (reported on 73.5% of returns)
62443:
$3,110
State:
$9,882
(% of AGI for various income ranges: 3.7% for AGIs below $10k, 4.1% for AGIs $10k-25k, 5.8% for AGIs $25k-50k, 7.9% for AGIs $50k-75k, 9.5% for AGIs $75k-100k, 13.8% for AGIs over 100k)
Earned income credit: $1,486 (reported on 14.5% of returns)
Here:
$1,486
State:
$1,788
Percentage of individuals using paid preparers for their 2004 taxes: 78.2%
Here:
78%
State:
61%
(% for various income ranges: 69.3% for AGIs below $10k, 75.6% for AGIs $10k-25k, 83.2% for AGIs $25k-50k, 82.1% for AGIs $50k-75k, 88.6% for AGIs $75k-100k, 85.7% for AGIs over 100k)
Household received Food Stamps/SNAP in the past 12 months: 91 Household did not receive Food Stamps/SNAP in the past 12 months: 653
Women who had a birth in the past 12 months: 20 (14 now married, 5 unmarried) Women who did not have a birth in the past 12 months: 347 (203 now married, 141 unmarried)
Housing units in zip code 62443 with a mortgage: 342 (19 second mortgage, 13 both second mortgage and home equity loan) Houses without a mortgage: 35
Median monthly owner costs for units with a mortgage: $1,186 Median monthly owner costs for units without a mortgage: $617
Residents with income below the poverty level in 2022:
This zip code:
12.0%
Whole state:
11.9%
Residents with income below 50% of the poverty level in 2022:
This zip code:
3.4%
Whole state:
5.7%
Median number of rooms in houses and condos:
Here:
6.3
State:
6.4
Median number of rooms in apartments:
Here:
6.0
State:
4.1
Notable locations in this zip code not listed on our city pages
233 married couples with children.
39 single-parent households (25 men, 14 women).
98.9% of residents of 62443 zip code speak English at home.
0.4% of residents speak Asian or Pacific Island language at home (100% well).
Foreign born population: 7 (0.4%) (100.0% of them are naturalized citizens)
This zip code:
0.4%
Whole state:
14.4%
100%China, excluding Hong Kong and Taiwan
51%German
12%American
9%English
5%Italian
2%Irish
1%European
1%Belgian
Year of entry for the foreign-born population
02010 or later
22000 to 2009
01990 to 1999
7Before 1990
Facilities with environmental interests located in this zip code:
MASON STP (NORTH EAST CORNER OF MASON in MASON, IL)
STATE MASTER (Illinois EPA Project) - National Pollutant Discharge Elimination System Permit National Pollutant Discharge Elimination System NON-MAJOR (Tracking pollutant discharge elimination systems) - permit National Pollutant Discharge Elimination System NON-MAJOR (Tracking pollutant discharge elimination systems) - permit Business SIC classification: SEWERAGE SYSTEMS Alternative names: MASON STP, TOWN OF
NEW FASHION PORK (15686 E 100TH AVE in MASON, IL)
STATE MASTER (Illinois EPA Project) - AIR PROGRAM AIR MINOR (AIRS/AFS) Business SIC classification: HOGS
ILDOT BRG 025 0073 (CH 24 OVER FAI 57 in MASON, IL)
Small Quantity Generators, between 100 kg and 1000 kg of hazardous waste/month (Resource Conservation and Recovery Act (tracking hazardous waste)) - notification
Housing units lacking complete kitchen facilities: 3.3%
55.0%Bottled, tank, or LP gas
16.0%Wood
14.9%Utility gas
11.3%Electricity
2.5%Other fuel
0.5%No fuel used
Population in 1990: 1,774.
Place of birth for U.S.-born residents:
This state: 1,595
Northeast: 19
Midwest: 88
South: 29
West: 73
68% of the 62443 zip code residents lived in the same house 5 years ago. Out of people who lived in different houses, 65% lived in this county. Out of people who lived in different counties, 50% lived in Illinois.
91% of the 62443 zip code residents lived in the same house 1 year ago. Out of people who lived in different houses, 71% moved from this county. Out of people who lived in different houses, 15% moved from different county within same state. Out of people who lived in different houses, 10% moved from different state.
Private vs. public school enrollment:
Students in private schools in grades 1 to 8 (elementary and middle school): 13
Here:
14.9%
Illinois:
13.3%
Students in private schools in grades 9 to 12 (high school): 4
Here:
6.9%
Illinois:
9.9%
Students in private undergraduate colleges: 2
Here:
20.6%
Illinois:
27.4%
Occupation by median earnings in the past 12 months ($)
63,812Transportation occupations
60,286Management occupations
54,703Construction and extraction occupations
54,635Building and grounds cleaning and maintenance occupations
52,722Production occupations
48,150Health technologists and technicians
Top industries in this zip code by the number of employees in 2005:
Construction: New Single-Family Housing Construction (except Operative Builders) (20-49 employees: 1 establishment, 1-4 employees: 2 establishments)
Accommodation and Food Services: Rooming and Boarding Houses (10-19: 1)
Health Care and Social Assistance: Child Day Care Services (5-9: 1)
Mining: Crude Petroleum and Natural Gas Extraction (1-4: 3)
Construction: Drywall and Insulation Contractors (1-4: 1)
Other Services (except Public Administration): Religious Organizations (1-4: 1)
Construction: All Other Specialty Trade Contractors (1-4: 1)
Construction: Framing Contractors (1-4: 1)
People in group quarters in 2010:
7 people in group homes intended for adults
People in group quarters in 2000:
9 people in nursing homes
2003 - 2018 National Fire Incident Reporting System (NFIRS) incidents
According to the data from the years 2003 - 2018 the average number of fires per year is 7. The highest number of reported fire incidents - 20 took place in 2010, and the least - 2 in 2003. The data has a growing trend.
When looking into fire subcategories, the most incidents belonged to: Outside Fires (45.1%), and Structure Fires (22.1%).
Fire incident types reported to NFIRS in Zip Code 62443


 Nearest zip codes: 62426, 62473, 62838, 62411, 62401, 62858.


 According to the data from the years 2003 - 2018 the average number of fires per year is 7. The highest number of reported fire incidents - 20 took place in 2010, and the least - 2 in 2003. The data has a growing trend.
 When looking into fire subcategories, the most incidents belonged to: Outside Fires (45.1%), and Structure Fires (22.1%).