Estimated zip code population in 2022: 2,916 Zip code population in 2010: 3,175 Zip code population in 2000: 3,212
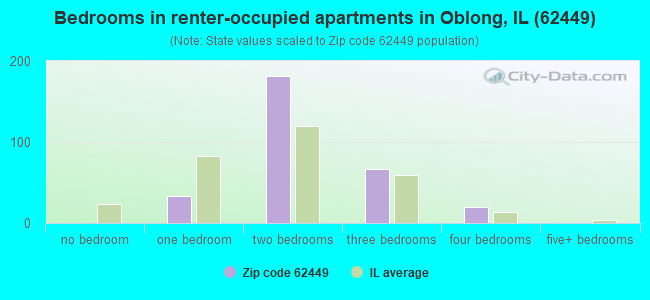
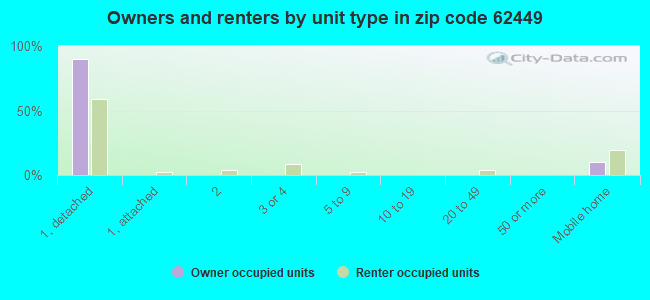
Houses and condos: 1,392 Renter-occupied apartments: 306
% of renters here:
23%
State:
33%
March 2022 cost of living index in zip code 62449: 83.4 (less than average, U.S. average is 100)
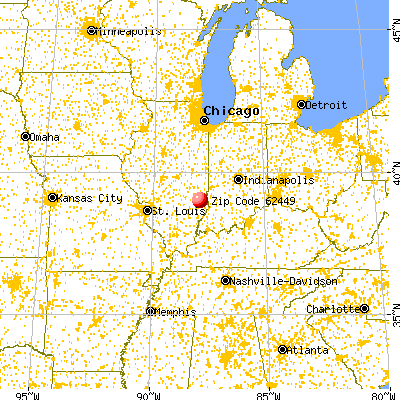
Land area: 122.3 sq. mi. Water area: 0.0 sq. mi.
Population density: 24 people per square mile
(very low).
OSM Map
General Map
Google Map
MSN Map
OSM Map
General Map
Google Map
MSN Map
OSM Map
General Map
Google Map
MSN Map
OSM Map
General Map
Google Map
MSN Map
Please wait while loading the map...
Real estate property taxes paid for housing units in 2022:
This zip code:
1.6% ($1,789)
Illinois:
2.0% ($4,912)
Median real estate property taxes paid for housing units with mortgages in 2022: $1,692 (1.6%) Median real estate property taxes paid for housing units with no mortgage in 2022: $2,011 (1.8%)
Business Search- 14 Million verified businesses
Males: 1,512
(51.9%)
Females: 1,403
(48.1%)
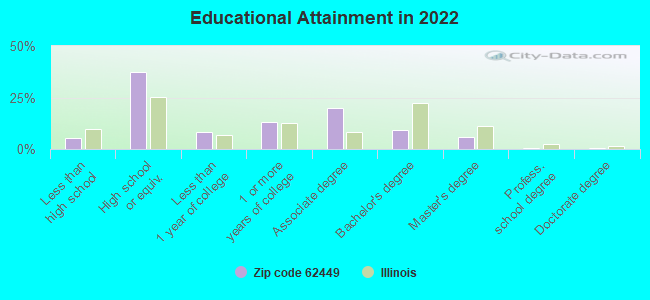
For population 25 years and over in 62449:
High school or higher: 93.7%
Bachelor's degree or higher: 16.1%
Graduate or professional degree: 7.0%
Unemployed: 2.3%
Mean travel time to work (commute): 16.7 minutes
For population 15 years and over in 62449:
Never married: 19.9%
Now married: 61.6%
Separated: 1.3%
Widowed: 8.8%
Divorced: 8.4%
Zip code 62449 compared to state average:
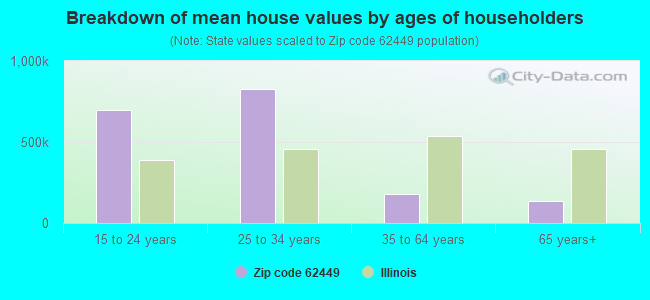
Median house value significantly below state average.
Unemployed percentage below state average.
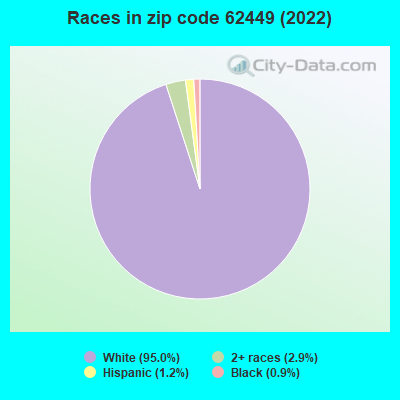
Black race population percentage significantly below state average.
Hispanic race population percentage significantly below state average.
Median age significantly above state average.
Foreign-born population percentage significantly below state average.
Length of stay since moving in significantly above state average.
Number of college students below state average.
Percentage of population with a bachelor's degree or higher below state average.
Estimated median house/condo value in 2022: $109,227
62449:
$109,227
Illinois:
$251,600
According to our research of Illinois and other state lists, there were 5 registered sex offenders living in 62449 zip code as of May 28, 2024. The ratio of all residents to sex offenders in zip code 62449 is 650 to 1. The ratio of registered sex offenders to all residents in this zip code is near the state average.
Median resident age:
This zip code:
48.3 years
Illinois median age:
39.1 years
Average household size:
This zip code:
2.1 people
Illinois:
2.4 people
Averages for the 2020 tax year for zip code 62449, filed in 2021:
Average Adjusted Gross Income (AGI) in 2020: $55,734 (Individual Income Tax Returns)
Here:
$55,734
State:
$82,626
Salary/wage: $47,846 (reported on 74.8% of returns)
Here:
$47,846
State:
$66,640
(% of AGI for various income ranges: 1157.7% for AGIs below $25k, 3685.4% for AGIs $25k-50k, 6020.0% for AGIs $50k-75k, 7641.1% for AGIs $75k-100k, 16372.3% for AGIs $100k-200k)
Taxable interest for individuals: $835 (reported on 36.7% of returns)
This zip code:
$835
Illinois:
$2,376
(% of AGI for various income ranges: 21.0% for AGIs below $25k, 13.5% for AGIs $25k-50k, 40.7% for AGIs $50k-75k, 111.1% for AGIs $75k-100k, 130.0% for AGIs $100k-200k)
Ordinary dividends: $3,626 (reported on 19.4% of returns)
Here:
$3,626
State:
$9,061
(% of AGI for various income ranges: 32.6% for AGIs below $25k, 41.5% for AGIs $25k-50k, 109.3% for AGIs $50k-75k, 94.4% for AGIs $75k-100k, 409.2% for AGIs $100k-200k)
Net capital gain/loss in AGI: +$2,970 (reported on 16.5% of returns)
Here:
+$2,970
State:
+$31,684
(% of AGI for various income ranges: 5.8% for AGIs below $25k, 27.3% for AGIs $25k-50k, 69.3% for AGIs $50k-75k, 140.0% for AGIs $75k-100k, 285.4% for AGIs $100k-200k)
Profit/loss from business: +$10,296 (reported on 17.3% of returns)
Here:
+$10,296
State:
+$12,175
(% of AGI for various income ranges: 87.1% for AGIs below $25k, 271.9% for AGIs $25k-50k, 274.3% for AGIs $50k-75k, 672.2% for AGIs $75k-100k, 388.5% for AGIs $100k-200k)
Taxable individual retirement arrangement distribution: $16,650 (reported on 12.9% of returns)
62449:
$16,650
Illinois:
$21,613
(% of AGI for various income ranges: 109.0% for AGIs below $25k, 106.9% for AGIs $25k-50k, 235.7% for AGIs $50k-75k, 672.2% for AGIs $75k-100k, 1112.3% for AGIs $100k-200k)
Total itemized deductions: $35,325 (reported on 2.9% of returns)
Here:
$35,325
State:
$34,948
(% of AGI for various income ranges: 1086.9% for AGIs $100k-200k)
Charity contributions: $17,200 (reported on 2.2% of returns)
Here:
$17,200
State:
$13,122
(% of AGI for various income ranges: 396.9% for AGIs $100k-200k)
Taxes paid: $7,675 (reported on 2.9% of returns)
62449:
$7,675
State:
$8,563
(% of AGI for various income ranges: 236.2% for AGIs $100k-200k)
Earned income credit: $2,462 (reported on 15.1% of returns)
Here:
$2,462
State:
$2,311
(% of AGI for various income ranges: 105.2% for AGIs below $25k, 73.5% for AGIs $25k-50k)
Percentage of individuals using paid preparers for their 2020 taxes: 95.0%
Here:
95%
State:
93%
(% for various income ranges: 95.7% for AGIs below $25k, 97.2% for AGIs $25k-50k, 95.0% for AGIs $50k-75k, 92.9% for AGIs $75k-100k, 95.0% for AGIs $100k-200k, 66.7% for AGIs over 200k)
Averages for the 2012 tax year for zip code 62449, filed in 2013:
Average Adjusted Gross Income (AGI) in 2012: $52,197 (Individual Income Tax Returns)
Here:
$52,197
State:
$68,058
Salary/wage: $41,868 (reported on 76.7% of returns)
Here:
$41,868
State:
$55,396
(% of AGI for various income ranges: 66.7% for AGIs below $25k, 74.4% for AGIs $25k-50k, 66.4% for AGIs $50k-75k, 64.0% for AGIs $75k-100k, 66.6% for AGIs $100k-200k, 32.9% for AGIs over 200k)
Taxable interest for individuals: $1,021 (reported on 41.8% of returns)
This zip code:
$1,021
Illinois:
$1,969
(% of AGI for various income ranges: 1.8% for AGIs below $25k, 0.7% for AGIs $25k-50k, 0.7% for AGIs $50k-75k, 1.2% for AGIs $75k-100k, 0.6% for AGIs $100k-200k, 0.4% for AGIs over 200k)
Ordinary dividends: $2,727 (reported on 22.6% of returns)
Here:
$2,727
State:
$7,786
(% of AGI for various income ranges: 1.3% for AGIs below $25k, 1.2% for AGIs $25k-50k, 0.9% for AGIs $50k-75k, 0.9% for AGIs $75k-100k, 2.4% for AGIs $100k-200k)
Net capital gain/loss in AGI: +$1,652 (reported on 14.4% of returns)
Here:
+$1,652
State:
+$22,183
(% of AGI for various income ranges: 0.4% for AGIs $50k-75k, 0.5% for AGIs $75k-100k, 1.3% for AGIs $100k-200k)
Profit/loss from business: +$8,984 (reported on 17.1% of returns)
Here:
+$8,984
State:
+$12,903
(% of AGI for various income ranges: 5.3% for AGIs below $25k, 5.1% for AGIs $25k-50k, 3.4% for AGIs $50k-75k, 2.3% for AGIs $75k-100k, 2.8% for AGIs $100k-200k)
Taxable individual retirement arrangement distribution: $12,267 (reported on 12.3% of returns)
62449:
$12,267
Illinois:
$17,929
(% of AGI for various income ranges: 3.7% for AGIs below $25k, 3.1% for AGIs $25k-50k, 2.5% for AGIs $50k-75k, 4.9% for AGIs $75k-100k, 3.6% for AGIs $100k-200k)
Total itemized deductions: $21,076 (16% of AGI, reported on 17.1% of returns)
Here:
$21,076
State:
$26,433
Here:
16.4% of AGI
State:
19.2% of AGI
(% of AGI for various income ranges: 4.8% for AGIs below $25k, 5.1% for AGIs $25k-50k, 6.1% for AGIs $50k-75k, 5.6% for AGIs $75k-100k, 9.8% for AGIs $100k-200k, 7.6% for AGIs over 200k)
Charity contributions: $6,894 (reported on 11.0% of returns)
Here:
$6,894
State:
$4,525
(% of AGI for various income ranges: 0.5% for AGIs $25k-50k, 1.1% for AGIs $50k-75k, 1.0% for AGIs $75k-100k, 4.3% for AGIs $100k-200k)
Taxes paid: $7,440 (reported on 17.1% of returns)
62449:
$7,440
State:
$11,968
(% of AGI for various income ranges: 0.6% for AGIs below $25k, 1.0% for AGIs $25k-50k, 1.5% for AGIs $50k-75k, 1.8% for AGIs $75k-100k, 4.3% for AGIs $100k-200k, 3.8% for AGIs over 200k)
Earned income credit: $2,148 (reported on 15.8% of returns)
Here:
$2,148
State:
$2,349
(% of AGI for various income ranges: 5.6% for AGIs below $25k, 0.8% for AGIs $25k-50k)
Percentage of individuals using paid preparers for their 2012 taxes: 68.5%
Here:
68%
State:
57%
(% for various income ranges: 62.7% for AGIs below $25k, 70.6% for AGIs $25k-50k, 72.7% for AGIs $50k-75k, 71.4% for AGIs $75k-100k, 78.6% for AGIs $100k-200k, 66.7% for AGIs over 200k)
Averages for the 2004 tax year for zip code 62449, filed in 2005:
Average Adjusted Gross Income (AGI) in 2004: $34,492 (Individual Income Tax Returns)
Here:
$34,492
State:
$54,625
Salary/wage: $30,277 (reported on 80.1% of returns)
Here:
$30,277
State:
$46,811
(% of AGI for various income ranges: 77.9% for AGIs below $10k, 67.2% for AGIs $10k-25k, 74.8% for AGIs $25k-50k, 77.6% for AGIs $50k-75k, 75.9% for AGIs $75k-100k, 45.6% for AGIs over 100k)
Taxable interest for individuals: $1,330 (reported on 50.1% of returns)
This zip code:
$1,330
Illinois:
$2,101
(% of AGI for various income ranges: 7.4% for AGIs below $10k, 3.9% for AGIs $10k-25k, 1.6% for AGIs $25k-50k, 1.5% for AGIs $50k-75k, 1.8% for AGIs $75k-100k, 0.7% for AGIs over 100k)
Taxable dividends: $1,762 (reported on 24.4% of returns)
Here:
$1,762
State:
$4,306
(% of AGI for various income ranges: 1.5% for AGIs below $10k, 1.3% for AGIs $10k-25k, 1.1% for AGIs $25k-50k, 0.9% for AGIs $50k-75k, 0.8% for AGIs $75k-100k, 2.6% for AGIs over 100k)
Net capital gain/loss: +$3,444 (reported on 14.0% of returns)
Here:
+$3,444
State:
+$17,321
(% of AGI for various income ranges: -2.0% for AGIs below $10k, -0.2% for AGIs $10k-25k, 0.4% for AGIs $25k-50k, 0.5% for AGIs $50k-75k, 0.7% for AGIs $75k-100k, 7.2% for AGIs over 100k)
Profit/loss from business: +$4,864 (reported on 15.9% of returns)
Here:
+$4,864
State:
+$11,771
(% of AGI for various income ranges: 3.8% for AGIs below $10k, 3.2% for AGIs $10k-25k, 2.8% for AGIs $25k-50k, 1.9% for AGIs $50k-75k, 0.1% for AGIs $75k-100k, 3.1% for AGIs over 100k)
Profit/loss from farming: +$8,402 (reported on 7.9% of returns)
Here:
+$8,402
State:
+$2,327
(% of AGI for various income ranges: 0.1% for AGIs below $10k, -0.3% for AGIs $10k-25k, 1.3% for AGIs $25k-50k, 0.7% for AGIs $50k-75k, -0.8% for AGIs $75k-100k, 10.2% for AGIs over 100k)
IRA payment deduction: $3,148 (reported on 1.8% of returns)
62449:
$3,148
Illinois:
$3,087
Total itemized deductions: $14,266 (22% of AGI, reported on 14.7% of returns)
Here:
$14,266
State:
$20,239
Here:
21.7% of AGI
State:
19.5% of AGI
(% of AGI for various income ranges: 6.9% for AGIs $10k-25k, 5.0% for AGIs $25k-50k, 4.9% for AGIs $50k-75k, 9.4% for AGIs $75k-100k, 6.8% for AGIs over 100k)
Charity contributions deductions: $3,729 (5% of AGI, reported on 10.5% of returns)
Here:
$3,729
State:
$3,719
Here:
5.3% of AGI
State:
3.4% of AGI
(% of AGI for various income ranges: 0.5% for AGIs $10k-25k, 0.8% for AGIs $25k-50k, 0.8% for AGIs $50k-75k, 1.6% for AGIs $75k-100k, 2.3% for AGIs over 100k)
Total tax: $4,436 (reported on 72.0% of returns)
62449:
$4,436
State:
$9,882
(% of AGI for various income ranges: 2.4% for AGIs below $10k, 3.8% for AGIs $10k-25k, 7.0% for AGIs $25k-50k, 8.5% for AGIs $50k-75k, 10.9% for AGIs $75k-100k, 18.3% for AGIs over 100k)
Earned income credit: $1,528 (reported on 15.9% of returns)
Here:
$1,528
State:
$1,788
Percentage of individuals using paid preparers for their 2004 taxes: 73.7%
Here:
74%
State:
61%
(% for various income ranges: 65.8% for AGIs below $10k, 73.4% for AGIs $10k-25k, 76.3% for AGIs $25k-50k, 74.5% for AGIs $50k-75k, 81.6% for AGIs $75k-100k, 92.5% for AGIs over 100k)
Household received Food Stamps/SNAP in the past 12 months: 315 Household did not receive Food Stamps/SNAP in the past 12 months: 1,010
Women who had a birth in the past 12 months: 22 (3 now married, 18 unmarried) Women who did not have a birth in the past 12 months: 560 (289 now married, 268 unmarried)
Housing units in zip code 62449 with a mortgage: 511 (43 second mortgage, 36 both second mortgage and home equity loan) Houses without a mortgage: 21
Median monthly owner costs for units with a mortgage: $1,124 Median monthly owner costs for units without a mortgage: $502
Residents with income below the poverty level in 2022:
This zip code:
11.6%
Whole state:
11.9%
Residents with income below 50% of the poverty level in 2022:
This zip code:
6.5%
Whole state:
5.7%
Median number of rooms in houses and condos:
Here:
6.8
State:
6.4
Median number of rooms in apartments:
Here:
4.2
State:
4.1
Notable locations in this zip code not listed on our city pages
Notable locations in zip code 62449: Meese Farms (A), Gibler Farms (B), Newbold Farms (C), Sackrider Farms (D), Dart Farm (E), Dogwood Creek Farm (F), Harris Farms (G), Maple Creek Farms (H), Sholders Farms (I), Musgrave Farms (J), Wardtbaugh Farms (K), Lewis Farms (L), Goodwin Farms (M), Green Meadow Acres (N), Kraus Farms (O), York Livestock Farms (P), Clark Farms (Q), Sainte Marie Townhall (R), Oblong Township Fire Protection District (S). Display/hide their locations on the map
Churches in zip code 62449 include: Berlin Congregational Church (A), Prairie Grove Church (B), Prior Grove Baptist Church (C), Saint Valentine Church (D), Seed Chapel (E), South Bend Church (F), Central United Methodist Church (G), Evangelical United Methodist Church (H), First Baptist Church of Oblong (I). Display/hide their locations on the map
Cemeteries: Yager Cemetery (1), Randolph Cemetery (2), White Oak Cemetery (3), Prior Grove Cemetery (4), Prairie Grove Cemetery (5), Oblong Cemetery (6), Harmony Cemetery (7). Display/hide their locations on the map
Streams, rivers, and creeks: Muddy Creek (A), Brush Creek (B), Big Creek (C), Sam Branch (D), Dogwood Creek (E), Dead River (F), Little Creek (G), No Business Creek (H), Willow Creek (I). Display/hide their locations on the map
In group quarters: 109 (-1 institutionalized population)
Size of family households: 502 2-persons, 253 3-persons, 117 4-persons, 54 5-persons, 5 6-persons, 16 7-or-more-persons
Size of nonfamily households: 322 1-person, 35 2-persons
367 married couples with children.
106 single-parent households (17 men, 89 women).
97.0% of residents of 62449 zip code speak English at home.
1.3% of residents speak Spanish at home (86% very well, 14% well).
1.7% of residents speak other Indo-European language at home (60% very well, 10% not well, 29% not at all).
0.1% of residents speak other language at home (100% very well).
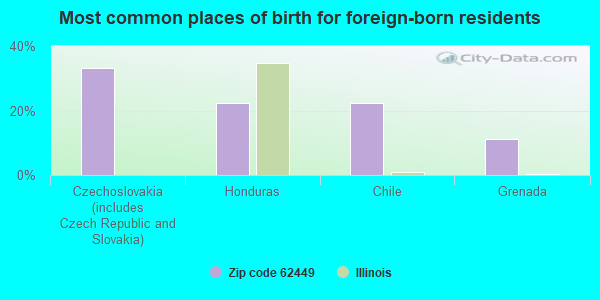
Foreign born population: 9 (0.3%) (44.7% of them are naturalized citizens)
This zip code:
0.3%
Whole state:
14.4%
33%Czechoslovakia (includes Czech Republic and Slovakia)
22%Honduras
22%Chile
11%Grenada
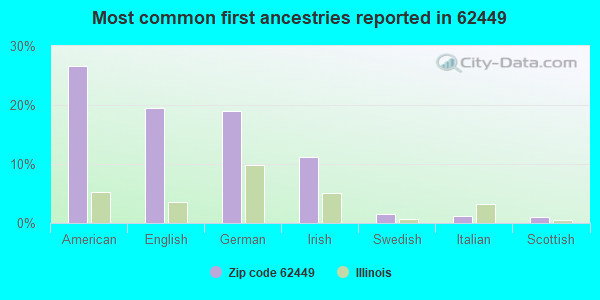
27%American
20%English
19%German
11%Irish
1%Swedish
1%Italian
1%Scottish
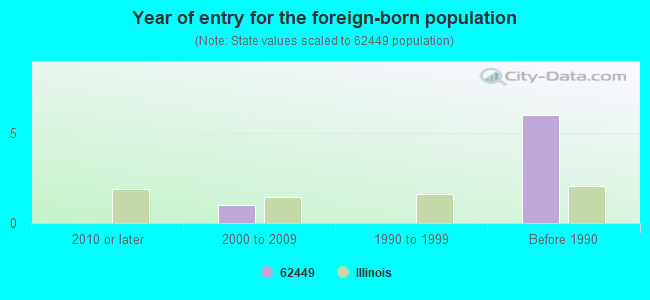
Year of entry for the foreign-born population
02010 or later
12000 to 2009
01990 to 1999
6Before 1990
Major facilities with environmental interests located in this zip code:
OBLONG FEED & SEED INC (314 S RANGE ST in OBLONG, IL)
STATE MASTER (Illinois EPA Project) - HAZARDOUS WASTE PROGRAM, AIR PROGRAM AIR MINOR (AIRS/AFS) CRITERIA AND HAZARDOUS AIR POLLUTANT INVENTORY (Inventory of air pollution sources) Small Quantity Generators, between 100 kg and 1000 kg of hazardous waste/month (Resource Conservation and Recovery Act (tracking hazardous waste)) - notification Business SIC classification: GRAIN AND FIELD BEANS Organizations: SIEMER MILLING CO (CONTACT/OWNER)
Alternative names: OBLONG GRAIN CO
LEOHR OIL CO (S ROOSEVELT ST in OBLONG, IL)
STATE MASTER (Illinois EPA Project) - AIR PROGRAM AIR MINOR (AIRS/AFS) CRITERIA AND HAZARDOUS AIR POLLUTANT INVENTORY (Inventory of air pollution sources) Business SIC classification: PETROLEUM BULK STATIONS AND TERMINALS
MARATHON TANK SERVICE (ROUTE 33 E in OBLONG, IL)
STATE MASTER (Illinois EPA Project) - AIR PROGRAM AIR MINOR (AIRS/AFS) CRITERIA AND HAZARDOUS AIR POLLUTANT INVENTORY (Inventory of air pollution sources) Business SIC classification: PETROLEUM BULK STATIONS AND TERMINALS
MONT EAGLE MILLS (300 S GRANT ST in OBLONG, IL)
STATE MASTER (Illinois EPA Project) - AIR PROGRAM AIR MINOR (AIRS/AFS) CRITERIA AND HAZARDOUS AIR POLLUTANT INVENTORY (Inventory of air pollution sources) Business SIC classification: GRAIN AND FIELD BEANS
MONT EAGLE MILLS-WEST ELEVATOR (1000 W MAIN in OBLONG, IL)
STATE MASTER (Illinois EPA Project) - AIR PROGRAM AIR MINOR (AIRS/AFS) CRITERIA AND HAZARDOUS AIR POLLUTANT INVENTORY (Inventory of air pollution sources) Business SIC classification: GRAIN AND FIELD BEANS
HARMON S DRUGSTORE (111 E MAIN in OBLONG, IL)
STATE MASTER (Illinois EPA Project) - AIR PROGRAM AIR MINOR (AIRS/AFS) Business SIC classification: NONCLASSIFIABLE ESTABLISHMENTS Alternative names: HARMONS DRUGSTORE
JOHN L NEELEY (301 N. GRANT STREET in OBLONG, IL)
STATE MASTER (Illinois EPA Project) - AIR PROGRAM AIR MINOR (AIRS/AFS) Business SIC classification: PETROLEUM BULK STATIONS AND TERMINALS
KNOLLENBERG FARM (9484 N 200TH ST in OBLONG, IL)
STATE MASTER (Illinois EPA Project) - AIR PROGRAM AIR MINOR (AIRS/AFS) Business SIC classification: NONCLASSIFIABLE ESTABLISHMENTS
LINCOLN TRAIL FS (R R in OBLONG, IL)
STATE MASTER (Illinois EPA Project) - AIR PROGRAM AIR MINOR (AIRS/AFS) Business SIC classification: FARM SUPPLIES
MARATHON PIPE LINE CO (RURAL in OBLONG, IL)
STATE MASTER (Illinois EPA Project) - AIR PROGRAM AIR MINOR (AIRS/AFS) Business SIC classification: REFINED PETROLEUM PIPELINES Alternative names: MARATHON PIPE LINE CO-OBLONG TWP STATION
MONT EAGLE MILLS INC (507 E MAIN in OBLONG, IL)
STATE MASTER (Illinois EPA Project) - AIR PROGRAM AIR MINOR (AIRS/AFS) Business SIC classification: FLOUR AND OTHER GRAIN MILL PRODUCTS Alternative names: MONT EAGLE MILLS,INC
OBLONG IGA (109 W MAIN in OBLONG, IL)
STATE MASTER (Illinois EPA Project) - AIR PROGRAM AIR MINOR (AIRS/AFS) Business SIC classification: GROCERY STORES
PERINO TECHNICAL SERVICES INC (RURAL in OBLONG, IL)
STATE MASTER (Illinois EPA Project) - AIR PROGRAM AIR MINOR (AIRS/AFS) Business SIC classification: NONCLASSIFIABLE ESTABLISHMENTS
Housing units lacking complete plumbing facilities: 1.2% Housing units lacking complete kitchen facilities: 1.2%
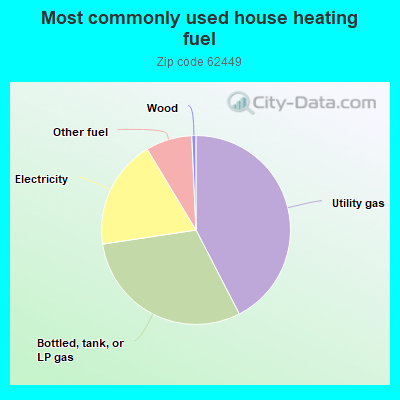
42.3%Utility gas
30.1%Bottled, tank, or LP gas
18.7%Electricity
7.9%Other fuel
0.7%Wood
Population in 1990: 3,508.
Place of birth for U.S.-born residents:
This state: 2,116
Northeast: 35
Midwest: 560
South: 142
West: 46
72% of the 62449 zip code residents lived in the same house 5 years ago. Out of people who lived in different houses, 62% lived in this county. Out of people who lived in different counties, 50% lived in Illinois.
92% of the 62449 zip code residents lived in the same house 1 year ago. Out of people who lived in different houses, 57% moved from this county. Out of people who lived in different houses, 39% moved from different county within same state. Out of people who lived in different houses, 2% moved from different state.
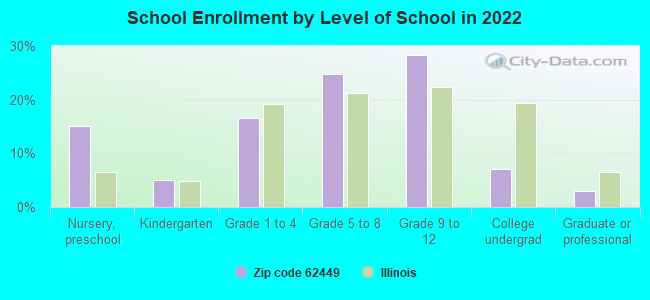
Private vs. public school enrollment:
Students in private schools in grades 1 to 8 (elementary and middle school): 4
Here:
1.9%
Illinois:
13.3%
Students in private schools in grades 9 to 12 (high school): 24
Here:
16.4%
Illinois:
9.9%
Students in private undergraduate colleges:
Here:
0.0%
Illinois:
27.4%
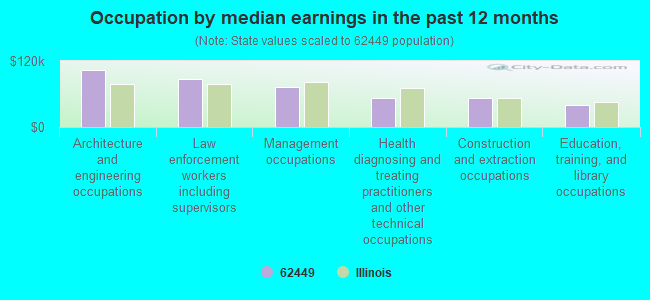
Occupation by median earnings in the past 12 months ($)
103,770Architecture and engineering occupations
86,657Law enforcement workers including supervisors
72,546Management occupations
52,597Health diagnosing and treating practitioners and other technical occupations
52,381Construction and extraction occupations
39,862Education, training, and library occupations
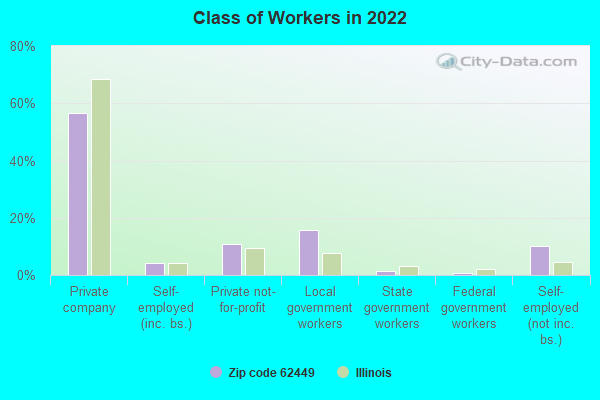
Top industries in this zip code by the number of employees in 2005:
Other Services (except Public Administration): Commercial and Industrial Machinery and Equipment (except Automotive and Electronic) Repair and Maintenance (10-19 employees: 1 establishment, 5-9 employees: 3 establishments, 1-4 employees: 2 establishments)
Other Services (except Public Administration): Religious Organizations (10-19: 1, 5-9: 2, 1-4: 3)
Health Care and Social Assistance: Child Day Care Services (20-49: 1)
Health Care and Social Assistance: Nursing Care Facilities (20-49: 1)
Wholesale Trade: Grain and Field Bean Merchant Wholesalers (20-49: 1)
Finance and Insurance: Commercial Banking (10-19: 1, 5-9: 2)
Health Care and Social Assistance: Residential Mental Retardation Facilities (10-19: 1, 5-9: 1)
Mining: Support Activities for Oil and Gas Operations (10-19: 1, 1-4: 3)
People in group quarters in 2010:
49 people in nursing facilities/skilled-nursing facilities
25 people in group homes for juveniles (non-correctional)
15 people in group homes intended for adults
9 people in workers' group living quarters and job corps centers
People in group quarters in 2000:
47 people in nursing homes
20 people in other group homes
9 people in homes or halfway houses for drug/alcohol abuse
Fatal accident statistics in 2014:
Fatal accident count: 1
Vehicles involved in fatal accidents: 1
Fatal accidents caused by drunken drivers: 0
Fatalities: 1
Persons involved in fatal accidents: 2
Pedestrians involved in fatal accidents: 0
2002 - 2018 National Fire Incident Reporting System (NFIRS) incidents
Based on the data from the years 2002 - 2018 the average number of fire incidents per year is 20. The highest number of fire incidents - 36 took place in 2010, and the least - 10 in 2013. The data has a dropping trend.
When looking into fire subcategories, the most incidents belonged to: Outside Fires (46.9%), and Structure Fires (39.0%).
Fire incident types reported to NFIRS in Zip Code 62449


 Nearest zip codes: 62480, 62459, 62413, 62454, 62481, 62475.


 Based on the data from the years 2002 - 2018 the average number of fire incidents per year is 20. The highest number of fire incidents - 36 took place in 2010, and the least - 10 in 2013. The data has a dropping trend.
 When looking into fire subcategories, the most incidents belonged to: Outside Fires (46.9%), and Structure Fires (39.0%).