Estimated zip code population in 2022: 2,336 Zip code population in 2010: 2,564 Zip code population in 2000: 2,468
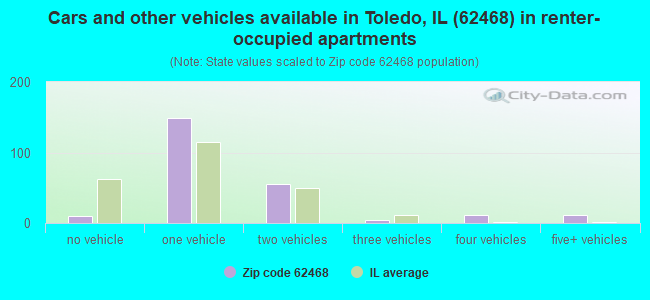
Houses and condos: 1,132 Renter-occupied apartments: 245
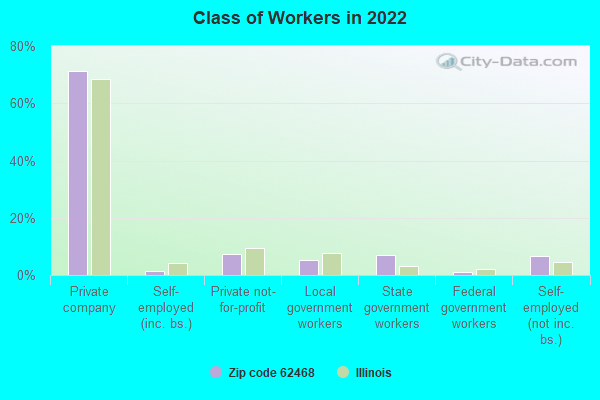
% of renters here:
24%
State:
33%
March 2022 cost of living index in zip code 62468: 83.3 (low, U.S. average is 100)
Land area: 70.8 sq. mi. Water area: 0.0 sq. mi.
Population density: 33 people per square mile
(very low).
OSM Map
General Map
Google Map
MSN Map
OSM Map
General Map
Google Map
MSN Map
OSM Map
General Map
Google Map
MSN Map
OSM Map
General Map
Google Map
MSN Map
Please wait while loading the map...
Real estate property taxes paid for housing units in 2022:
This zip code:
1.7% ($1,946)
Illinois:
2.0% ($4,912)
Median real estate property taxes paid for housing units with mortgages in 2022: $1,931 (1.6%) Median real estate property taxes paid for housing units with no mortgage in 2022: $1,965 (1.8%)
Business Search- 14 Million verified businesses
Males: 1,260
(53.9%)
Females: 1,076
(46.1%)
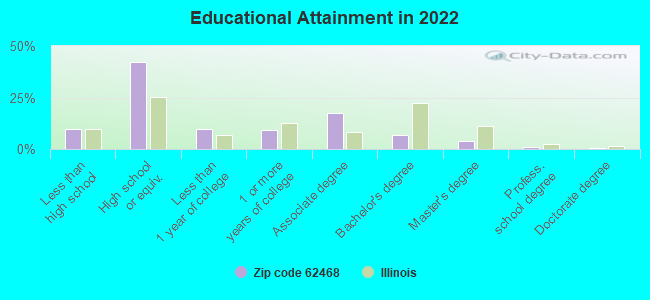
For population 25 years and over in 62468:
High school or higher: 90.2%
Bachelor's degree or higher: 12.0%
Graduate or professional degree: 5.1%
Unemployed: 0.6%
Mean travel time to work (commute): 24.7 minutes
For population 15 years and over in 62468:
Never married: 22.5%
Now married: 58.4%
Separated: 0.9%
Widowed: 7.1%
Divorced: 11.1%
Zip code 62468 compared to state average:
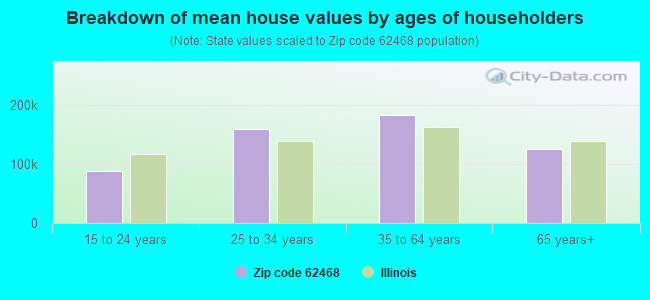
Median house value below state average.
Unemployed percentage significantly below state average.
Black race population percentage significantly below state average.
Hispanic race population percentage below state average.
Median age significantly above state average.
Foreign-born population percentage significantly below state average.
Length of stay since moving in significantly above state average.
Percentage of population with a bachelor's degree or higher significantly below state average.
Estimated median house/condo value in 2022: $113,857
62468:
$113,857
Illinois:
$251,600
According to our research of Illinois and other state lists, there were 3 registered sex offenders living in 62468 zip code as of May 28, 2024. The ratio of all residents to sex offenders in zip code 62468 is 894 to 1. The ratio of registered sex offenders to all residents in this zip code is near the state average.
Median resident age:
This zip code:
48.3 years
Illinois median age:
39.1 years
Average household size:
This zip code:
2.3 people
Illinois:
2.4 people
Averages for the 2020 tax year for zip code 62468, filed in 2021:
Average Adjusted Gross Income (AGI) in 2020: $56,742 (Individual Income Tax Returns)
Here:
$56,742
State:
$82,626
Salary/wage: $47,907 (reported on 83.9% of returns)
Here:
$47,907
State:
$66,640
(% of AGI for various income ranges: 1107.7% for AGIs below $25k, 3290.4% for AGIs $25k-50k, 6280.7% for AGIs $50k-75k, 8572.7% for AGIs $75k-100k, 16453.6% for AGIs $100k-200k)
Taxable interest for individuals: $798 (reported on 33.9% of returns)
This zip code:
$798
Illinois:
$2,376
(% of AGI for various income ranges: 15.8% for AGIs below $25k, 16.0% for AGIs $25k-50k, 39.3% for AGIs $50k-75k, 40.0% for AGIs $75k-100k, 126.4% for AGIs $100k-200k)
Ordinary dividends: $2,605 (reported on 16.1% of returns)
Here:
$2,605
State:
$9,061
(% of AGI for various income ranges: 20.8% for AGIs below $25k, 26.0% for AGIs $25k-50k, 38.6% for AGIs $50k-75k, 75.5% for AGIs $75k-100k, 217.3% for AGIs $100k-200k)
Net capital gain/loss in AGI: +$3,547 (reported on 14.4% of returns)
Here:
+$3,547
State:
+$31,684
(% of AGI for various income ranges: 15.6% for AGIs $25k-50k, 10.0% for AGIs $50k-75k, 31.8% for AGIs $75k-100k, 469.1% for AGIs $100k-200k)
Profit/loss from business: +$7,536 (reported on 11.9% of returns)
Here:
+$7,536
State:
+$12,175
(% of AGI for various income ranges: 98.8% for AGIs below $25k, 63.6% for AGIs $25k-50k, 347.1% for AGIs $50k-75k, 139.1% for AGIs $100k-200k)
Taxable individual retirement arrangement distribution: $11,025 (reported on 10.2% of returns)
62468:
$11,025
Illinois:
$21,613
(% of AGI for various income ranges: 68.8% for AGIs below $25k, 120.4% for AGIs $25k-50k, 122.1% for AGIs $50k-75k, 274.5% for AGIs $75k-100k, 336.4% for AGIs $100k-200k)
Taxes paid: $7,350 (reported on 1.7% of returns)
62468:
$7,350
State:
$8,563
(% of AGI for various income ranges: 58.8% for AGIs $25k-50k)
Earned income credit: $2,206 (reported on 13.6% of returns)
Here:
$2,206
State:
$2,311
(% of AGI for various income ranges: 68.8% for AGIs below $25k, 69.6% for AGIs $25k-50k)
Percentage of individuals using paid preparers for their 2020 taxes: 96.6%
Here:
97%
State:
93%
(% for various income ranges: 94.4% for AGIs below $25k, 96.7% for AGIs $25k-50k, 100.0% for AGIs $50k-75k, 93.3% for AGIs $75k-100k, 100.0% for AGIs $100k-200k)
Averages for the 2012 tax year for zip code 62468, filed in 2013:
Average Adjusted Gross Income (AGI) in 2012: $46,961 (Individual Income Tax Returns)
Here:
$46,961
State:
$68,058
Salary/wage: $36,675 (reported on 84.0% of returns)
Here:
$36,675
State:
$55,396
(% of AGI for various income ranges: 72.4% for AGIs below $25k, 73.7% for AGIs $25k-50k, 72.3% for AGIs $50k-75k, 69.7% for AGIs $75k-100k, 50.4% for AGIs $100k-200k)
Taxable interest for individuals: $1,182 (reported on 37.8% of returns)
This zip code:
$1,182
Illinois:
$1,969
(% of AGI for various income ranges: 1.8% for AGIs below $25k, 1.2% for AGIs $25k-50k, 0.4% for AGIs $50k-75k, 1.0% for AGIs $75k-100k, 0.9% for AGIs $100k-200k)
Ordinary dividends: $2,555 (reported on 16.8% of returns)
Here:
$2,555
State:
$7,786
(% of AGI for various income ranges: 1.2% for AGIs below $25k, 1.0% for AGIs $25k-50k, 0.6% for AGIs $50k-75k, 1.4% for AGIs $75k-100k, 0.7% for AGIs $100k-200k)
Net capital gain/loss in AGI: +$5,277 (reported on 10.9% of returns)
Here:
+$5,277
State:
+$22,183
(% of AGI for various income ranges: 0.6% for AGIs $25k-50k, 0.4% for AGIs $75k-100k, 3.6% for AGIs $100k-200k)
Profit/loss from business: +$7,559 (reported on 14.3% of returns)
Here:
+$7,559
State:
+$12,903
(% of AGI for various income ranges: 5.9% for AGIs below $25k, 4.2% for AGIs $25k-50k, 1.9% for AGIs $50k-75k, 2.3% for AGIs $75k-100k)
Taxable individual retirement arrangement distribution: $7,264 (reported on 9.2% of returns)
62468:
$7,264
Illinois:
$17,929
(% of AGI for various income ranges: 2.7% for AGIs below $25k, 3.3% for AGIs $25k-50k, 2.6% for AGIs $75k-100k)
Total itemized deductions: $16,586 (18% of AGI, reported on 18.5% of returns)
Here:
$16,586
State:
$26,433
Here:
18.5% of AGI
State:
19.2% of AGI
(% of AGI for various income ranges: 6.8% for AGIs below $25k, 5.3% for AGIs $25k-50k, 5.1% for AGIs $50k-75k, 7.7% for AGIs $75k-100k, 7.4% for AGIs $100k-200k)
Charity contributions: $2,707 (reported on 11.8% of returns)
Here:
$2,707
State:
$4,525
(% of AGI for various income ranges: 0.5% for AGIs $25k-50k, 0.6% for AGIs $50k-75k, 1.1% for AGIs $75k-100k, 0.8% for AGIs $100k-200k)
Taxes paid: $6,173 (reported on 18.5% of returns)
62468:
$6,173
State:
$11,968
(% of AGI for various income ranges: 1.2% for AGIs below $25k, 1.2% for AGIs $25k-50k, 1.7% for AGIs $50k-75k, 2.9% for AGIs $75k-100k, 4.0% for AGIs $100k-200k)
Earned income credit: $2,287 (reported on 19.3% of returns)
Here:
$2,287
State:
$2,349
(% of AGI for various income ranges: 5.8% for AGIs below $25k, 1.5% for AGIs $25k-50k)
Percentage of individuals using paid preparers for their 2012 taxes: 63.9%
Here:
64%
State:
57%
(% for various income ranges: 53.1% for AGIs below $25k, 62.1% for AGIs $25k-50k, 73.7% for AGIs $50k-75k, 83.3% for AGIs $75k-100k, 80.0% for AGIs $100k-200k)
Averages for the 2004 tax year for zip code 62468, filed in 2005:
Average Adjusted Gross Income (AGI) in 2004: $32,985 (Individual Income Tax Returns)
Here:
$32,985
State:
$54,625
Salary/wage: $30,229 (reported on 82.9% of returns)
Here:
$30,229
State:
$46,811
(% of AGI for various income ranges: 139.9% for AGIs below $10k, 71.0% for AGIs $10k-25k, 78.2% for AGIs $25k-50k, 80.9% for AGIs $50k-75k, 69.3% for AGIs $75k-100k, 61.3% for AGIs over 100k)
Taxable interest for individuals: $1,274 (reported on 47.5% of returns)
This zip code:
$1,274
Illinois:
$2,101
(% of AGI for various income ranges: 6.5% for AGIs below $10k, 3.9% for AGIs $10k-25k, 1.4% for AGIs $25k-50k, 1.3% for AGIs $50k-75k, 1.7% for AGIs $75k-100k, 1.0% for AGIs over 100k)
Taxable dividends: $1,187 (reported on 21.3% of returns)
Here:
$1,187
State:
$4,306
(% of AGI for various income ranges: 2.3% for AGIs below $10k, 0.7% for AGIs $10k-25k, 0.7% for AGIs $25k-50k, 0.6% for AGIs $50k-75k, 1.2% for AGIs $75k-100k, 0.6% for AGIs over 100k)
Net capital gain/loss: +$738 (reported on 12.3% of returns)
Here:
+$738
State:
+$17,321
(% of AGI for various income ranges: -1.3% for AGIs below $10k, -0.1% for AGIs $10k-25k, 0.5% for AGIs $25k-50k, 0.1% for AGIs $50k-75k, 1.0% for AGIs $75k-100k, 0.0% for AGIs over 100k)
Profit/loss from business: +$3,494 (reported on 13.1% of returns)
Here:
+$3,494
State:
+$11,771
(% of AGI for various income ranges: -6.5% for AGIs below $10k, 4.2% for AGIs $10k-25k, 1.3% for AGIs $25k-50k, -0.0% for AGIs $50k-75k, 3.7% for AGIs $75k-100k)
Profit/loss from farming: +$4,293 (reported on 8.4% of returns)
Here:
+$4,293
State:
+$2,327
(% of AGI for various income ranges: -20.7% for AGIs below $10k, 0.0% for AGIs $25k-50k, 3.8% for AGIs $50k-75k, 2.5% for AGIs $75k-100k)
IRA payment deduction: $3,238 (reported on 1.8% of returns)
62468:
$3,238
Illinois:
$3,087
Total itemized deductions: $14,420 (25% of AGI, reported on 15.4% of returns)
Here:
$14,420
State:
$20,239
Here:
25.1% of AGI
State:
19.5% of AGI
(% of AGI for various income ranges: 7.2% for AGIs $10k-25k, 6.2% for AGIs $25k-50k, 6.5% for AGIs $50k-75k, 8.1% for AGIs $75k-100k, 7.1% for AGIs over 100k)
Charity contributions deductions: $2,652 (4% of AGI, reported on 11.2% of returns)
Here:
$2,652
State:
$3,719
Here:
4.2% of AGI
State:
3.4% of AGI
(% of AGI for various income ranges: 0.5% for AGIs $10k-25k, 0.7% for AGIs $25k-50k, 0.8% for AGIs $50k-75k, 1.5% for AGIs $75k-100k, 1.6% for AGIs over 100k)
Total tax: $3,929 (reported on 73.2% of returns)
62468:
$3,929
State:
$9,882
(% of AGI for various income ranges: 3.9% for AGIs below $10k, 4.2% for AGIs $10k-25k, 6.3% for AGIs $25k-50k, 8.7% for AGIs $50k-75k, 11.7% for AGIs $75k-100k, 17.5% for AGIs over 100k)
Earned income credit: $1,601 (reported on 15.5% of returns)
Here:
$1,601
State:
$1,788
Percentage of individuals using paid preparers for their 2004 taxes: 67.3%
Here:
67%
State:
61%
(% for various income ranges: 54.6% for AGIs below $10k, 71.4% for AGIs $10k-25k, 72.0% for AGIs $25k-50k, 65.4% for AGIs $50k-75k, 77.1% for AGIs $75k-100k, 86.2% for AGIs over 100k)
Household received Food Stamps/SNAP in the past 12 months: 75 Household did not receive Food Stamps/SNAP in the past 12 months: 922
Women who had a birth in the past 12 months: 38 (26 now married, 11 unmarried) Women who did not have a birth in the past 12 months: 340 (191 now married, 146 unmarried)
Housing units in zip code 62468 with a mortgage: 345 (8 second mortgage, 8 both second mortgage and home equity loan) Houses without a mortgage: 4
Median monthly owner costs for units with a mortgage: $1,066 Median monthly owner costs for units without a mortgage: $534
Residents with income below the poverty level in 2022:
This zip code:
13.3%
Whole state:
11.9%
Residents with income below 50% of the poverty level in 2022:
This zip code:
4.8%
Whole state:
5.7%
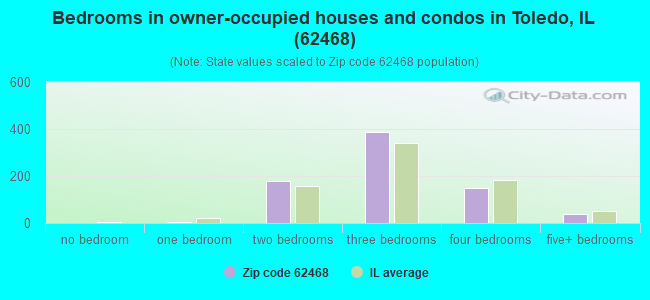
Median number of rooms in houses and condos:
Here:
6.4
State:
6.4
Median number of rooms in apartments:
Here:
4.9
State:
4.1
Notable locations in this zip code not listed on our city pages
Notable locations in zip code 62468: Sumpter Township Library (A), Cumberland County Courthouse (B), Toledo Volunteer Fire Department (C), Toledo Area Emergency Ambulance Service (D). Display/hide their locations on the map
Churches in zip code 62468 include: Bradbury Free Methodist Church (A), Salem Church (B), Calvary Tabernacle (C), First Baptist Church (D). Display/hide their locations on the map
Cemeteries: Bear Creek Cemetery (1), Berry Cemetery (2), Upper Berry Cemetery (3), Friends Grove Cemetery (4), Haggins Cemetery (5), Farmer Cemetery (6), Elliott Cemetery (7). Display/hide their locations on the map
Streams, rivers, and creeks: Muddy Creek (A), Brush Creek (B), Bear Creek (C), Long Point Creek (D), Fulfer Branch (E). Display/hide their locations on the map
In group quarters: 24 (-1 institutionalized population)
Size of family households: 418 2-persons, 130 3-persons, 36 4-persons, 75 5-persons, 8 6-persons
Size of nonfamily households: 257 1-person, 41 2-persons, 36 3-persons
308 married couples with children.
87 single-parent households (27 men, 60 women).
92.0% of residents of 62468 zip code speak English at home.
7.1% of residents speak Spanish at home (34% very well, 44% well, 22% not well).
0.9% of residents speak other Indo-European language at home (100% very well).
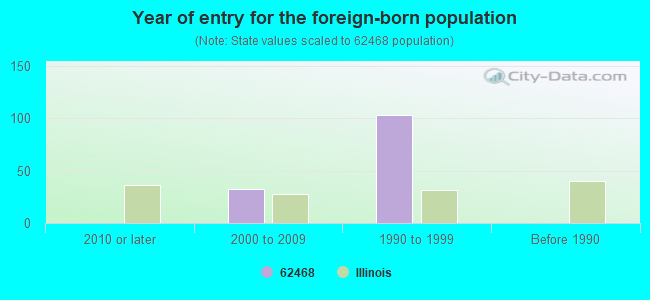
Foreign born population: 141 (6.0%) (37.8% of them are naturalized citizens)
This zip code:
6.0%
Whole state:
14.4%
99%Honduras
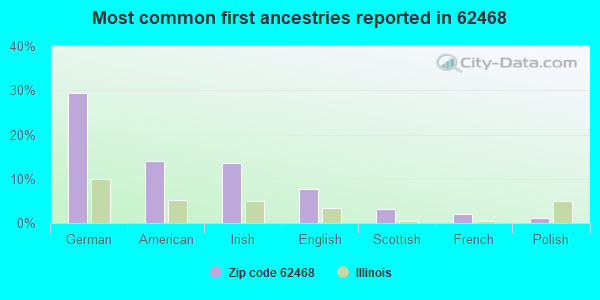
29%German
14%American
14%Irish
8%English
3%Scottish
2%French
1%Polish
Year of entry for the foreign-born population
02010 or later
322000 to 2009
1031990 to 1999
0Before 1990
Facilities with environmental interests located in this zip code:
CUMBERLAND JR HIGH SCHOOL (1496 IL RT 121 in TOLEDO, IL)
(Geographic Names Information System) (National Center for Education Statistics) - STATE ID-1101807701001 (National Center for Education Statistics) - STATE ID-1101807700001 Organizations: CUMBERLAND C U SCHOOL DIST 77 (SCHOOL DISTRICT)
NICHOLS OIL CO (MADISON STREET in TOLEDO, IL)
STATE MASTER (Illinois EPA Project) - AIR PROGRAM AIR MINOR (AIRS/AFS) CRITERIA AND HAZARDOUS AIR POLLUTANT INVENTORY (Inventory of air pollution sources) National Pollutant Discharge Elimination System NON-MAJOR (Tracking pollutant discharge elimination systems) - permit Business SIC classification: PETROLEUM BULK STATIONS AND TERMINALS Organizations: NICHOLS?HARRY E. (CONTACT/OWNER)
PYROFERRIC INTERNATIONAL INC (200 MADISON in TOLEDO, IL)
STATE MASTER (Illinois EPA Project) - SOLID WASTE PROGRAM, HAZARDOUS WASTE PROGRAM, AIR PROGRAM AIR SYNTHETIC MINOR (AIRS/AFS) CRITERIA AND HAZARDOUS AIR POLLUTANT INVENTORY (Inventory of air pollution sources) Large Quantity Generators, more that 1000 kg of hazardous waste/month (Resource Conservation and Recovery Act (tracking hazardous waste)) - notification TRI REPORTER (Tracking of toxic chemicals releasing facilities) Business SIC classification: ELECTRONIC COMPONENTS
CUMBERLAND GRADE&HIGH SCHOOL77 (RURAL ROUTE 1, BOX 182 in TOLEDO, IL)
STATE MASTER (Illinois EPA Project) - National Pollutant Discharge Elimination System Permit National Pollutant Discharge Elimination System NON-MAJOR (Tracking pollutant discharge elimination systems) - permit National Pollutant Discharge Elimination System NON-MAJOR (Tracking pollutant discharge elimination systems) - permit Business SIC classification: ELEMENTARY AND SECONDARY SCHOOLS Alternative names: COMM UNIT SCHOOL DIST #77, CUMBERLAND COMM SCH DIST 77, CUMBERLAND UNIT DIST #77
CUMBERLAND ELEM SCHOOL (1496 IL RT 121 in TOLEDO, IL)
(National Center for Education Statistics) - STATE ID-1101807702003 Organizations: CUMBERLAND C U SCHOOL DIST 77 (SCHOOL DISTRICT)
CUTTS HAROLD (2 MI NE OF TOLEDO IN SEC 21 in TOLEDO, IL)
(Resource Conservation and Recovery Act (tracking hazardous waste))
IDOT (BRG 018 -0018 SEC 111BR in TOLEDO, IL)
Conditionally Exempt Small Quantity Generators, less than 100 kg/month of hazardous waste (Resource Conservation and Recovery Act (tracking hazardous waste)) - notification
GRANTS FERTILIZER SERVICE (404 E JEFFERSON in TOLEDO, IL)
COMPLIANCE ACTIVITY (Tracking inspections of insecticide, fungicide, and rodenticide, and toxic substances)
Housing units lacking complete plumbing facilities: 0.6% Housing units lacking complete kitchen facilities: 1.6%
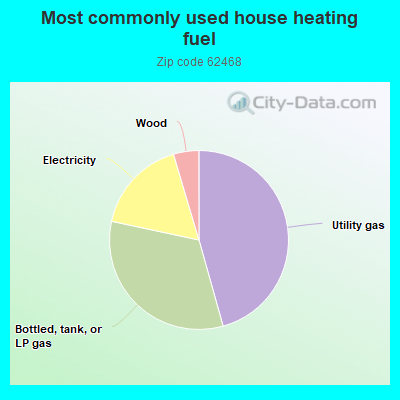
45.8%Utility gas
32.8%Bottled, tank, or LP gas
17.1%Electricity
4.6%Wood
Population in 1990: 2,046. Population change in the 1990s: +422 (+20.6%).
Place of birth for U.S.-born residents:
This state: 1,975
Northeast: 31
Midwest: 50
South: 92
West: 31
60% of the 62468 zip code residents lived in the same house 5 years ago. Out of people who lived in different houses, 59% lived in this county. Out of people who lived in different counties, 50% lived in Illinois.
92% of the 62468 zip code residents lived in the same house 1 year ago. Out of people who lived in different houses, 34% moved from this county. Out of people who lived in different houses, 42% moved from different county within same state. Out of people who lived in different houses, 26% moved from different state.
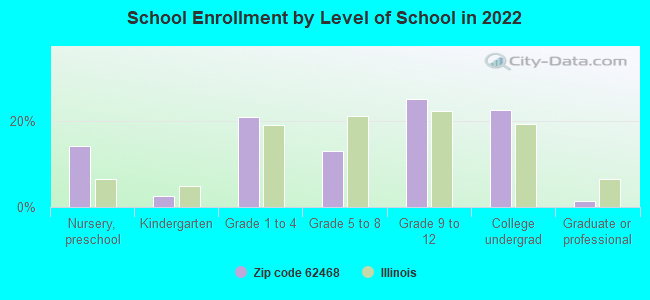
Private vs. public school enrollment:
Students in private schools in grades 1 to 8 (elementary and middle school): 16
Here:
12.1%
Illinois:
13.3%
Students in private schools in grades 9 to 12 (high school):
Here:
0.0%
Illinois:
9.9%
Students in private undergraduate colleges: 5
Here:
6.1%
Illinois:
27.4%
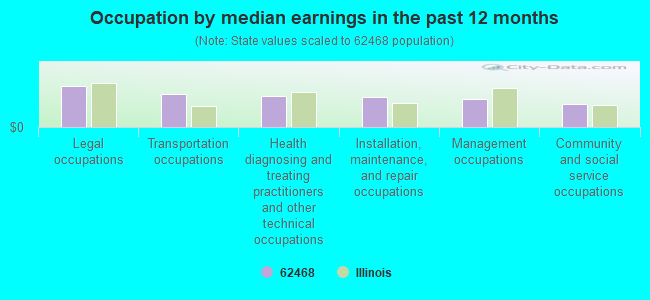
Occupation by median earnings in the past 12 months ($)
100,647Legal occupations
80,880Transportation occupations
75,396Health diagnosing and treating practitioners and other technical occupations
73,885Installation, maintenance, and repair occupations
67,497Management occupations
56,937Community and social service occupations
Companies with federal contracts located in this zip code:
WILLIAM MORAN (993 COUNTY ROAD 500 E in TOLEDO, IL; small business)
$5,682 with Army for Trailers. Signed on 2004-09-15. Completion date: 2004-09-30.
Top industries in this zip code by the number of employees in 2005:
Finance and Insurance: Commercial Banking (20-49 employees: 1 establishment)
Wholesale Trade: Automobile and Other Motor Vehicle Merchant Wholesalers (10-19: 1)
Wholesale Trade: Grain and Field Bean Merchant Wholesalers (10-19: 1)
Health Care and Social Assistance: Services for the Elderly and Persons with Disabilities (10-19: 1)
Health Care and Social Assistance: Outpatient Mental Health and Substance Abuse Centers (10-19: 1)
Health Care and Social Assistance: Ambulance Services (10-19: 1)
Accommodation and Food Services: Full-Service Restaurants (10-19: 1)
Wholesale Trade: Tire and Tube Merchant Wholesalers (10-19: 1)
People in group quarters in 2010:
5 people in local jails and other municipal confinement facilities
People in group quarters in 2000:
11 people in local jails and other confinement facilities (including police lockups)
Fatal accident statistics in 2010:
Fatal accident count: 1
Vehicles involved in fatal accidents: 1
Fatal accidents caused by drunken drivers: 0
Fatalities: 1
Persons involved in fatal accidents: 1
Pedestrians involved in fatal accidents: 0
2002 - 2018 National Fire Incident Reporting System (NFIRS) incidents
Based on the data from the years 2002 - 2018 the average number of fire incidents per year is 11. The highest number of fire incidents - 32 took place in 2012, and the least - 0 in 2008. The data has a growing trend.
When looking into fire subcategories, the most incidents belonged to: Structure Fires (53.8%), and Outside Fires (26.1%).
Fire incident types reported to NFIRS in Zip Code 62468

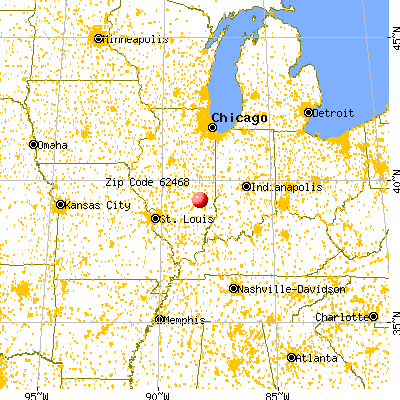


 Nearest zip codes: 62469, 62436, 62440, 62445, 62428, 62447.


 Based on the data from the years 2002 - 2018 the average number of fire incidents per year is 11. The highest number of fire incidents - 32 took place in 2012, and the least - 0 in 2008. The data has a growing trend.
 When looking into fire subcategories, the most incidents belonged to: Structure Fires (53.8%), and Outside Fires (26.1%).