Estimated zip code population in 2022: 1,865 Zip code population in 2010: 1,792 Zip code population in 2000: 1,955
Houses and condos: 777 Renter-occupied apartments: 123
% of renters here:
17%
State:
33%
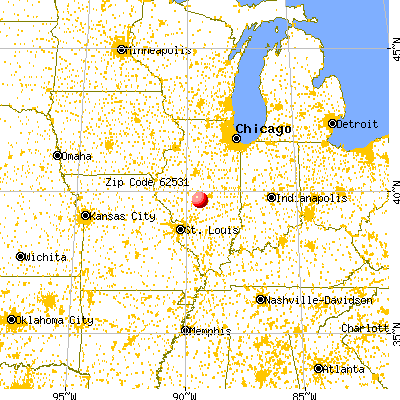
March 2022 cost of living index in zip code 62531: 83.8 (less than average, U.S. average is 100)
Land area: 60.4 sq. mi. Water area: 0.2 sq. mi.
Population density: 31 people per square mile
(very low).
OSM Map
General Map
Google Map
MSN Map
OSM Map
General Map
Google Map
MSN Map
OSM Map
General Map
Google Map
MSN Map
OSM Map
General Map
Google Map
MSN Map
Please wait while loading the map...
Real estate property taxes paid for housing units in 2022:
This zip code:
1.4% ($1,866)
Illinois:
2.0% ($4,912)
Median real estate property taxes paid for housing units with mortgages in 2022: $1,815 (1.4%) Median real estate property taxes paid for housing units with no mortgage in 2022: $2,019 (1.6%)
Business Search- 14 Million verified businesses
Males: 1,040
(55.8%)
Females: 825
(44.2%)
For population 25 years and over in 62531:
High school or higher: 92.3%
Bachelor's degree or higher: 16.2%
Graduate or professional degree: 2.9%
Unemployed: 2.1%
Mean travel time to work (commute): 24.5 minutes
For population 15 years and over in 62531:
Never married: 30.2%
Now married: 51.6%
Separated: 0.4%
Widowed: 5.6%
Divorced: 12.1%
Zip code 62531 compared to state average:
Median house value below state average.
Unemployed percentage below state average.
Black race population percentage significantly below state average.
Hispanic race population percentage significantly below state average.
Median age above state average.
Foreign-born population percentage significantly below state average.
Renting percentage below state average.
Length of stay since moving in significantly above state average.
Percentage of population with a bachelor's degree or higher below state average.
Estimated median house/condo value in 2022: $129,957
62531:
$129,957
Illinois:
$251,600
According to our research of Illinois and other state lists, there were 3 registered sex offenders living in 62531 zip code as of May 29, 2024. The ratio of all residents to sex offenders in zip code 62531 is 662 to 1. The ratio of registered sex offenders to all residents in this zip code is near the state average.
Median resident age:
This zip code:
43.1 years
Illinois median age:
39.1 years
Average household size:
This zip code:
2.6 people
Illinois:
2.4 people
Averages for the 2020 tax year for zip code 62531, filed in 2021:
Average Adjusted Gross Income (AGI) in 2020: $63,008 (Individual Income Tax Returns)
Here:
$63,008
State:
$82,626
Salary/wage: $53,156 (reported on 75.3% of returns)
Here:
$53,156
State:
$66,640
(% of AGI for various income ranges: 1160.0% for AGIs below $25k, 3240.6% for AGIs $25k-50k, 6471.0% for AGIs $50k-75k, 8518.6% for AGIs $75k-100k, 14893.0% for AGIs $100k-200k)
Taxable interest for individuals: $609 (reported on 40.0% of returns)
This zip code:
$609
Illinois:
$2,376
(% of AGI for various income ranges: 16.9% for AGIs below $25k, 33.1% for AGIs $25k-50k, 22.0% for AGIs $50k-75k, 44.3% for AGIs $75k-100k, 79.0% for AGIs $100k-200k)
Ordinary dividends: $2,144 (reported on 18.8% of returns)
Here:
$2,144
State:
$9,061
(% of AGI for various income ranges: 5.4% for AGIs below $25k, 11.9% for AGIs $25k-50k, 34.0% for AGIs $50k-75k, 61.4% for AGIs $75k-100k, 240.0% for AGIs $100k-200k)
Net capital gain/loss in AGI: +$1,592 (reported on 14.1% of returns)
Here:
+$1,592
State:
+$31,684
(% of AGI for various income ranges: 21.5% for AGIs below $25k, 96.0% for AGIs $50k-75k, 67.0% for AGIs $100k-200k)
Profit/loss from business: +$10,244 (reported on 10.6% of returns)
Here:
+$10,244
State:
+$12,175
(% of AGI for various income ranges: 117.7% for AGIs below $25k, 202.0% for AGIs $50k-75k, 567.0% for AGIs $100k-200k)
Taxable individual retirement arrangement distribution: $13,043 (reported on 8.2% of returns)
62531:
$13,043
Illinois:
$21,613
(% of AGI for various income ranges: 267.5% for AGIs $25k-50k, 692.9% for AGIs $75k-100k)
Taxes paid: $8,500 (reported on 2.4% of returns)
62531:
$8,500
State:
$8,563
(% of AGI for various income ranges: 170.0% for AGIs $50k-75k)
Earned income credit: $2,322 (reported on 10.6% of returns)
Here:
$2,322
State:
$2,311
(% of AGI for various income ranges: 84.6% for AGIs below $25k, 61.9% for AGIs $25k-50k)
Percentage of individuals using paid preparers for their 2020 taxes: 94.1%
Here:
94%
State:
93%
(% for various income ranges: 95.2% for AGIs below $25k, 95.0% for AGIs $25k-50k, 93.8% for AGIs $50k-75k, 90.0% for AGIs $75k-100k, 94.4% for AGIs $100k-200k)
Averages for the 2012 tax year for zip code 62531, filed in 2013:
Average Adjusted Gross Income (AGI) in 2012: $56,401 (Individual Income Tax Returns)
Here:
$56,401
State:
$68,058
Salary/wage: $43,032 (reported on 83.0% of returns)
Here:
$43,032
State:
$55,396
(% of AGI for various income ranges: 70.6% for AGIs below $25k, 76.4% for AGIs $25k-50k, 69.4% for AGIs $50k-75k, 72.9% for AGIs $75k-100k, 48.6% for AGIs $100k-200k)
Taxable interest for individuals: $1,058 (reported on 40.9% of returns)
This zip code:
$1,058
Illinois:
$1,969
(% of AGI for various income ranges: 0.9% for AGIs below $25k, 0.5% for AGIs $25k-50k, 0.3% for AGIs $50k-75k, 0.7% for AGIs $75k-100k, 1.1% for AGIs $100k-200k)
Ordinary dividends: $1,332 (reported on 21.6% of returns)
Here:
$1,332
State:
$7,786
(% of AGI for various income ranges: 0.7% for AGIs below $25k, 0.1% for AGIs $25k-50k, 0.9% for AGIs $50k-75k, 0.5% for AGIs $75k-100k, 0.4% for AGIs $100k-200k)
Net capital gain/loss in AGI: +$2,736 (reported on 12.5% of returns)
Here:
+$2,736
State:
+$22,183
(% of AGI for various income ranges: 0.9% for AGIs $75k-100k, 1.2% for AGIs $100k-200k)
Profit/loss from business: +$5,536 (reported on 15.9% of returns)
Here:
+$5,536
State:
+$12,903
(% of AGI for various income ranges: 3.5% for AGIs below $25k, 1.0% for AGIs $25k-50k, 3.0% for AGIs $50k-75k, 1.5% for AGIs $100k-200k)
Taxable individual retirement arrangement distribution: $9,075 (reported on 9.1% of returns)
62531:
$9,075
Illinois:
$17,929
(% of AGI for various income ranges: 5.6% for AGIs below $25k, 3.0% for AGIs $50k-75k, 1.3% for AGIs $100k-200k)
Total itemized deductions: $17,789 (18% of AGI, reported on 20.5% of returns)
Here:
$17,789
State:
$26,433
Here:
17.6% of AGI
State:
19.2% of AGI
(% of AGI for various income ranges: 9.8% for AGIs $25k-50k, 4.9% for AGIs $50k-75k, 6.7% for AGIs $75k-100k, 6.9% for AGIs $100k-200k)
Charity contributions: $3,892 (reported on 13.6% of returns)
Here:
$3,892
State:
$4,525
(% of AGI for various income ranges: 1.3% for AGIs $25k-50k, 1.0% for AGIs $75k-100k, 1.4% for AGIs $100k-200k)
Taxes paid: $6,583 (reported on 20.5% of returns)
62531:
$6,583
State:
$11,968
(% of AGI for various income ranges: 2.0% for AGIs $25k-50k, 1.5% for AGIs $50k-75k, 2.4% for AGIs $75k-100k, 3.4% for AGIs $100k-200k)
Earned income credit: $2,060 (reported on 11.4% of returns)
Here:
$2,060
State:
$2,349
(% of AGI for various income ranges: 4.2% for AGIs below $25k, 0.9% for AGIs $25k-50k)
Percentage of individuals using paid preparers for their 2012 taxes: 70.5%
Here:
70%
State:
57%
(% for various income ranges: 60.7% for AGIs below $25k, 70.0% for AGIs $25k-50k, 75.0% for AGIs $50k-75k, 75.0% for AGIs $75k-100k, 83.3% for AGIs $100k-200k)
Averages for the 2004 tax year for zip code 62531, filed in 2005:
Average Adjusted Gross Income (AGI) in 2004: $41,256 (Individual Income Tax Returns)
Here:
$41,256
State:
$54,625
Salary/wage: $34,961 (reported on 84.1% of returns)
Here:
$34,961
State:
$46,811
(% of AGI for various income ranges: 89.1% for AGIs below $10k, 76.4% for AGIs $10k-25k, 75.8% for AGIs $25k-50k, 71.7% for AGIs $50k-75k, 76.3% for AGIs $75k-100k, 53.7% for AGIs over 100k)
Taxable interest for individuals: $1,040 (reported on 48.3% of returns)
This zip code:
$1,040
Illinois:
$2,101
(% of AGI for various income ranges: 4.8% for AGIs below $10k, 2.6% for AGIs $10k-25k, 1.4% for AGIs $25k-50k, 0.8% for AGIs $50k-75k, 0.6% for AGIs $75k-100k, 1.2% for AGIs over 100k)
Taxable dividends: $800 (reported on 25.6% of returns)
Here:
$800
State:
$4,306
(% of AGI for various income ranges: 0.6% for AGIs below $10k, 0.7% for AGIs $10k-25k, 0.7% for AGIs $25k-50k, 0.3% for AGIs $50k-75k, 0.4% for AGIs $75k-100k, 0.6% for AGIs over 100k)
Net capital gain/loss: +$2,890 (reported on 14.5% of returns)
Here:
+$2,890
State:
+$17,321
(% of AGI for various income ranges: 1.2% for AGIs below $10k, 0.0% for AGIs $10k-25k, -0.1% for AGIs $25k-50k, 0.1% for AGIs $50k-75k, 1.3% for AGIs $75k-100k, 4.4% for AGIs over 100k)
Profit/loss from business: +$5,984 (reported on 13.9% of returns)
Here:
+$5,984
State:
+$11,771
(% of AGI for various income ranges: 7.9% for AGIs below $10k, -1.0% for AGIs $10k-25k, 2.6% for AGIs $25k-50k, 2.3% for AGIs $50k-75k, 3.9% for AGIs over 100k)
Profit/loss from farming: +$5,146 (reported on 4.7% of returns)
Here:
+$5,146
State:
+$2,327
IRA payment deduction: $2,750 (reported on 2.3% of returns)
62531:
$2,750
Illinois:
$3,087
Total itemized deductions: $12,788 (19% of AGI, reported on 19.4% of returns)
Here:
$12,788
State:
$20,239
Here:
19.5% of AGI
State:
19.5% of AGI
(% of AGI for various income ranges: 4.5% for AGIs $10k-25k, 4.9% for AGIs $25k-50k, 6.8% for AGIs $50k-75k, 7.9% for AGIs $75k-100k, 5.6% for AGIs over 100k)
Charity contributions deductions: $2,576 (4% of AGI, reported on 15.0% of returns)
Here:
$2,576
State:
$3,719
Here:
3.8% of AGI
State:
3.4% of AGI
(% of AGI for various income ranges: 1.6% for AGIs below $10k, 0.7% for AGIs $25k-50k, 1.0% for AGIs $50k-75k, 1.6% for AGIs $75k-100k, 1.0% for AGIs over 100k)
Total tax: $5,296 (reported on 78.9% of returns)
62531:
$5,296
State:
$9,882
(% of AGI for various income ranges: 2.0% for AGIs below $10k, 4.3% for AGIs $10k-25k, 7.4% for AGIs $25k-50k, 9.4% for AGIs $50k-75k, 11.4% for AGIs $75k-100k, 17.8% for AGIs over 100k)
Earned income credit: $1,541 (reported on 13.9% of returns)
Here:
$1,541
State:
$1,788
Percentage of individuals using paid preparers for their 2004 taxes: 66.3%
Here:
66%
State:
61%
(% for various income ranges: 57.3% for AGIs below $10k, 66.0% for AGIs $10k-25k, 66.0% for AGIs $25k-50k, 72.3% for AGIs $50k-75k, 65.4% for AGIs $75k-100k, 77.8% for AGIs over 100k)
Household received Food Stamps/SNAP in the past 12 months: 61 Household did not receive Food Stamps/SNAP in the past 12 months: 639
Women who had a birth in the past 12 months: 21 (14 now married, 6 unmarried) Women who did not have a birth in the past 12 months: 332 (151 now married, 180 unmarried)
Housing units in zip code 62531 with a mortgage: 338 (7 second mortgage, 2 both second mortgage and home equity loan) Houses without a mortgage: 9
Median monthly owner costs for units with a mortgage: $1,038 Median monthly owner costs for units without a mortgage: $589
Residents with income below the poverty level in 2022:
This zip code:
9.7%
Whole state:
11.9%
Residents with income below 50% of the poverty level in 2022:
This zip code:
4.4%
Whole state:
5.7%
Median number of rooms in houses and condos:
Here:
6.1
State:
6.4
Median number of rooms in apartments:
Here:
4.3
State:
4.1
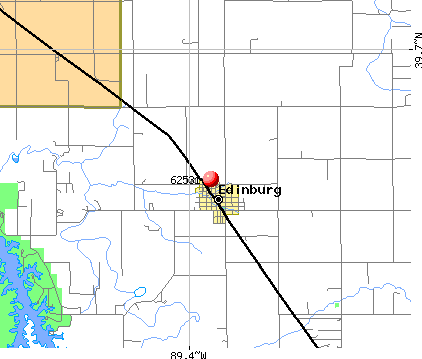
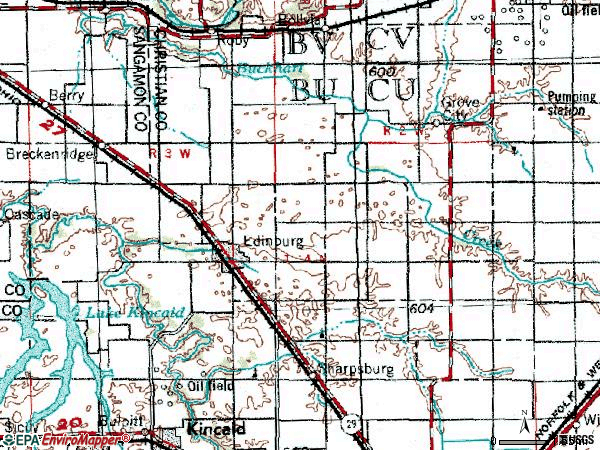
Notable locations in this zip code not listed on our city pages
Cemeteries: Bethany Cemetery (1), Buckhart Dutch Reform Cemetery (2), Grove City Methodist Cemetery (3), Edinburg Cemetery (4). Display/hide their locations on the map
212 married couples with children.
52 single-parent households (19 men, 33 women).
98.4% of residents of 62531 zip code speak English at home.
0.8% of residents speak Spanish at home (60% very well, 40% well).
Foreign born population: 0 (0.0%)
:
0.0%
Whole state:
14.4%
36%English
32%American
20%German
7%Italian
3%Irish
1%Polish
0%Dutch
Year of entry for the foreign-born population
02010 or later
02000 to 2009
01990 to 1999
7Before 1990
Facilities with environmental interests located in this zip code:
MECHANICSBURG FARMERS GRAIN CO (DOUGLAS AND DECAMP in EDINBURG, IL)
STATE MASTER (Illinois EPA Project) - AIR PROGRAM AIR MINOR (AIRS/AFS) CRITERIA AND HAZARDOUS AIR POLLUTANT INVENTORY (Inventory of air pollution sources) Business SIC classification: GRAIN AND FIELD BEANS
POWDER PUFF FARM (RR 2 in EDINBURG, IL)
STATE MASTER (Illinois EPA Project) - SOLID WASTE PROGRAM, HAZARDOUS WASTE PROGRAM (Resource Conservation and Recovery Act (tracking hazardous waste))
LEONARD J PEACOCK (BOX 187 in EDINBURG, IL)
STATE MASTER (Illinois EPA Project) - AIR PROGRAM AIR MINOR (AIRS/AFS) Business SIC classification: PRIVATE HOUSEHOLDS
PANHANDLE EASTERN SPRINGFIELD (2500 N TO 1500 E TURN LEFT in SPRINGFIELD, IL)
(Resource Conservation and Recovery Act (tracking hazardous waste)) Organizations: PANHANDLE EASTERN GAS PIPELINE (CONTACT/OWNER)
PANHANDLE EASTERN SPRINGFIELD (2300 N TO 800 E 200 YDS in SPRINGFIELD, IL)
(Resource Conservation and Recovery Act (tracking hazardous waste)) Organizations: PANHANDLE EASTERN GAS PIPELINE (CONTACT/OWNER)
Housing units lacking complete plumbing facilities: 2.2% Housing units lacking complete kitchen facilities: 2.6%
56.8%Utility gas
29.2%Bottled, tank, or LP gas
13.0%Electricity
0.7%No fuel used
0.6%Fuel oil, kerosene, etc.
Population in 1990: 1,925. Population change in the 1990s: +30 (+1.6%).
Place of birth for U.S.-born residents:
This state: 1,675
Northeast: 6
Midwest: 48
South: 40
West: 79
65% of the 62531 zip code residents lived in the same house 5 years ago. Out of people who lived in different houses, 55% lived in this county. Out of people who lived in different counties, 50% lived in Illinois.
97% of the 62531 zip code residents lived in the same house 1 year ago. Out of people who lived in different houses, 76% moved from this county. Out of people who lived in different houses, 20% moved from different county within same state.
Private vs. public school enrollment:
Students in private schools in grades 1 to 8 (elementary and middle school): 37
Here:
28.8%
Illinois:
13.3%
Students in private schools in grades 9 to 12 (high school): 6
Here:
5.3%
Illinois:
9.9%
Students in private undergraduate colleges: 6
Here:
11.4%
Illinois:
27.4%
Occupation by median earnings in the past 12 months ($)
86,861Law enforcement workers including supervisors
62,931Health diagnosing and treating practitioners and other technical occupations
56,568Business and financial operations occupations
54,510Construction and extraction occupations
51,602Installation, maintenance, and repair occupations
50,562Computer and mathematical occupations
Top industries in this zip code by the number of employees in 2005:
Wholesale Trade: Plumbing and Heating Equipment and Supplies (Hydronics) Merchant Wholesalers (20-49 employees: 1 establishment)
Accommodation and Food Services: Limited-Service Restaurants (10-19: 1)
Construction: Plumbing, Heating, and Air-Conditioning Contractors (5-9: 1, 1-4: 3)
Construction: Siding Contractors (5-9: 1)
Finance and Insurance: Commercial Banking (5-9: 1)
Other Services (except Public Administration): Cemeteries and Crematories (5-9: 1)
Construction: Electrical Contractors (5-9: 1)
Fatal accident statistics in 2014:
Fatal accident count: 1
Vehicles involved in fatal accidents: 2
Fatal accidents caused by drunken drivers: 0
Fatalities: 1
Persons involved in fatal accidents: 2
Pedestrians involved in fatal accidents: 0
Fatal accident statistics in 2013:
Fatal accident count: 1
Vehicles involved in fatal accidents: 2
Fatal accidents caused by drunken drivers: 1
Fatalities: 1
Persons involved in fatal accidents: 3
Pedestrians involved in fatal accidents: 0
2002 - 2018 National Fire Incident Reporting System (NFIRS) incidents
According to the data from the years 2002 - 2018 the average number of fire incidents per year is 13. The highest number of fire incidents - 23 took place in 2012, and the least - 2 in 2006. The data has a growing trend.
When looking into fire subcategories, the most reports belonged to: Outside Fires (44.4%), and Structure Fires (34.2%).
Fire incident types reported to NFIRS in Zip Code 62531


 Nearest zip codes: 62545, 62517, 62540, 62570, 62563, 62568.


 According to the data from the years 2002 - 2018 the average number of fire incidents per year is 13. The highest number of fire incidents - 23 took place in 2012, and the least - 2 in 2006. The data has a growing trend.
 When looking into fire subcategories, the most reports belonged to: Outside Fires (44.4%), and Structure Fires (34.2%).