Estimated zip code population in 2022: 1,135 Zip code population in 2010: 1,358 Zip code population in 2000: 1,367
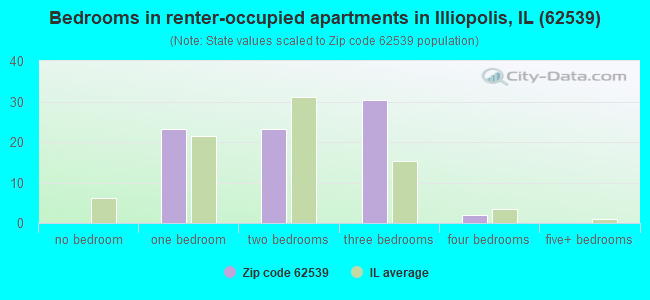
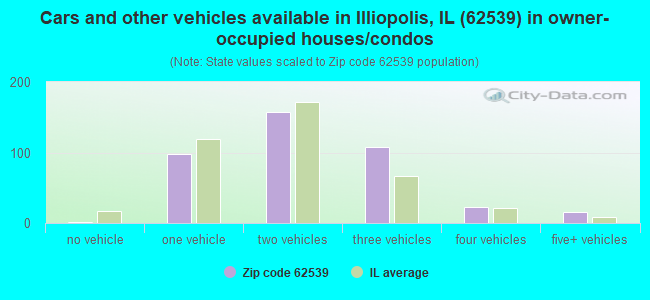
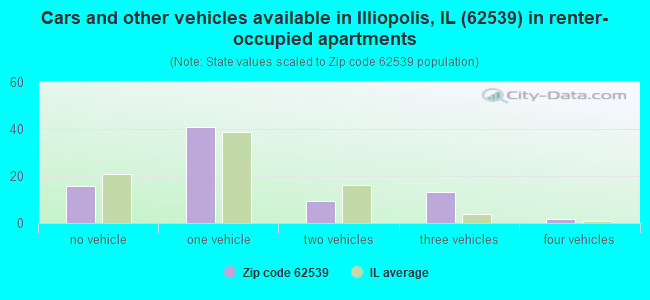
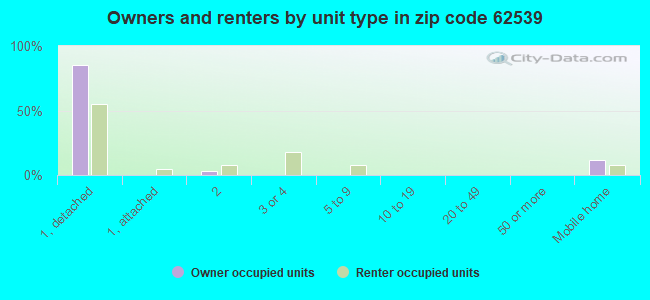
Houses and condos: 524 Renter-occupied apartments: 80
% of renters here:
17%
State:
33%
March 2022 cost of living index in zip code 62539: 83.3 (less than average, U.S. average is 100)
Land area: 46.6 sq. mi. Water area: 0.0 sq. mi.
Population density: 24 people per square mile
(very low).
OSM Map
General Map
Google Map
MSN Map
OSM Map
General Map
Google Map
MSN Map
OSM Map
General Map
Google Map
MSN Map
OSM Map
General Map
Google Map
MSN Map
Please wait while loading the map...
Real estate property taxes paid for housing units in 2022:
This zip code:
1.6% ($1,651)
Illinois:
2.0% ($4,912)
Median real estate property taxes paid for housing units with mortgages in 2022: $1,837 (1.7%) Median real estate property taxes paid for housing units with no mortgage in 2022: $1,518 (1.5%)
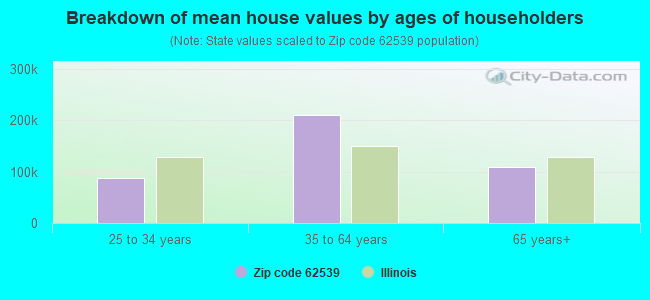
Estimated median house/condo value in 2022: $102,071
62539:
$102,071
Illinois:
$251,600
According to our research of Illinois and other state lists, there was 1 registered sex offender living in 62539 zip code as of May 29, 2024. The ratio of all residents to sex offenders in zip code 62539 is 1,368 to 1. The ratio of registered sex offenders to all residents in this zip code is lower than the state average.
Median resident age:
This zip code:
42.8 years
Illinois median age:
39.1 years
Average household size:
This zip code:
2.3 people
Illinois:
2.4 people
Averages for the 2020 tax year for zip code 62539, filed in 2021:
Average Adjusted Gross Income (AGI) in 2020: $61,794 (Individual Income Tax Returns)
Here:
$61,794
State:
$82,626
Salary/wage: $48,235 (reported on 83.9% of returns)
Here:
$48,235
State:
$66,640
(% of AGI for various income ranges: 1228.5% for AGIs below $25k, 3431.5% for AGIs $25k-50k, 5940.0% for AGIs $50k-75k, 9211.7% for AGIs $75k-100k, 16555.0% for AGIs $100k-200k)
Taxable interest for individuals: $571 (reported on 38.7% of returns)
This zip code:
$571
Illinois:
$2,376
(% of AGI for various income ranges: 3.8% for AGIs below $25k, 26.9% for AGIs $25k-50k, 33.3% for AGIs $50k-75k, 15.0% for AGIs $75k-100k, 113.3% for AGIs $100k-200k)
Ordinary dividends: $2,100 (reported on 16.1% of returns)
Here:
$2,100
State:
$9,061
(% of AGI for various income ranges: 21.5% for AGIs below $25k, 101.7% for AGIs $50k-75k, 201.7% for AGIs $100k-200k)
Net capital gain/loss in AGI: +$1,675 (reported on 12.9% of returns)
Here:
+$1,675
State:
+$31,684
(% of AGI for various income ranges: 6.9% for AGIs below $25k, 101.7% for AGIs $50k-75k, 106.7% for AGIs $100k-200k)
Profit/loss from business: +$4,067 (reported on 9.7% of returns)
Here:
+$4,067
State:
+$12,175
(% of AGI for various income ranges: 86.2% for AGIs $25k-50k, 220.0% for AGIs $75k-100k)
Taxable individual retirement arrangement distribution: $13,850 (reported on 9.7% of returns)
62539:
$13,850
Illinois:
$21,613
(% of AGI for various income ranges: 273.1% for AGIs $25k-50k, 793.3% for AGIs $75k-100k)
Earned income credit: $2,443 (reported on 11.3% of returns)
Here:
$2,443
State:
$2,311
(% of AGI for various income ranges: 71.5% for AGIs below $25k, 60.0% for AGIs $25k-50k)
Percentage of individuals using paid preparers for their 2020 taxes: 93.5%
Here:
94%
State:
93%
(% for various income ranges: 94.1% for AGIs below $25k, 93.8% for AGIs $25k-50k, 88.9% for AGIs $50k-75k, 88.9% for AGIs $75k-100k, 100.0% for AGIs $100k-200k)
Averages for the 2012 tax year for zip code 62539, filed in 2013:
Average Adjusted Gross Income (AGI) in 2012: $53,630 (Individual Income Tax Returns)
Here:
$53,630
State:
$68,058
Salary/wage: $41,795 (reported on 87.3% of returns)
Here:
$41,795
State:
$55,396
(% of AGI for various income ranges: 79.7% for AGIs below $25k, 72.4% for AGIs $25k-50k, 73.1% for AGIs $50k-75k, 79.0% for AGIs $75k-100k, 52.8% for AGIs $100k-200k)
Taxable interest for individuals: $716 (reported on 39.7% of returns)
This zip code:
$716
Illinois:
$1,969
(% of AGI for various income ranges: 1.0% for AGIs below $25k, 0.7% for AGIs $25k-50k, 0.3% for AGIs $50k-75k, 0.3% for AGIs $75k-100k, 0.7% for AGIs $100k-200k)
Ordinary dividends: $1,325 (reported on 19.0% of returns)
Here:
$1,325
State:
$7,786
(% of AGI for various income ranges: 1.8% for AGIs below $25k, 0.5% for AGIs $50k-75k, 0.4% for AGIs $75k-100k, 0.4% for AGIs $100k-200k)
Net capital gain/loss in AGI: +$12 (reported on 12.7% of returns)
Here:
+$12
State:
+$22,183
Profit/loss from business: +$6,917 (reported on 9.5% of returns)
Here:
+$6,917
State:
+$12,903
Taxable individual retirement arrangement distribution: $10,129 (reported on 11.1% of returns)
62539:
$10,129
Illinois:
$17,929
Total itemized deductions: $18,445 (17% of AGI, reported on 17.5% of returns)
Here:
$18,445
State:
$26,433
Here:
16.9% of AGI
State:
19.2% of AGI
(% of AGI for various income ranges: 11.7% for AGIs below $25k, 4.6% for AGIs $50k-75k, 4.9% for AGIs $75k-100k, 8.9% for AGIs $100k-200k)
Charity contributions: $3,217 (reported on 9.5% of returns)
Here:
$3,217
State:
$4,525
Taxes paid: $7,845 (reported on 17.5% of returns)
62539:
$7,845
State:
$11,968
(% of AGI for various income ranges: 2.3% for AGIs below $25k, 1.6% for AGIs $50k-75k, 2.2% for AGIs $75k-100k, 4.6% for AGIs $100k-200k)
Earned income credit: $1,967 (reported on 14.3% of returns)
Here:
$1,967
State:
$2,349
(% of AGI for various income ranges: 4.3% for AGIs below $25k, 1.3% for AGIs $25k-50k)
Percentage of individuals using paid preparers for their 2012 taxes: 55.6%
Here:
56%
State:
57%
(% for various income ranges: 47.8% for AGIs below $25k, 61.5% for AGIs $25k-50k, 58.3% for AGIs $50k-75k, 62.5% for AGIs $75k-100k, 57.1% for AGIs $100k-200k)
Averages for the 2004 tax year for zip code 62539, filed in 2005:
Average Adjusted Gross Income (AGI) in 2004: $41,814 (Individual Income Tax Returns)
Here:
$41,814
State:
$54,625
Salary/wage: $34,515 (reported on 85.9% of returns)
Here:
$34,515
State:
$46,811
(% of AGI for various income ranges: 78.8% for AGIs below $10k, 78.2% for AGIs $10k-25k, 76.9% for AGIs $25k-50k, 75.6% for AGIs $50k-75k, 77.3% for AGIs $75k-100k, 47.5% for AGIs over 100k)
Taxable interest for individuals: $715 (reported on 52.1% of returns)
This zip code:
$715
Illinois:
$2,101
(% of AGI for various income ranges: 2.3% for AGIs below $10k, 1.6% for AGIs $10k-25k, 1.1% for AGIs $25k-50k, 0.3% for AGIs $50k-75k, 0.3% for AGIs $75k-100k, 1.5% for AGIs over 100k)
Taxable dividends: $2,019 (reported on 25.0% of returns)
Here:
$2,019
State:
$4,306
(% of AGI for various income ranges: 0.6% for AGIs below $10k, 0.8% for AGIs $10k-25k, 1.1% for AGIs $25k-50k, 0.6% for AGIs $50k-75k, 0.4% for AGIs $75k-100k, 3.2% for AGIs over 100k)
Net capital gain/loss: +$1,696 (reported on 14.5% of returns)
Here:
+$1,696
State:
+$17,321
(% of AGI for various income ranges: 3.1% for AGIs below $10k, 0.2% for AGIs $25k-50k, 0.1% for AGIs $50k-75k, 0.1% for AGIs $75k-100k, 2.2% for AGIs over 100k)
Profit/loss from business: +$4,153 (reported on 11.4% of returns)
Here:
+$4,153
State:
+$11,771
(% of AGI for various income ranges: 6.7% for AGIs below $10k, 3.3% for AGIs $25k-50k, 0.6% for AGIs $50k-75k, 0.4% for AGIs $75k-100k)
Profit/loss from farming: +$29,414 (reported on 4.6% of returns)
Here:
+$29,414
State:
+$2,327
IRA payment deduction: $2,000 (reported on 1.6% of returns)
62539:
$2,000
Illinois:
$3,087
Total itemized deductions: $12,975 (19% of AGI, reported on 18.6% of returns)
Here:
$12,975
State:
$20,239
Here:
18.7% of AGI
State:
19.5% of AGI
(% of AGI for various income ranges: 7.1% for AGIs $10k-25k, 4.6% for AGIs $25k-50k, 5.2% for AGIs $50k-75k, 7.8% for AGIs $75k-100k, 6.0% for AGIs over 100k)
Charity contributions deductions: $2,309 (3% of AGI, reported on 15.3% of returns)
Here:
$2,309
State:
$3,719
Here:
3.1% of AGI
State:
3.4% of AGI
(% of AGI for various income ranges: 0.9% for AGIs $25k-50k, 0.6% for AGIs $50k-75k, 1.1% for AGIs $75k-100k, 1.4% for AGIs over 100k)
Total tax: $5,660 (reported on 76.6% of returns)
62539:
$5,660
State:
$9,882
(% of AGI for various income ranges: 2.2% for AGIs below $10k, 4.1% for AGIs $10k-25k, 7.2% for AGIs $25k-50k, 8.7% for AGIs $50k-75k, 11.7% for AGIs $75k-100k, 18.5% for AGIs over 100k)
Earned income credit: $1,598 (reported on 13.7% of returns)
Here:
$1,598
State:
$1,788
Percentage of individuals using paid preparers for their 2004 taxes: 56.7%
Here:
57%
State:
61%
(% for various income ranges: 41.0% for AGIs below $10k, 56.4% for AGIs $10k-25k, 57.1% for AGIs $25k-50k, 68.6% for AGIs $50k-75k, 57.6% for AGIs $75k-100k, 74.3% for AGIs over 100k)
Household received Food Stamps/SNAP in the past 12 months: 76 Household did not receive Food Stamps/SNAP in the past 12 months: 408
Women who had a birth in the past 12 months: 13 (13 now married, 0 unmarried) Women who did not have a birth in the past 12 months: 189 (112 now married, 75 unmarried)
Housing units in zip code 62539 with a mortgage: 180 (13 second mortgage, 9 both second mortgage and home equity loan) Houses without a mortgage: 3
Median monthly owner costs for units with a mortgage: $1,062 Median monthly owner costs for units without a mortgage: $527
Residents with income below the poverty level in 2022:
This zip code:
9.0%
Whole state:
11.9%
Residents with income below 50% of the poverty level in 2022:
This zip code:
7.1%
Whole state:
5.7%
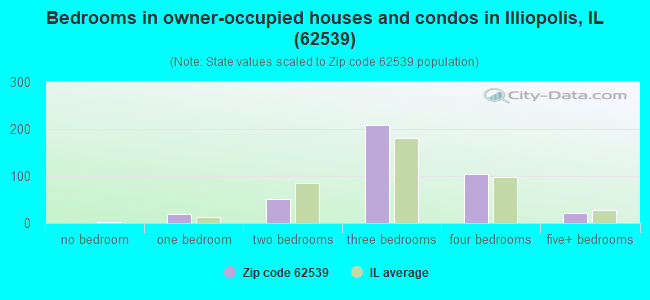
Median number of rooms in houses and condos:
Here:
6.4
State:
6.4
Median number of rooms in apartments:
Here:
4.6
State:
4.1
Notable locations in this zip code not listed on our city pages
Size of family households: 193 2-persons, 64 3-persons, 41 4-persons, 3 5-persons, 23 6-persons, 5 7-or-more-persons
Size of nonfamily households: 146 1-person, 7 2-persons
185 married couples with children.
42 single-parent households (20 men, 22 women).
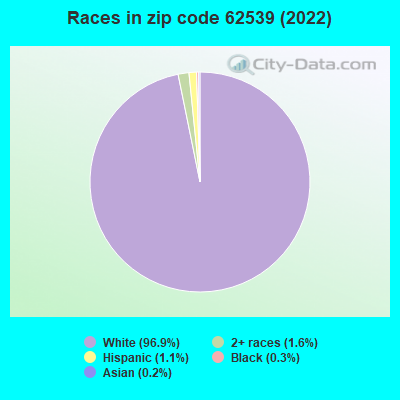
98.4% of residents of 62539 zip code speak English at home.
0.3% of residents speak Spanish at home (100% very well).
1.1% of residents speak other Indo-European language at home (55% very well, 45% well).
0.2% of residents speak other language at home (100% very well).
Foreign born population: 6 (0.5%) (33.5% of them are naturalized citizens)
This zip code:
0.5%
Whole state:
14.4%
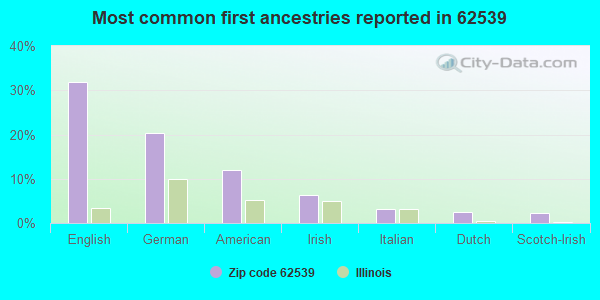
33%France
33%Liberia
17%Malaysia
32%English
20%German
12%American
6%Irish
3%Italian
3%Dutch
2%Scotch-Irish
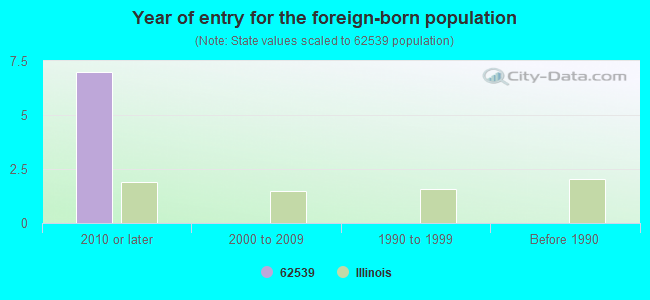
Year of entry for the foreign-born population
72010 or later
02000 to 2009
01990 to 1999
0Before 1990
Major facilities with environmental interests located in this zip code:
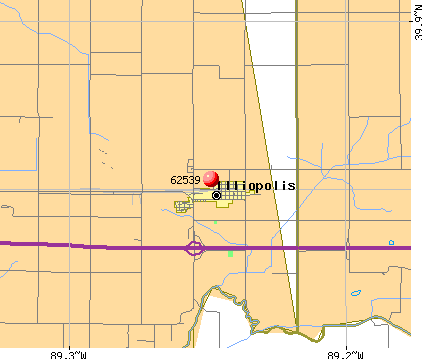
ROHM & HAAS (OLD ROUTE 36 WEST in ILLIOPOLIS, IL)
STATE MASTER (Illinois EPA Project) - SOLID WASTE PROGRAM, HAZARDOUS WASTE PROGRAM, AIR PROGRAM STATE MASTER (Illinois EPA Project) - National Pollutant Discharge Elimination System Permit AIR MINOR (AIRS/AFS) National Pollutant Discharge Elimination System NON-MAJOR (Tracking pollutant discharge elimination systems) - permit (Resource Conservation and Recovery Act (tracking hazardous waste)) TRI REPORTER (Tracking of toxic chemicals releasing facilities) Business SIC classification: PLASTICS MATERIALS, SYNTHETIC RESINS, AND NONVULCANIZABLE ELASTOMERS Organizations: ROHM AND HAAS (CONTACT/OWNER)
, ROHM AND HAAS CO (CONTACT/OWNER)
Alternative names: ROHM AND HAAS ILLINOIS INC
MONSANTO CO (4370 MT. PULASKI ROAD in ILLIOPOLIS, IL)
STATE MASTER (Illinois EPA Project) - SOLID WASTE PROGRAM, AIR PROGRAM, HAZARDOUS WASTE PROGRAM AIR MINOR (AIRS/AFS) COMPLIANCE ACTIVITY (Tracking inspections of insecticide, fungicide, and rodenticide, and toxic substances) CRITERIA AND HAZARDOUS AIR POLLUTANT INVENTORY (Inventory of air pollution sources) (Resource Conservation and Recovery Act (tracking hazardous waste)) Business SIC classification: CROP PREPARATION SERVICES FOR MARKET, EXCEPT COTTON GINNING Organizations: DEKALB PLANT GENETICS (CONTACT/OWNER)
Alternative names: DEKALB GENETICS CORPORATION, DEKALB PLANT GENETICS
KIRBY-COFFMAN INC (RURAL ROUTE #1 in ILLIOPOLIS, IL)
STATE MASTER (Illinois EPA Project) - AIR PROGRAM STATE MASTER (Illinois EPA Project) - SOLID WASTE PROGRAM AIR MINOR (AIRS/AFS) Business SIC classification: AUTOMATIC CONTROLS FOR REGULATING RESIDENTIAL AND COMMERCIAL ENVIRONMENTS AND APPLIANCES Alternative names: KIRBY-COFFMAN INC-TRI-MO-GEN SYS #1
ILLIOPOLIS GRAIN CO INC (246 LOUSIA ST in ILLIOPOLIS, IL)
STATE MASTER (Illinois EPA Project) - SOLID WASTE PROGRAM, AIR PROGRAM AIR MINOR (AIRS/AFS) National Pollutant Discharge Elimination System NON-MAJOR (Tracking pollutant discharge elimination systems) - permit Business SIC classification: GRAIN AND FIELD BEANS Organizations: ILLIOPOLIS GRAIN COMPANY (CONTACT/OWNER)
DEKALB POULTRY RESEARCH INC (SEC 2T16N R 2W ILLIOPOLIS in ILLIOPOLIS, IL)
STATE MASTER (Illinois EPA Project) - SOLID WASTE PROGRAM, AIR PROGRAM AIR MINOR (AIRS/AFS) CRITERIA AND HAZARDOUS AIR POLLUTANT INVENTORY (Inventory of air pollution sources) Business SIC classification: LIVESTOCK
ILLIOPOLIS REDI-MIX PLANT (1 1/2 MILES W OF TOWN in ILLIOPOLIS, IL)
STATE MASTER (Illinois EPA Project) - AIR PROGRAM AIR MINOR (AIRS/AFS) Business SIC classification: READY-MIXED CONCRETE
ILLIOPOLIS STP (US ROUTE 36 in ILLIOPOLIS, IL)
STATE MASTER (Illinois EPA Project) - National Pollutant Discharge Elimination System Permit National Pollutant Discharge Elimination System NON-MAJOR (Tracking pollutant discharge elimination systems) - permit Business SIC classification: SEWERAGE SYSTEMS Alternative names: ILLIOPOLIS STP, VILLAGE OF
LINCOLN LAND FS INC (R R #1, BOX 288 in ILLIOPOLIS, IL)
STATE MASTER (Illinois EPA Project) - AIR PROGRAM AIR MINOR (AIRS/AFS) Business SIC classification: FARM SUPPLIES
MONICAL OIL CO (NW RAILROAD TRACKS in ILLIOPOLIS, IL)
STATE MASTER (Illinois EPA Project) - AIR PROGRAM AIR MINOR (AIRS/AFS) Business SIC classification: PETROLEUM BULK STATIONS AND TERMINALS
DEKALB AGRESEARCH INC (SEC 2 AND SEC 15-T16N-R2W in ILLIOPOLIS, IL)
STATE MASTER (Illinois EPA Project) - AIR PROGRAM AIR MINOR (AIRS/AFS) Business SIC classification: LIVESTOCK Alternative names: DEKALB RESEARCH INCORPORATED
ILLIOPOLIS HIGH SCHOOL (341 E MATILDA STREET in ILLIOPOLIS, IL)
(Geographic Names Information System) (National Center for Education Statistics) - STATE ID-5108401200001 Organizations: ILLIOPOLIS C U SCHOOL DIST 12 (SCHOOL DISTRICT)
LINCOLN LAND FS INC (3688 MT PULASKI RD N in ILLIOPOLIS, IL)
STATE MASTER (Illinois EPA Project) - SOLID WASTE PROGRAM ENFORCEMENT/COMPLIANCE ACTIVITY (Integrated Compliance Information System) COMPLIANCE ACTIVITY (Tracking inspections of insecticide, fungicide, and rodenticide, and toxic substances) Alternative names: LINCOLN LAND FS INCORPORATED ILLIOPOLLIS NH 3
ILLIOPOLIS ELEM (341 E MATILDA STREET in ILLIOPOLIS, IL)
(National Center for Education Statistics) - STATE ID-5108401202001 Organizations: ILLIOPOLIS C U SCHOOL DIST 12 (SCHOOL DISTRICT)
Housing units lacking complete plumbing facilities: 0.3% Housing units lacking complete kitchen facilities: 1.3%
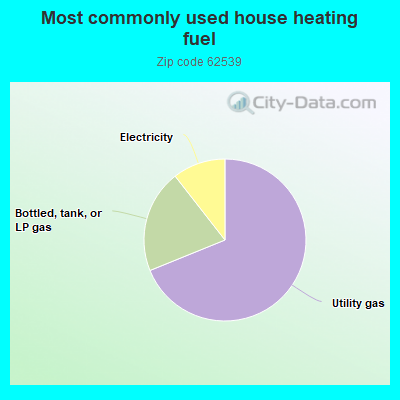
69.2%Utility gas
20.7%Bottled, tank, or LP gas
10.6%Electricity
Population in 1990: 1,366. Population change in the 1990s: +1 (+0.1%).
Place of birth for U.S.-born residents:
This state: 980
Midwest: 68
South: 66
West: 6
63% of the 62539 zip code residents lived in the same house 5 years ago. Out of people who lived in different houses, 54% lived in this county. Out of people who lived in different counties, 50% lived in Illinois.
96% of the 62539 zip code residents lived in the same house 1 year ago. Out of people who lived in different houses, 9% moved from this county. Out of people who lived in different houses, 79% moved from different county within same state. Out of people who lived in different houses, 15% moved from different state.
Private vs. public school enrollment:
Students in private schools in grades 1 to 8 (elementary and middle school): 2
Here:
2.1%
Illinois:
13.3%
Students in private schools in grades 9 to 12 (high school): 3
Here:
8.6%
Illinois:
9.9%
Students in private undergraduate colleges: 1
Here:
16.1%
Illinois:
27.4%
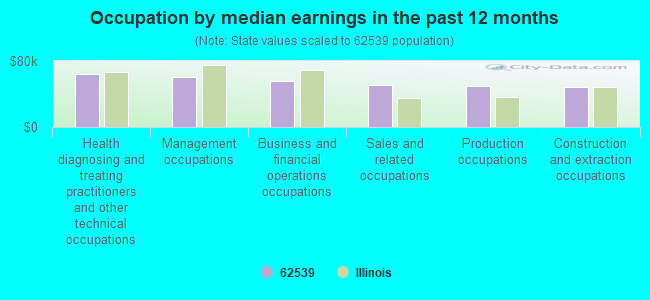
Occupation by median earnings in the past 12 months ($)
64,141Health diagnosing and treating practitioners and other technical occupations
61,034Management occupations
55,905Business and financial operations occupations
50,541Sales and related occupations
49,453Production occupations
48,768Construction and extraction occupations
Companies with federal contracts located in this zip code:
SANDRA S PERRY (314 MATILDA ST in ILLIOPOLIS, IL; small business) : $5,584 in 5 contractsfrom 2005 to 2006
Contracts for Operation of Government-Owned Facilities -- Recreation Facilities (Non-Building) by U.S. Army Corps of Engineers - civil program financing only, Army Signed by year:2000: $0; 2001: $0; 2002: $0; 2003: $0; 2004: $0; 2005: $0; 2006: $5,584.
Biggest contracts:
$12,296 with U.S. Army Corps of Engineers - civil program financing only for Operation of Government-Owned Facilities -- Recreation Facilities (Non-Building). Signed on 2005-03-25. Completion date: 2005-10-30.
$12,296 with Army for Operation of Government-Owned Facilities -- Recreation Facilities (Non-Building). Signed on 2005-03-25. Completion date: 2005-10-30.
$5,584, same as above.Signed on 2006-03-09. Completion date: 2006-10-31.
-$12,296 with U.S. Army Corps of Engineers - civil program financing only for Operation of Government-Owned Facilities -- Recreation Facilities (Non-Building). Signed on 2005-04-22. Completion date: 2005-10-30.
Top industries in this zip code by the number of employees in 2005:
Other Services (except Public Administration): Labor Unions and Similar Labor Organizations (5-9 employees: 2 establishments)
Construction: Plumbing, Heating, and Air-Conditioning Contractors (5-9: 1, 1-4: 1)
Finance and Insurance: Commercial Banking (5-9: 1)
Other Services (except Public Administration): Religious Organizations (1-4: 3)
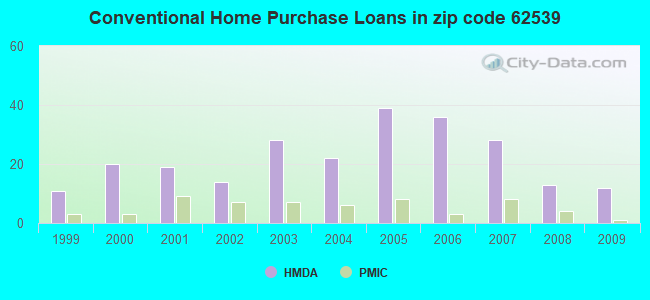
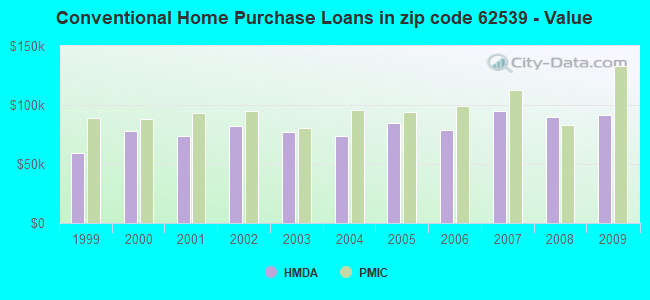
Home Mortgage Disclosure Act Aggregated Statistics For Year 2009 (Based on 2 partial tracts)
A) FHA, FSA/RHS & VA Home Purchase Loans
B) Conventional Home Purchase Loans
C) Refinancings
D) Home Improvement Loans
F) Non-occupant Loans on < 5 Family Dwellings (A B C & D)
G) Loans On Manufactured Home Dwelling (A B C & D)
Number
Average Value
Number
Average Value
Number
Average Value
Number
Average Value
Number
Average Value
Number
Average Value
LOANS ORIGINATED
10
$97,852
12
$91,880
78
$106,367
12
$58,728
6
$34,758
2
$37,805
APPLICATIONS APPROVED, NOT ACCEPTED
0
$0
1
$107,240
7
$106,817
0
$0
0
$0
0
$0
APPLICATIONS DENIED
2
$77,835
2
$109,465
13
$96,331
1
$116,630
1
$60,290
0
$0
APPLICATIONS WITHDRAWN
1
$96,370
0
$0
11
$112,228
0
$0
0
$0
0
$0
FILES CLOSED FOR INCOMPLETENESS
0
$0
0
$0
2
$80,310
0
$0
0
$0
0
$0
Aggregated Statistics For Year 2008 (Based on 2 partial tracts)
A) FHA, FSA/RHS & VA Home Purchase Loans
B) Conventional Home Purchase Loans
C) Refinancings
D) Home Improvement Loans
F) Non-occupant Loans on < 5 Family Dwellings (A B C & D)
G) Loans On Manufactured Home Dwelling (A B C & D)
Number
Average Value
Number
Average Value
Number
Average Value
Number
Average Value
Number
Average Value
Number
Average Value
LOANS ORIGINATED
6
$104,277
13
$89,526
43
$103,863
6
$31,300
6
$85,250
1
$32,620
APPLICATIONS APPROVED, NOT ACCEPTED
0
$0
1
$87,970
4
$99,210
1
$13,340
0
$0
0
$0
APPLICATIONS DENIED
0
$0
3
$117,950
14
$99,758
2
$34,100
0
$0
0
$0
APPLICATIONS WITHDRAWN
0
$0
0
$0
13
$110,055
2
$21,500
0
$0
0
$0
FILES CLOSED FOR INCOMPLETENESS
0
$0
0
$0
1
$178,410
0
$0
0
$0
0
$0
Aggregated Statistics For Year 2007 (Based on 2 partial tracts)
A) FHA, FSA/RHS & VA Home Purchase Loans
B) Conventional Home Purchase Loans
C) Refinancings
D) Home Improvement Loans
F) Non-occupant Loans on < 5 Family Dwellings (A B C & D)
G) Loans On Manufactured Home Dwelling (A B C & D)
Number
Average Value
Number
Average Value
Number
Average Value
Number
Average Value
Number
Average Value
Number
Average Value
LOANS ORIGINATED
3
$134,753
28
$94,728
41
$85,195
14
$25,381
9
$38,383
3
$39,043
APPLICATIONS APPROVED, NOT ACCEPTED
0
$0
3
$173,793
6
$84,427
1
$42,500
0
$0
0
$0
APPLICATIONS DENIED
1
$118,110
4
$88,462
21
$92,204
4
$28,788
0
$0
2
$108,475
APPLICATIONS WITHDRAWN
0
$0
4
$123,550
8
$61,836
2
$55,600
0
$0
0
$0
FILES CLOSED FOR INCOMPLETENESS
0
$0
0
$0
1
$134,920
0
$0
0
$0
0
$0
Aggregated Statistics For Year 2006 (Based on 2 partial tracts)
A) FHA, FSA/RHS & VA Home Purchase Loans
B) Conventional Home Purchase Loans
C) Refinancings
D) Home Improvement Loans
F) Non-occupant Loans on < 5 Family Dwellings (A B C & D)
G) Loans On Manufactured Home Dwelling (A B C & D)
Number
Average Value
Number
Average Value
Number
Average Value
Number
Average Value
Number
Average Value
Number
Average Value
LOANS ORIGINATED
2
$88,955
36
$79,141
31
$91,634
8
$43,675
10
$61,627
2
$60,290
APPLICATIONS APPROVED, NOT ACCEPTED
1
$56,830
0
$0
3
$81,213
1
$41,510
0
$0
0
$0
APPLICATIONS DENIED
0
$0
5
$69,880
17
$97,503
4
$42,255
0
$0
1
$139,360
APPLICATIONS WITHDRAWN
0
$0
3
$147,600
6
$95,710
0
$0
0
$0
0
$0
FILES CLOSED FOR INCOMPLETENESS
0
$0
0
$0
2
$112,185
0
$0
0
$0
0
$0
Aggregated Statistics For Year 2005 (Based on 2 partial tracts)
A) FHA, FSA/RHS & VA Home Purchase Loans
B) Conventional Home Purchase Loans
C) Refinancings
D) Home Improvement Loans
F) Non-occupant Loans on < 5 Family Dwellings (A B C & D)
G) Loans On Manufactured Home Dwelling (A B C & D)
Number
Average Value
Number
Average Value
Number
Average Value
Number
Average Value
Number
Average Value
Number
Average Value
LOANS ORIGINATED
2
$106,745
39
$84,457
37
$84,001
8
$29,158
8
$63,566
1
$48,430
APPLICATIONS APPROVED, NOT ACCEPTED
0
$0
5
$81,444
3
$123,057
0
$0
0
$0
0
$0
APPLICATIONS DENIED
1
$93,900
5
$68,496
19
$117,047
3
$30,310
1
$76,110
1
$62,760
APPLICATIONS WITHDRAWN
0
$0
4
$122,932
10
$112,826
1
$130,470
0
$0
0
$0
FILES CLOSED FOR INCOMPLETENESS
0
$0
0
$0
4
$106,500
0
$0
0
$0
0
$0
Aggregated Statistics For Year 2004 (Based on 2 partial tracts)
A) FHA, FSA/RHS & VA Home Purchase Loans
B) Conventional Home Purchase Loans
C) Refinancings
D) Home Improvement Loans
F) Non-occupant Loans on < 5 Family Dwellings (A B C & D)
G) Loans On Manufactured Home Dwelling (A B C & D)
Number
Average Value
Number
Average Value
Number
Average Value
Number
Average Value
Number
Average Value
Number
Average Value
LOANS ORIGINATED
2
$68,445
22
$74,018
53
$89,916
4
$27,552
4
$36,322
1
$46,450
APPLICATIONS APPROVED, NOT ACCEPTED
0
$0
3
$83,027
6
$100,158
0
$0
0
$0
0
$0
APPLICATIONS DENIED
0
$0
3
$73,800
19
$87,864
5
$19,274
1
$38,550
1
$66,720
APPLICATIONS WITHDRAWN
0
$0
1
$110,210
15
$88,165
0
$0
0
$0
0
$0
FILES CLOSED FOR INCOMPLETENESS
0
$0
0
$0
2
$80,800
0
$0
0
$0
0
$0
Aggregated Statistics For Year 2003 (Based on 2 partial tracts)
A) FHA, FSA/RHS & VA Home Purchase Loans
B) Conventional Home Purchase Loans
C) Refinancings
D) Home Improvement Loans
F) Non-occupant Loans on < 5 Family Dwellings (A B C & D)
Number
Average Value
Number
Average Value
Number
Average Value
Number
Average Value
Number
Average Value
LOANS ORIGINATED
5
$85,892
28
$76,813
145
$84,126
4
$17,790
7
$62,976
APPLICATIONS APPROVED, NOT ACCEPTED
0
$0
2
$118,115
10
$88,017
0
$0
0
$0
APPLICATIONS DENIED
0
$0
4
$119,842
20
$76,082
5
$26,292
1
$26,690
APPLICATIONS WITHDRAWN
0
$0
1
$156,660
12
$116,590
0
$0
0
$0
FILES CLOSED FOR INCOMPLETENESS
0
$0
0
$0
2
$59,305
0
$0
0
$0
Aggregated Statistics For Year 2002 (Based on 2 partial tracts)
A) FHA, FSA/RHS & VA Home Purchase Loans
B) Conventional Home Purchase Loans
C) Refinancings
D) Home Improvement Loans
F) Non-occupant Loans on < 5 Family Dwellings (A B C & D)
Number
Average Value
Number
Average Value
Number
Average Value
Number
Average Value
Number
Average Value
LOANS ORIGINATED
5
$73,834
14
$82,355
77
$79,412
8
$22,054
3
$43,160
APPLICATIONS APPROVED, NOT ACCEPTED
0
$0
2
$154,440
7
$76,813
2
$14,330
0
$0
APPLICATIONS DENIED
0
$0
3
$84,673
19
$89,580
2
$12,110
0
$0
APPLICATIONS WITHDRAWN
0
$0
2
$179,395
6
$81,048
0
$0
0
$0
FILES CLOSED FOR INCOMPLETENESS
0
$0
0
$0
2
$123,795
0
$0
0
$0
Aggregated Statistics For Year 2001 (Based on 2 partial tracts)
A) FHA, FSA/RHS & VA Home Purchase Loans
B) Conventional Home Purchase Loans
C) Refinancings
D) Home Improvement Loans
F) Non-occupant Loans on < 5 Family Dwellings (A B C & D)
Number
Average Value
Number
Average Value
Number
Average Value
Number
Average Value
Number
Average Value
LOANS ORIGINATED
3
$57,163
19
$73,740
71
$79,344
12
$25,204
2
$43,240
APPLICATIONS APPROVED, NOT ACCEPTED
0
$0
0
$0
9
$62,104
2
$20,510
1
$42,010
APPLICATIONS DENIED
0
$0
8
$55,412
25
$74,842
5
$15,518
1
$21,740
APPLICATIONS WITHDRAWN
0
$0
1
$102,790
13
$65,348
1
$44,970
0
$0
FILES CLOSED FOR INCOMPLETENESS
0
$0
1
$36,570
1
$92,420
0
$0
0
$0
Aggregated Statistics For Year 2000 (Based on 2 partial tracts)
A) FHA, FSA/RHS & VA Home Purchase Loans
B) Conventional Home Purchase Loans
C) Refinancings
D) Home Improvement Loans
F) Non-occupant Loans on < 5 Family Dwellings (A B C & D)
Number
Average Value
Number
Average Value
Number
Average Value
Number
Average Value
Number
Average Value
LOANS ORIGINATED
2
$79,815
20
$78,059
19
$68,564
10
$14,826
2
$84,015
APPLICATIONS APPROVED, NOT ACCEPTED
0
$0
2
$61,035
5
$68,002
2
$28,415
0
$0
APPLICATIONS DENIED
0
$0
10
$75,613
8
$50,718
2
$6,425
1
$84,010
APPLICATIONS WITHDRAWN
0
$0
1
$52,880
4
$60,292
0
$0
1
$14,830
FILES CLOSED FOR INCOMPLETENESS
0
$0
0
$0
2
$70,920
0
$0
0
$0
Aggregated Statistics For Year 1999 (Based on 1 partial tract)
A) FHA, FSA/RHS & VA Home Purchase Loans
B) Conventional Home Purchase Loans
C) Refinancings
D) Home Improvement Loans
F) Non-occupant Loans on < 5 Family Dwellings (A B C & D)
Detailed PMIC statistics for the following Tracts:0040.00
2002 - 2018 National Fire Incident Reporting System (NFIRS) incidents
According to the data from the years 2002 - 2018 the average number of fire incidents per year is 18. The highest number of fire incidents - 31 took place in 2009, and the least - 5 in 2005. The data has a growing trend.
When looking into fire subcategories, the most reports belonged to: Outside Fires (62.7%), and Structure Fires (20.6%).
Fire incident types reported to NFIRS in Zip Code 62539

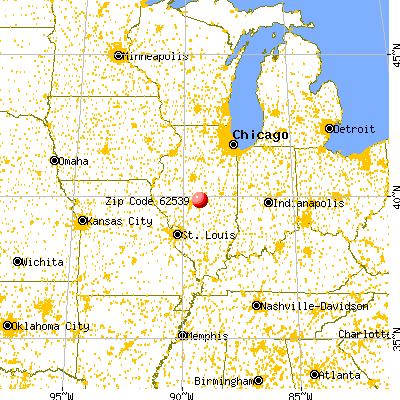


 Nearest zip codes: 62551, 62547, 62548, 62515, 62541, 62543.


 According to the data from the years 2002 - 2018 the average number of fire incidents per year is 18. The highest number of fire incidents - 31 took place in 2009, and the least - 5 in 2005. The data has a growing trend.
 When looking into fire subcategories, the most reports belonged to: Outside Fires (62.7%), and Structure Fires (20.6%).