Estimated zip code population in 2022: 5,414 Zip code population in 2010: 5,748 Zip code population in 2000: 5,424
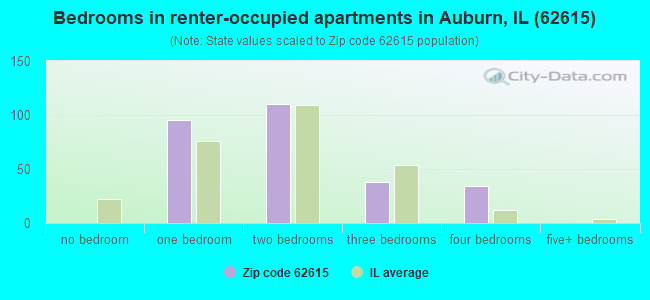
Houses and condos: 2,025 Renter-occupied apartments: 280
% of renters here:
14%
State:
33%
March 2022 cost of living index in zip code 62615: 83.4 (less than average, U.S. average is 100)
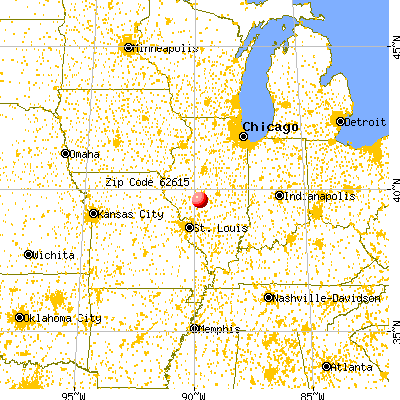
Land area: 50.8 sq. mi. Water area: 0.0 sq. mi.
Population density: 107 people per square mile
(very low).
OSM Map
General Map
Google Map
MSN Map
OSM Map
General Map
Google Map
MSN Map
OSM Map
General Map
Google Map
MSN Map
OSM Map
General Map
Google Map
MSN Map
Please wait while loading the map...
Real estate property taxes paid for housing units in 2022:
This zip code:
1.4% ($2,186)
Illinois:
2.0% ($4,912)
Median real estate property taxes paid for housing units with mortgages in 2022: $2,151 (1.4%) Median real estate property taxes paid for housing units with no mortgage in 2022: $2,240 (1.4%)
Business Search- 14 Million verified businesses
Males: 2,568
(47.4%)
Females: 2,845
(52.6%)
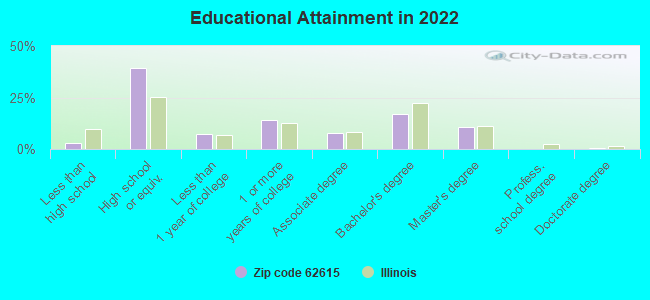
For population 25 years and over in 62615:
High school or higher: 96.5%
Bachelor's degree or higher: 28.1%
Graduate or professional degree: 11.2%
Unemployed: 0.7%
Mean travel time to work (commute): 29.0 minutes
For population 15 years and over in 62615:
Never married: 34.1%
Now married: 49.5%
Separated: 0.6%
Widowed: 4.6%
Divorced: 11.2%
Zip code 62615 compared to state average:
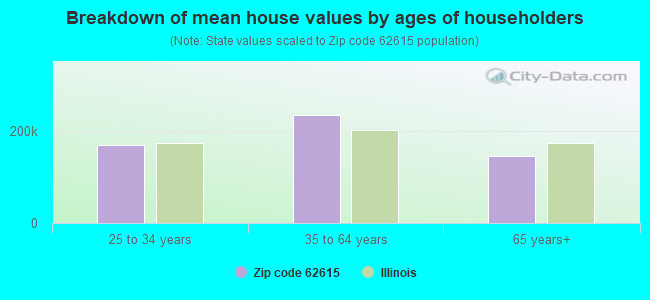
Median house value below state average.
Unemployed percentage significantly below state average.
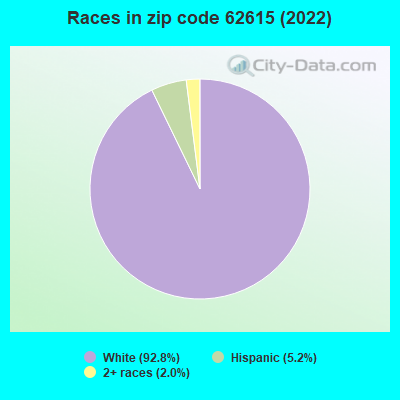
Black race population percentage significantly below state average.
Hispanic race population percentage significantly below state average.
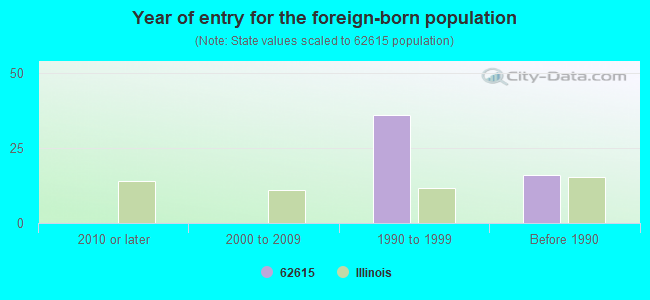
Foreign-born population percentage significantly below state average.
Renting percentage significantly below state average.
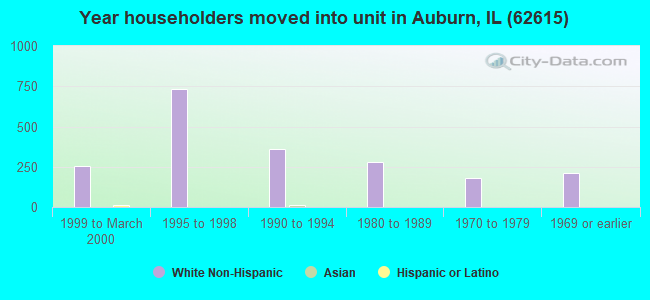
Length of stay since moving in above state average.
Estimated median house/condo value in 2022: $152,896
62615:
$152,896
Illinois:
$251,600
According to our research of Illinois and other state lists, there were 8 registered sex offenders living in 62615 zip code as of May 28, 2024. The ratio of all residents to sex offenders in zip code 62615 is 718 to 1. The ratio of registered sex offenders to all residents in this zip code is near the state average.
Median resident age:
This zip code:
36.4 years
Illinois median age:
39.1 years
Average household size:
This zip code:
2.7 people
Illinois:
2.4 people
Averages for the 2020 tax year for zip code 62615, filed in 2021:
Average Adjusted Gross Income (AGI) in 2020: $62,945 (Individual Income Tax Returns)
Here:
$62,945
State:
$82,626
Salary/wage: $52,943 (reported on 85.3% of returns)
Here:
$52,943
State:
$66,640
(% of AGI for various income ranges: 1127.4% for AGIs below $25k, 3475.6% for AGIs $25k-50k, 5861.6% for AGIs $50k-75k, 8922.5% for AGIs $75k-100k, 14984.4% for AGIs $100k-200k)
Taxable interest for individuals: $868 (reported on 38.0% of returns)
This zip code:
$868
Illinois:
$2,376
(% of AGI for various income ranges: 16.3% for AGIs below $25k, 14.8% for AGIs $25k-50k, 38.4% for AGIs $50k-75k, 55.0% for AGIs $75k-100k, 74.1% for AGIs $100k-200k)
Ordinary dividends: $2,671 (reported on 15.4% of returns)
Here:
$2,671
State:
$9,061
(% of AGI for various income ranges: 16.9% for AGIs below $25k, 28.3% for AGIs $25k-50k, 26.6% for AGIs $50k-75k, 80.5% for AGIs $75k-100k, 104.1% for AGIs $100k-200k)
Net capital gain/loss in AGI: +$4,991 (reported on 12.8% of returns)
Here:
+$4,991
State:
+$31,684
(% of AGI for various income ranges: 3.5% for AGIs below $25k, 14.0% for AGIs $25k-50k, 34.1% for AGIs $50k-75k, 45.5% for AGIs $75k-100k, 223.7% for AGIs $100k-200k)
Profit/loss from business: +$5,400 (reported on 10.5% of returns)
Here:
+$5,400
State:
+$12,175
(% of AGI for various income ranges: 76.3% for AGIs below $25k, 33.3% for AGIs $25k-50k, 76.6% for AGIs $50k-75k, 228.5% for AGIs $75k-100k, 51.2% for AGIs $100k-200k)
Taxable individual retirement arrangement distribution: $15,118 (reported on 8.3% of returns)
62615:
$15,118
Illinois:
$21,613
(% of AGI for various income ranges: 48.4% for AGIs below $25k, 77.7% for AGIs $25k-50k, 163.1% for AGIs $50k-75k, 201.5% for AGIs $75k-100k, 530.3% for AGIs $100k-200k)
Total itemized deductions: $33,771 (reported on 2.6% of returns)
Here:
$33,771
State:
$34,948
(% of AGI for various income ranges: 277.8% for AGIs $50k-75k, 460.9% for AGIs $100k-200k)
Charity contributions: $12,600 (reported on 1.9% of returns)
Here:
$12,600
State:
$13,122
(% of AGI for various income ranges: 196.9% for AGIs $100k-200k)
Taxes paid: $7,714 (reported on 2.6% of returns)
62615:
$7,714
State:
$8,563
(% of AGI for various income ranges: 55.0% for AGIs $50k-75k, 113.8% for AGIs $100k-200k)
Earned income credit: $2,189 (reported on 13.5% of returns)
Here:
$2,189
State:
$2,311
(% of AGI for various income ranges: 78.1% for AGIs below $25k, 58.5% for AGIs $25k-50k)
Percentage of individuals using paid preparers for their 2020 taxes: 95.5%
Here:
95%
State:
93%
(% for various income ranges: 93.8% for AGIs below $25k, 96.8% for AGIs $25k-50k, 95.0% for AGIs $50k-75k, 100.0% for AGIs $75k-100k, 96.0% for AGIs $100k-200k, 85.7% for AGIs over 200k)
Averages for the 2012 tax year for zip code 62615, filed in 2013:
Average Adjusted Gross Income (AGI) in 2012: $55,110 (Individual Income Tax Returns)
Here:
$55,110
State:
$68,058
Salary/wage: $45,806 (reported on 87.6% of returns)
Here:
$45,806
State:
$55,396
(% of AGI for various income ranges: 82.9% for AGIs below $25k, 82.5% for AGIs $25k-50k, 80.0% for AGIs $50k-75k, 77.5% for AGIs $75k-100k, 76.9% for AGIs $100k-200k, 26.1% for AGIs over 200k)
Taxable interest for individuals: $1,101 (reported on 36.1% of returns)
This zip code:
$1,101
Illinois:
$1,969
(% of AGI for various income ranges: 1.4% for AGIs below $25k, 0.6% for AGIs $25k-50k, 0.7% for AGIs $50k-75k, 0.6% for AGIs $75k-100k, 0.6% for AGIs $100k-200k, 1.0% for AGIs over 200k)
Ordinary dividends: $1,695 (reported on 16.5% of returns)
Here:
$1,695
State:
$7,786
(% of AGI for various income ranges: 0.8% for AGIs below $25k, 0.3% for AGIs $25k-50k, 0.3% for AGIs $50k-75k, 0.5% for AGIs $75k-100k, 0.7% for AGIs $100k-200k, 0.6% for AGIs over 200k)
Net capital gain/loss in AGI: +$8,588 (reported on 9.8% of returns)
Here:
+$8,588
State:
+$22,183
(% of AGI for various income ranges: 0.2% for AGIs $25k-50k, 0.9% for AGIs $75k-100k, 1.3% for AGIs $100k-200k, 7.9% for AGIs over 200k)
Profit/loss from business: +$8,444 (reported on 12.0% of returns)
Here:
+$8,444
State:
+$12,903
(% of AGI for various income ranges: 3.3% for AGIs below $25k, 2.0% for AGIs $25k-50k, 1.7% for AGIs $50k-75k, 1.0% for AGIs $75k-100k, 2.6% for AGIs $100k-200k)
Taxable individual retirement arrangement distribution: $11,023 (reported on 8.3% of returns)
62615:
$11,023
Illinois:
$17,929
(% of AGI for various income ranges: 2.2% for AGIs below $25k, 1.6% for AGIs $25k-50k, 1.7% for AGIs $50k-75k, 2.1% for AGIs $75k-100k, 1.9% for AGIs $100k-200k)
Total itemized deductions: $17,809 (17% of AGI, reported on 25.2% of returns)
Here:
$17,809
State:
$26,433
Here:
16.7% of AGI
State:
19.2% of AGI
(% of AGI for various income ranges: 3.2% for AGIs below $25k, 5.6% for AGIs $25k-50k, 7.5% for AGIs $50k-75k, 8.6% for AGIs $75k-100k, 11.2% for AGIs $100k-200k, 6.9% for AGIs over 200k)
Charity contributions: $3,666 (reported on 18.8% of returns)
Here:
$3,666
State:
$4,525
(% of AGI for various income ranges: 0.7% for AGIs $25k-50k, 0.9% for AGIs $50k-75k, 1.2% for AGIs $75k-100k, 1.8% for AGIs $100k-200k, 2.1% for AGIs over 200k)
Taxes paid: $7,203 (reported on 25.2% of returns)
62615:
$7,203
State:
$11,968
(% of AGI for various income ranges: 0.6% for AGIs below $25k, 1.5% for AGIs $25k-50k, 2.3% for AGIs $50k-75k, 3.4% for AGIs $75k-100k, 5.1% for AGIs $100k-200k, 3.8% for AGIs over 200k)
Earned income credit: $2,421 (reported on 14.7% of returns)
Here:
$2,421
State:
$2,349
(% of AGI for various income ranges: 6.0% for AGIs below $25k, 1.2% for AGIs $25k-50k)
Percentage of individuals using paid preparers for their 2012 taxes: 49.6%
Here:
50%
State:
57%
(% for various income ranges: 44.9% for AGIs below $25k, 46.6% for AGIs $25k-50k, 51.2% for AGIs $50k-75k, 53.3% for AGIs $75k-100k, 57.1% for AGIs $100k-200k, 100.0% for AGIs over 200k)
Averages for the 2004 tax year for zip code 62615, filed in 2005:
Average Adjusted Gross Income (AGI) in 2004: $41,320 (Individual Income Tax Returns)
Here:
$41,320
State:
$54,625
Salary/wage: $37,302 (reported on 88.1% of returns)
Here:
$37,302
State:
$46,811
(% of AGI for various income ranges: 144.8% for AGIs below $10k, 76.7% for AGIs $10k-25k, 82.3% for AGIs $25k-50k, 85.3% for AGIs $50k-75k, 80.7% for AGIs $75k-100k, 64.9% for AGIs over 100k)
Taxable interest for individuals: $1,495 (reported on 44.5% of returns)
This zip code:
$1,495
Illinois:
$2,101
(% of AGI for various income ranges: 8.5% for AGIs below $10k, 2.5% for AGIs $10k-25k, 1.2% for AGIs $25k-50k, 0.8% for AGIs $50k-75k, 1.2% for AGIs $75k-100k, 2.8% for AGIs over 100k)
Taxable dividends: $933 (reported on 19.8% of returns)
Here:
$933
State:
$4,306
(% of AGI for various income ranges: 3.0% for AGIs below $10k, 0.5% for AGIs $10k-25k, 0.4% for AGIs $25k-50k, 0.2% for AGIs $50k-75k, 0.4% for AGIs $75k-100k, 0.6% for AGIs over 100k)
Net capital gain/loss: +$3,053 (reported on 13.5% of returns)
Here:
+$3,053
State:
+$17,321
(% of AGI for various income ranges: -1.5% for AGIs below $10k, 0.6% for AGIs $10k-25k, 0.4% for AGIs $25k-50k, 0.7% for AGIs $50k-75k, 0.5% for AGIs $75k-100k, 3.0% for AGIs over 100k)
Profit/loss from business: +$7,445 (reported on 14.6% of returns)
Here:
+$7,445
State:
+$11,771
(% of AGI for various income ranges: 6.4% for AGIs below $10k, 3.8% for AGIs $10k-25k, 2.5% for AGIs $25k-50k, 2.2% for AGIs $50k-75k, 2.8% for AGIs $75k-100k, 2.3% for AGIs over 100k)
Profit/loss from farming: +$29,821 (reported on 2.2% of returns)
Here:
+$29,821
State:
+$2,327
IRA payment deduction: $2,650 (reported on 2.4% of returns)
62615:
$2,650
Illinois:
$3,087
Total itemized deductions: $14,259 (19% of AGI, reported on 23.9% of returns)
Here:
$14,259
State:
$20,239
Here:
19.1% of AGI
State:
19.5% of AGI
(% of AGI for various income ranges: 5.3% for AGIs $10k-25k, 6.5% for AGIs $25k-50k, 7.4% for AGIs $50k-75k, 10.2% for AGIs $75k-100k, 10.9% for AGIs over 100k)
Charity contributions deductions: $2,955 (4% of AGI, reported on 19.6% of returns)
Here:
$2,955
State:
$3,719
Here:
3.8% of AGI
State:
3.4% of AGI
(% of AGI for various income ranges: 0.5% for AGIs $10k-25k, 0.9% for AGIs $25k-50k, 1.0% for AGIs $50k-75k, 1.8% for AGIs $75k-100k, 2.6% for AGIs over 100k)
Total tax: $5,092 (reported on 76.3% of returns)
62615:
$5,092
State:
$9,882
(% of AGI for various income ranges: 3.1% for AGIs below $10k, 4.1% for AGIs $10k-25k, 6.6% for AGIs $25k-50k, 8.4% for AGIs $50k-75k, 10.2% for AGIs $75k-100k, 15.8% for AGIs over 100k)
Earned income credit: $1,739 (reported on 13.1% of returns)
Here:
$1,739
State:
$1,788
Percentage of individuals using paid preparers for their 2004 taxes: 51.9%
Here:
52%
State:
61%
(% for various income ranges: 39.6% for AGIs below $10k, 55.6% for AGIs $10k-25k, 53.9% for AGIs $25k-50k, 51.3% for AGIs $50k-75k, 57.4% for AGIs $75k-100k, 60.4% for AGIs over 100k)
Household received Food Stamps/SNAP in the past 12 months: 212 Household did not receive Food Stamps/SNAP in the past 12 months: 1,728
Women who had a birth in the past 12 months: 13 (13 now married, 0 unmarried) Women who did not have a birth in the past 12 months: 1,216 (474 now married, 743 unmarried)
Housing units in zip code 62615 with a mortgage: 1,155 (151 second mortgage, 12 home equity loan, 104 both second mortgage and home equity loan) Houses without a mortgage: 25
Median monthly owner costs for units with a mortgage: $1,111 Median monthly owner costs for units without a mortgage: $472
Residents with income below the poverty level in 2022:
This zip code:
7.5%
Whole state:
11.9%
Residents with income below 50% of the poverty level in 2022:
This zip code:
2.4%
Whole state:
5.7%
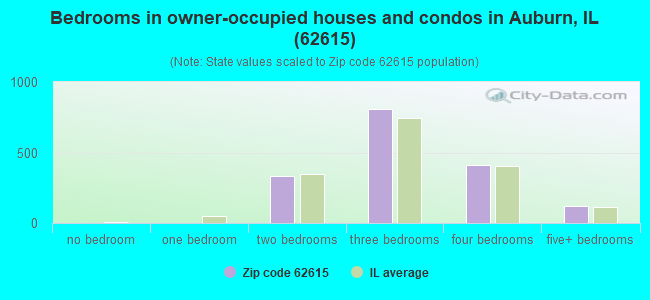
Median number of rooms in houses and condos:
Here:
6.9
State:
6.4
Median number of rooms in apartments:
Here:
4.5
State:
4.1
Notable locations in this zip code not listed on our city pages
Notable locations in zip code 62615: Beechley (A), Edgewood Country Club (B), Auburn Public Library (C), Auburn Area Ambulance Service (D), Auburn Fire Protection District / Auburn Emergency Squad (E), Auburn Fire Protection District Station 1 (F), Auburn Fire Protection District Station 2 (G). Display/hide their locations on the map
Churches in zip code 62615 include: Sugar Creek Church (A), Advent Christian Church (B), Auburn Baptist Church (C), Auburn Church of the Nazarene (D), Auburn Presbyterian Church (E), Christian Church of Auburn (F), Church of God (G), Kingdom Hall of Jehovahs Witnesses (H), Saint Benedicts Roman Catholic Church (I). Display/hide their locations on the map
Cemeteries: Auburn Cemetery (1), Wimmer Cemetery (2), West Cemetery (3), Cumberland Sugar Creek Cemetery (4), Sugar Creek Cemetery (5). Display/hide their locations on the map
In group quarters: 61 (-1 institutionalized population)
Size of family households: 606 2-persons, 281 3-persons, 216 4-persons, 135 5-persons, 38 6-persons, 92 7-or-more-persons
Size of nonfamily households: 425 1-person, 149 2-persons
749 married couples with children.
519 single-parent households (385 men, 134 women).
97.8% of residents of 62615 zip code speak English at home.
1.0% of residents speak Spanish at home (100% very well).
0.3% of residents speak other Indo-European language at home (100% very well).
Foreign born population: 0 (0.0%)
:
0.0%
Whole state:
14.4%
33%German
13%Irish
13%English
12%American
3%European
3%Italian
3%Swedish
Year of entry for the foreign-born population
02010 or later
02000 to 2009
361990 to 1999
16Before 1990
Facilities with environmental interests located in this zip code:
AUBURN STP (RURAL ROUTE #1 in AUBURN, IL)
STATE MASTER (Illinois EPA Project) - National Pollutant Discharge Elimination System Permit National Pollutant Discharge Elimination System NON-MAJOR (Tracking pollutant discharge elimination systems) - permit National Pollutant Discharge Elimination System NON-MAJOR (Tracking pollutant discharge elimination systems) - permit Business SIC classification: SEWERAGE SYSTEMS Alternative names: AUBURN STP, VILLAGE OF, AUBURN, VILLAGE OF
LINCOLN LAND FS INC (407 E. JACKSON ST. in AUBURN, IL)
STATE MASTER (Illinois EPA Project) - AIR PROGRAM AIR MINOR (AIRS/AFS) ENFORCEMENT/COMPLIANCE ACTIVITY (Integrated Compliance Information System) Business SIC classification: FARM SUPPLIES Alternative names: LINCOLN LAND F.S. INC (AUBURN), LINCOLN LAND FS INCORPORATED AUBURN NH 3
BOESDORFER, ADCOCK & BOESDORFER INC (14273 BAB RD. in AUBURN, IL)
STATE MASTER (Illinois EPA Project) - AIR PROGRAM AIR MINOR (AIRS/AFS) CRITERIA AND HAZARDOUS AIR POLLUTANT INVENTORY (Inventory of air pollution sources) Business SIC classification: GRAIN AND FIELD BEANS Alternative names: GREG BOESDORFER
LINCOLN LAND FS INC (CITY in AUBURN, IL)
STATE MASTER (Illinois EPA Project) - SOLID WASTE PROGRAM, SCRAP TIRE MANAGEMENT, AIR PROGRAM AIR MINOR (AIRS/AFS) Business SIC classification: FERTILIZERS, MIXING ONLY
POGGENPOHL REDI MIX (5692 W DIVERNON RD in AUBURN, IL)
STATE MASTER (Illinois EPA Project) - AIR PROGRAM AIR MINOR (AIRS/AFS) Business SIC classification: READY-MIXED CONCRETE
DALE LYBARGER OIL CO INC (R.R. in AUBURN, IL)
STATE MASTER (Illinois EPA Project) - AIR PROGRAM AIR MINOR (AIRS/AFS) Business SIC classification: PETROLEUM BULK STATIONS AND TERMINALS
AUBURN HIGH SCHOOL (511 NORTH 7TH in AUBURN, IL)
(Geographic Names Information System) (National Center for Education Statistics) - STATE ID-5108401000001 Organizations: AUBURN COMM UNIT SCHOOL DIST 10 (SCHOOL DISTRICT)
AUBURN ELEM SCHOOL (445 NORTH 5TH ST in AUBURN, IL)
(National Center for Education Statistics) - STATE ID-5108401002003 Organizations: AUBURN COMM UNIT SCHOOL DIST 10 (SCHOOL DISTRICT)
AUBURN MIDDLE SCHOOL (601 NORTH 7TH ST in AUBURN, IL)
(National Center for Education Statistics) - STATE ID-5108401001001 Organizations: AUBURN COMM UNIT SCHOOL DIST 10 (SCHOOL DISTRICT)
MOBIL TRUCK STOP #3 (RTE 104 & I 55 in AUBURN, IL)
Conditionally Exempt Small Quantity Generators, less than 100 kg/month of hazardous waste (Resource Conservation and Recovery Act (tracking hazardous waste)) - notification Organizations: TRI STAR MARKETING INC (CONTACT/OWNER)
PEPL AUBURN M&R (1 MILE N OF AUBURN in AUBURN, IL)
Small Quantity Generators, between 100 kg and 1000 kg of hazardous waste/month (Resource Conservation and Recovery Act (tracking hazardous waste)) - notification Organizations: PANHANDLE EASTERN PIPELINE COMPANY (CONTACT/OWNER)
RURAL ELECTRIC CONVENIENCE COOP (ROUTE 104 EAST in AUBURN, IL)
COMPLIANCE ACTIVITY (Tracking inspections of insecticide, fungicide, and rodenticide, and toxic substances)
RURAL ELECTRIC CONVENIENCE COOP (RTE 104 E in AUBURN, IL)
COMPLIANCE ACTIVITY (Tracking inspections of insecticide, fungicide, and rodenticide, and toxic substances)
Housing units lacking complete plumbing facilities: 2.8% Housing units lacking complete kitchen facilities: 1.3%
71.5%Utility gas
20.7%Electricity
7.3%Bottled, tank, or LP gas
0.6%Wood
Population in 1990: 3,934. Population change in the 1990s: +1,490 (+37.9%).
Place of birth for U.S.-born residents:
This state: 4,582
Northeast: 39
Midwest: 403
South: 212
West: 97
54% of the 62615 zip code residents lived in the same house 5 years ago. Out of people who lived in different houses, 68% lived in this county. Out of people who lived in different counties, 50% lived in Illinois.
94% of the 62615 zip code residents lived in the same house 1 year ago. Out of people who lived in different houses, 33% moved from this county. Out of people who lived in different houses, 43% moved from different county within same state. Out of people who lived in different houses, 28% moved from different state.
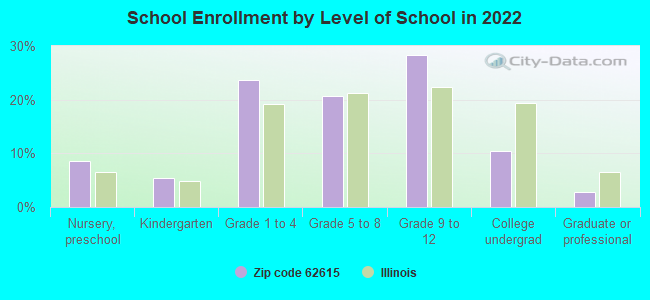
Private vs. public school enrollment:
Students in private schools in grades 1 to 8 (elementary and middle school): 63
Here:
10.1%
Illinois:
13.3%
Students in private schools in grades 9 to 12 (high school): 31
Here:
7.9%
Illinois:
9.9%
Students in private undergraduate colleges: 4
Here:
3.1%
Illinois:
27.4%
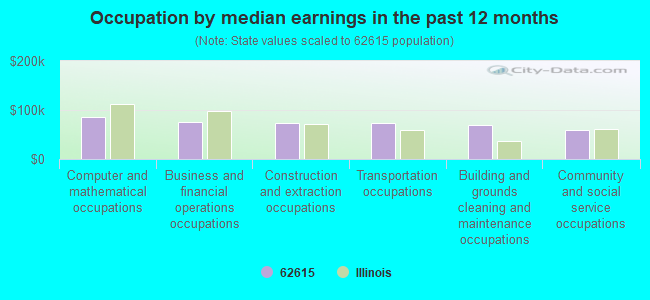
Occupation by median earnings in the past 12 months ($)
85,211Computer and mathematical occupations
75,423Business and financial operations occupations
74,441Construction and extraction occupations
74,398Transportation occupations
68,724Building and grounds cleaning and maintenance occupations
58,821Community and social service occupations
Top industries in this zip code by the number of employees in 2005:
Health Care and Social Assistance: Homes for the Elderly (20-49 employees: 2 establishments)
Finance and Insurance: Commercial Banking (20-49: 1, 1-4: 1)
Professional, Scientific, and Technical Services: Title Abstract and Settlement Offices (20-49: 1)
Utilities: Electric Power Distribution (20-49: 1)
Construction: New Single-Family Housing Construction (except Operative Builders) (10-19: 1, 1-4: 8)
Wholesale Trade: Grain and Field Bean Merchant Wholesalers (10-19: 1, 5-9: 1)
People in group quarters in 2010:
58 people in nursing facilities/skilled-nursing facilities
People in group quarters in 2000:
61 people in nursing homes
Fatal accident statistics in 2014:
Fatal accident count: 1
Vehicles involved in fatal accidents: 1
Fatal accidents caused by drunken drivers: 1
Fatalities: 1
Persons involved in fatal accidents: 1
Pedestrians involved in fatal accidents: 0
Fatal accident statistics in 2013:
Fatal accident count: 1
Vehicles involved in fatal accidents: 2
Fatal accidents caused by drunken drivers: 0
Fatalities: 1
Persons involved in fatal accidents: 4
Pedestrians involved in fatal accidents: 0
Home Mortgage Disclosure Act Aggregated Statistics For Year 2009 (Based on 4 partial tracts)
A) FHA, FSA/RHS & VA Home Purchase Loans
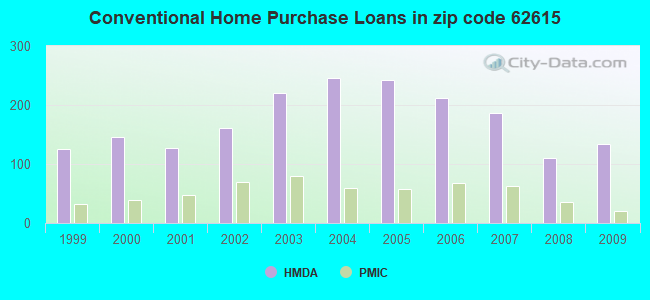
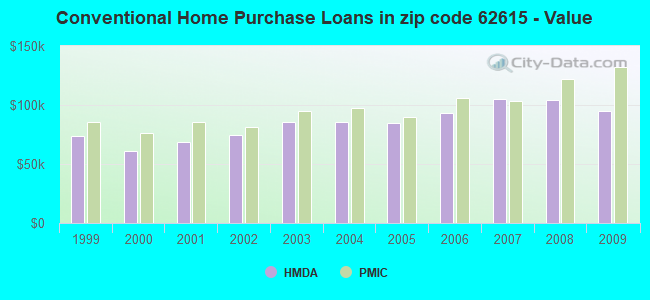
B) Conventional Home Purchase Loans
C) Refinancings
D) Home Improvement Loans
E) Loans on Dwellings For 5+ Families
F) Non-occupant Loans on < 5 Family Dwellings (A B C & D)
G) Loans On Manufactured Home Dwelling (A B C & D)
Number
Average Value
Number
Average Value
Number
Average Value
Number
Average Value
Number
Average Value
Number
Average Value
Number
Average Value
LOANS ORIGINATED
85
$104,842
134
$94,587
664
$118,792
56
$50,339
1
$708,340
45
$69,900
2
$82,510
APPLICATIONS APPROVED, NOT ACCEPTED
4
$177,362
3
$96,123
50
$110,626
2
$5,355
0
$0
2
$74,960
0
$0
APPLICATIONS DENIED
11
$83,480
5
$71,250
80
$102,706
12
$41,185
0
$0
11
$115,687
2
$9,815
APPLICATIONS WITHDRAWN
2
$107,845
1
$87,570
43
$98,931
0
$0
0
$0
2
$48,500
0
$0
FILES CLOSED FOR INCOMPLETENESS
1
$129,550
0
$0
15
$78,423
0
$0
0
$0
0
$0
0
$0
Aggregated Statistics For Year 2008 (Based on 4 partial tracts)
A) FHA, FSA/RHS & VA Home Purchase Loans
B) Conventional Home Purchase Loans
C) Refinancings
D) Home Improvement Loans
E) Loans on Dwellings For 5+ Families
F) Non-occupant Loans on < 5 Family Dwellings (A B C & D)
G) Loans On Manufactured Home Dwelling (A B C & D)
Number
Average Value
Number
Average Value
Number
Average Value
Number
Average Value
Number
Average Value
Number
Average Value
Number
Average Value
LOANS ORIGINATED
63
$96,581
110
$104,357
351
$120,876
57
$31,449
4
$263,258
49
$85,707
4
$51,312
APPLICATIONS APPROVED, NOT ACCEPTED
4
$53,990
13
$100,670
28
$136,513
4
$35,360
0
$0
2
$57,115
0
$0
APPLICATIONS DENIED
11
$85,091
10
$64,212
119
$109,007
23
$45,238
0
$0
5
$78,888
0
$0
APPLICATIONS WITHDRAWN
2
$178,925
8
$110,342
51
$112,485
2
$68,715
0
$0
0
$0
0
$0
FILES CLOSED FOR INCOMPLETENESS
0
$0
0
$0
9
$132,139
0
$0
0
$0
0
$0
0
$0
Aggregated Statistics For Year 2007 (Based on 4 partial tracts)
A) FHA, FSA/RHS & VA Home Purchase Loans
B) Conventional Home Purchase Loans
C) Refinancings
D) Home Improvement Loans
E) Loans on Dwellings For 5+ Families
F) Non-occupant Loans on < 5 Family Dwellings (A B C & D)
G) Loans On Manufactured Home Dwelling (A B C & D)
Number
Average Value
Number
Average Value
Number
Average Value
Number
Average Value
Number
Average Value
Number
Average Value
Number
Average Value
LOANS ORIGINATED
28
$98,069
187
$104,976
243
$99,999
59
$36,067
2
$181,155
41
$72,131
1
$12,790
APPLICATIONS APPROVED, NOT ACCEPTED
2
$157,060
9
$139,277
25
$83,570
8
$41,056
0
$0
8
$92,324
0
$0
APPLICATIONS DENIED
4
$82,100
14
$75,744
155
$92,278
38
$52,802
0
$0
16
$69,942
6
$53,732
APPLICATIONS WITHDRAWN
0
$0
10
$100,121
64
$97,521
8
$51,491
0
$0
7
$112,866
0
$0
FILES CLOSED FOR INCOMPLETENESS
0
$0
2
$119,820
15
$132,007
0
$0
0
$0
2
$138,560
0
$0
Aggregated Statistics For Year 2006 (Based on 4 partial tracts)
A) FHA, FSA/RHS & VA Home Purchase Loans
B) Conventional Home Purchase Loans
C) Refinancings
D) Home Improvement Loans
E) Loans on Dwellings For 5+ Families
F) Non-occupant Loans on < 5 Family Dwellings (A B C & D)
G) Loans On Manufactured Home Dwelling (A B C & D)
Number
Average Value
Number
Average Value
Number
Average Value
Number
Average Value
Number
Average Value
Number
Average Value
Number
Average Value
LOANS ORIGINATED
32
$109,709
212
$93,342
215
$94,264
46
$24,748
4
$120,872
34
$54,917
8
$25,872
APPLICATIONS APPROVED, NOT ACCEPTED
6
$139,418
15
$123,519
33
$102,338
4
$29,882
0
$0
2
$48,190
1
$23,910
APPLICATIONS DENIED
0
$0
28
$103,027
142
$93,797
33
$45,353
2
$116,010
4
$45,915
2
$41,840
APPLICATIONS WITHDRAWN
0
$0
10
$85,513
97
$99,792
3
$7,887
0
$0
2
$26,770
0
$0
FILES CLOSED FOR INCOMPLETENESS
0
$0
0
$0
24
$101,344
0
$0
0
$0
0
$0
0
$0
Aggregated Statistics For Year 2005 (Based on 4 partial tracts)
A) FHA, FSA/RHS & VA Home Purchase Loans
B) Conventional Home Purchase Loans
C) Refinancings
D) Home Improvement Loans
E) Loans on Dwellings For 5+ Families
F) Non-occupant Loans on < 5 Family Dwellings (A B C & D)
G) Loans On Manufactured Home Dwelling (A B C & D)
Number
Average Value
Number
Average Value
Number
Average Value
Number
Average Value
Number
Average Value
Number
Average Value
Number
Average Value
LOANS ORIGINATED
34
$94,725
243
$84,992
289
$120,453
49
$30,424
0
$0
68
$198,228
6
$24,438
APPLICATIONS APPROVED, NOT ACCEPTED
0
$0
12
$78,198
29
$79,687
1
$16,960
0
$0
4
$32,340
2
$44,620
APPLICATIONS DENIED
2
$108,050
40
$61,773
128
$88,287
24
$40,587
0
$0
7
$59,153
5
$33,430
APPLICATIONS WITHDRAWN
0
$0
16
$107,126
73
$106,490
6
$221,188
2
$271,290
7
$129,466
0
$0
FILES CLOSED FOR INCOMPLETENESS
0
$0
2
$114,750
10
$80,323
1
$38,920
0
$0
0
$0
0
$0
Aggregated Statistics For Year 2004 (Based on 4 partial tracts)
A) FHA, FSA/RHS & VA Home Purchase Loans
B) Conventional Home Purchase Loans
C) Refinancings
D) Home Improvement Loans
E) Loans on Dwellings For 5+ Families
F) Non-occupant Loans on < 5 Family Dwellings (A B C & D)
G) Loans On Manufactured Home Dwelling (A B C & D)
Number
Average Value
Number
Average Value
Number
Average Value
Number
Average Value
Number
Average Value
Number
Average Value
Number
Average Value
LOANS ORIGINATED
29
$93,704
245
$85,343
388
$83,006
46
$35,138
2
$182,940
78
$57,675
6
$46,810
APPLICATIONS APPROVED, NOT ACCEPTED
0
$0
19
$91,808
37
$88,816
6
$22,213
0
$0
4
$48,635
2
$66,930
APPLICATIONS DENIED
6
$76,843
32
$68,141
142
$85,838
21
$34,017
2
$294,490
4
$70,500
5
$42,478
APPLICATIONS WITHDRAWN
0
$0
19
$94,552
93
$86,479
6
$22,410
0
$0
2
$54,435
0
$0
FILES CLOSED FOR INCOMPLETENESS
2
$66,930
0
$0
13
$108,634
2
$36,305
0
$0
0
$0
0
$0
Aggregated Statistics For Year 2003 (Based on 4 partial tracts)
A) FHA, FSA/RHS & VA Home Purchase Loans
B) Conventional Home Purchase Loans
C) Refinancings
D) Home Improvement Loans
F) Non-occupant Loans on < 5 Family Dwellings (A B C & D)
Number
Average Value
Number
Average Value
Number
Average Value
Number
Average Value
Number
Average Value
LOANS ORIGINATED
35
$82,876
221
$85,363
942
$90,810
31
$16,758
65
$56,220
APPLICATIONS APPROVED, NOT ACCEPTED
2
$92,345
12
$92,920
49
$94,451
4
$37,055
5
$91,382
APPLICATIONS DENIED
0
$0
22
$73,401
167
$79,574
11
$27,829
9
$39,464
APPLICATIONS WITHDRAWN
6
$72,128
13
$79,387
67
$87,574
1
$67,830
3
$38,013
FILES CLOSED FOR INCOMPLETENESS
0
$0
4
$67,375
14
$78,875
1
$38,920
2
$60,685
Aggregated Statistics For Year 2002 (Based on 2 partial tracts)
A) FHA, FSA/RHS & VA Home Purchase Loans
B) Conventional Home Purchase Loans
C) Refinancings
D) Home Improvement Loans
E) Loans on Dwellings For 5+ Families
F) Non-occupant Loans on < 5 Family Dwellings (A B C & D)
Number
Average Value
Number
Average Value
Number
Average Value
Number
Average Value
Number
Average Value
Number
Average Value
LOANS ORIGINATED
45
$91,144
161
$74,629
578
$83,002
48
$19,819
2
$257,010
50
$66,787
APPLICATIONS APPROVED, NOT ACCEPTED
7
$92,300
5
$75,676
37
$72,743
4
$2,230
0
$0
0
$0
APPLICATIONS DENIED
4
$77,640
11
$63,117
129
$77,839
18
$7,536
2
$142,785
4
$24,988
APPLICATIONS WITHDRAWN
2
$58,900
11
$103,194
41
$77,051
4
$13,385
0
$0
0
$0
FILES CLOSED FOR INCOMPLETENESS
4
$71,838
0
$0
4
$39,265
0
$0
0
$0
0
$0
Aggregated Statistics For Year 2001 (Based on 2 partial tracts)
A) FHA, FSA/RHS & VA Home Purchase Loans
B) Conventional Home Purchase Loans
C) Refinancings
D) Home Improvement Loans
F) Non-occupant Loans on < 5 Family Dwellings (A B C & D)
Number
Average Value
Number
Average Value
Number
Average Value
Number
Average Value
Number
Average Value
LOANS ORIGINATED
32
$83,551
127
$68,272
493
$74,020
39
$23,889
34
$46,300
APPLICATIONS APPROVED, NOT ACCEPTED
4
$44,175
5
$76,032
37
$78,917
2
$12,495
2
$29,450
APPLICATIONS DENIED
5
$72,462
27
$59,824
129
$62,579
23
$7,683
4
$67,375
APPLICATIONS WITHDRAWN
0
$0
16
$79,312
52
$67,273
9
$7,536
2
$77,640
FILES CLOSED FOR INCOMPLETENESS
0
$0
2
$98,165
7
$74,707
0
$0
0
$0
Aggregated Statistics For Year 2000 (Based on 2 partial tracts)
A) FHA, FSA/RHS & VA Home Purchase Loans
B) Conventional Home Purchase Loans
C) Refinancings
D) Home Improvement Loans
F) Non-occupant Loans on < 5 Family Dwellings (A B C & D)
Number
Average Value
Number
Average Value
Number
Average Value
Number
Average Value
Number
Average Value
LOANS ORIGINATED
23
$77,212
145
$60,979
137
$74,870
52
$12,288
32
$61,185
APPLICATIONS APPROVED, NOT ACCEPTED
4
$75,855
9
$59,296
20
$57,917
5
$29,270
2
$13,385
APPLICATIONS DENIED
2
$35,695
25
$63,182
59
$60,199
25
$11,994
5
$26,416
APPLICATIONS WITHDRAWN
5
$75,318
9
$28,557
30
$53,722
0
$0
2
$7,140
FILES CLOSED FOR INCOMPLETENESS
2
$41,050
4
$49,082
14
$70,882
0
$0
0
$0
Aggregated Statistics For Year 1999 (Based on 2 partial tracts)
A) FHA, FSA/RHS & VA Home Purchase Loans
B) Conventional Home Purchase Loans
C) Refinancings
D) Home Improvement Loans
E) Loans on Dwellings For 5+ Families
F) Non-occupant Loans on < 5 Family Dwellings (A B C & D)
Detailed PMIC statistics for the following Tracts:0032.03
, 0034.00
2002 - 2018 National Fire Incident Reporting System (NFIRS) incidents
Based on the data from the years 2002 - 2018 the average number of fires per year is 14. The highest number of fires - 38 took place in 2008, and the least - 2 in 2004. The data has a growing trend.
When looking into fire subcategories, the most reports belonged to: Structure Fires (40.3%), and Outside Fires (31.1%).
Fire incident types reported to NFIRS in Zip Code 62615


 Nearest zip codes: 62689, 62690, 62530, 62629, 62661, 62536.


 Based on the data from the years 2002 - 2018 the average number of fires per year is 14. The highest number of fires - 38 took place in 2008, and the least - 2 in 2004. The data has a growing trend.
 When looking into fire subcategories, the most reports belonged to: Structure Fires (40.3%), and Outside Fires (31.1%).