Estimated zip code population in 2022: 7,217 Zip code population in 2010: 7,955 Zip code population in 2000: 7,578
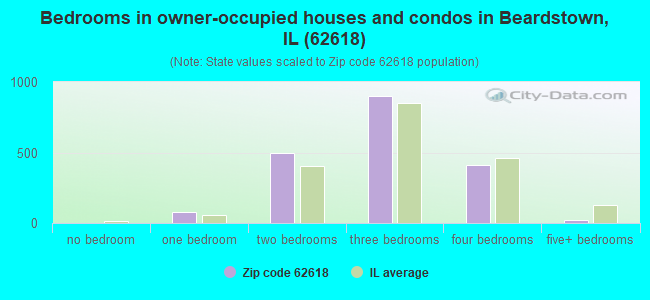
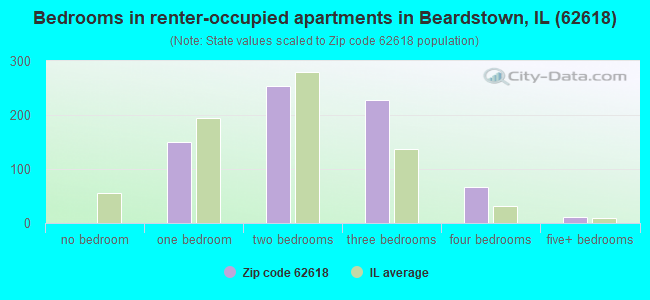
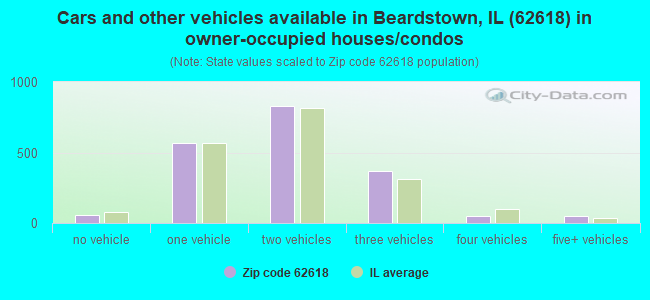
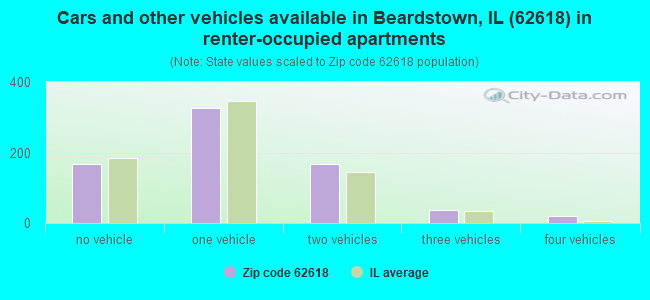
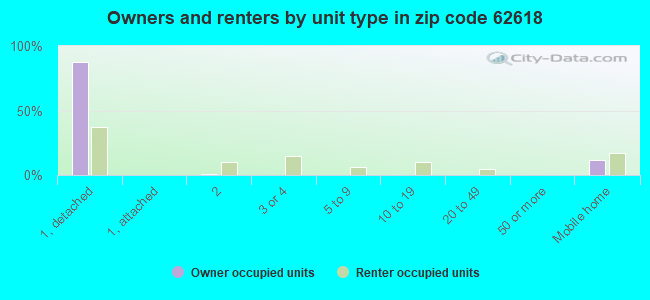
Houses and condos: 2,952 Renter-occupied apartments: 723
% of renters here:
27%
State:
33%
March 2022 cost of living index in zip code 62618: 73.2 (low, U.S. average is 100)
Land area: 85.8 sq. mi. Water area: 1.9 sq. mi.
Population density: 84 people per square mile
(very low).
OSM Map
General Map
Google Map
MSN Map
OSM Map
General Map
Google Map
MSN Map
OSM Map
General Map
Google Map
MSN Map
OSM Map
General Map
Google Map
MSN Map
Please wait while loading the map...
Real estate property taxes paid for housing units in 2022:
This zip code:
1.7% ($1,457)
Illinois:
2.0% ($4,912)
Median real estate property taxes paid for housing units with mortgages in 2022: $1,562 (1.8%) Median real estate property taxes paid for housing units with no mortgage in 2022: $1,374 (1.5%)
Averages for the 2020 tax year for zip code 62618, filed in 2021:
Average Adjusted Gross Income (AGI) in 2020: $49,435 (Individual Income Tax Returns)
Here:
$49,435
State:
$82,626
Salary/wage: $42,920 (reported on 87.9% of returns)
Here:
$42,920
State:
$66,640
(% of AGI for various income ranges: 1387.2% for AGIs below $25k, 4032.4% for AGIs $25k-50k, 6674.1% for AGIs $50k-75k, 9406.8% for AGIs $75k-100k, 15013.3% for AGIs $100k-200k)
Taxable interest for individuals: $1,214 (reported on 22.5% of returns)
This zip code:
$1,214
Illinois:
$2,376
(% of AGI for various income ranges: 11.8% for AGIs below $25k, 11.9% for AGIs $25k-50k, 31.4% for AGIs $50k-75k, 63.2% for AGIs $75k-100k, 143.3% for AGIs $100k-200k)
Ordinary dividends: $5,216 (reported on 8.7% of returns)
Here:
$5,216
State:
$9,061
(% of AGI for various income ranges: 8.9% for AGIs below $25k, 14.1% for AGIs $25k-50k, 42.0% for AGIs $50k-75k, 51.4% for AGIs $75k-100k, 334.4% for AGIs $100k-200k)
Net capital gain/loss in AGI: +$16,073 (reported on 6.2% of returns)
Here:
+$16,073
State:
+$31,684
(% of AGI for various income ranges: 4.5% for AGIs below $25k, 6.8% for AGIs $25k-50k, 35.1% for AGIs $50k-75k, 63.2% for AGIs $75k-100k, 503.3% for AGIs $100k-200k)
Taxable individual retirement arrangement distribution: $11,300 (reported on 5.9% of returns)
62618:
$11,300
Illinois:
$21,613
(% of AGI for various income ranges: 24.8% for AGIs below $25k, 33.4% for AGIs $25k-50k, 93.5% for AGIs $50k-75k, 170.9% for AGIs $75k-100k, 561.1% for AGIs $100k-200k)
Total itemized deductions: $31,850 (reported on 2.3% of returns)
Here:
$31,850
State:
$34,948
(% of AGI for various income ranges: 308.2% for AGIs $50k-75k, 576.7% for AGIs $100k-200k)
Charity contributions: $9,650 (reported on 1.7% of returns)
Here:
$9,650
State:
$13,122
(% of AGI for various income ranges: 19.4% for AGIs $25k-50k, 221.7% for AGIs $100k-200k)
Taxes paid: $10,725 (reported on 2.3% of returns)
62618:
$10,725
State:
$8,563
(% of AGI for various income ranges: 39.7% for AGIs below $25k, 53.3% for AGIs $50k-75k, 137.8% for AGIs $100k-200k)
Earned income credit: $2,253 (reported on 21.1% of returns)
Here:
$2,253
State:
$2,311
(% of AGI for various income ranges: 119.2% for AGIs below $25k, 68.9% for AGIs $25k-50k)
Percentage of individuals using paid preparers for their 2020 taxes: 93.5%
Here:
94%
State:
93%
(% for various income ranges: 93.8% for AGIs below $25k, 93.8% for AGIs $25k-50k, 92.3% for AGIs $50k-75k, 93.3% for AGIs $75k-100k, 93.5% for AGIs $100k-200k, 100.0% for AGIs over 200k)
Averages for the 2012 tax year for zip code 62618, filed in 2013:
Average Adjusted Gross Income (AGI) in 2012: $38,513 (Individual Income Tax Returns)
Here:
$38,513
State:
$68,058
Salary/wage: $34,125 (reported on 88.2% of returns)
Here:
$34,125
State:
$55,396
(% of AGI for various income ranges: 92.3% for AGIs below $25k, 88.0% for AGIs $25k-50k, 78.5% for AGIs $50k-75k, 75.7% for AGIs $75k-100k, 64.8% for AGIs $100k-200k, 31.6% for AGIs over 200k)
Taxable interest for individuals: $1,040 (reported on 24.2% of returns)
This zip code:
$1,040
Illinois:
$1,969
(% of AGI for various income ranges: 0.8% for AGIs below $25k, 0.5% for AGIs $25k-50k, 0.5% for AGIs $50k-75k, 0.8% for AGIs $75k-100k, 0.6% for AGIs $100k-200k, 1.4% for AGIs over 200k)
Ordinary dividends: $3,515 (reported on 11.5% of returns)
Here:
$3,515
State:
$7,786
(% of AGI for various income ranges: 0.6% for AGIs below $25k, 0.5% for AGIs $25k-50k, 1.1% for AGIs $50k-75k, 1.5% for AGIs $75k-100k, 1.0% for AGIs $100k-200k, 4.0% for AGIs over 200k)
Net capital gain/loss in AGI: +$5,964 (reported on 6.3% of returns)
Here:
+$5,964
State:
+$22,183
(% of AGI for various income ranges: 0.5% for AGIs $50k-75k, 5.9% for AGIs $100k-200k)
Profit/loss from business: +$1,142 (reported on 15.3% of returns)
Here:
+$1,142
State:
+$12,903
(% of AGI for various income ranges: 0.6% for AGIs $25k-50k, 1.4% for AGIs $50k-75k, 2.7% for AGIs $75k-100k, 2.2% for AGIs $100k-200k)
Taxable individual retirement arrangement distribution: $9,850 (reported on 5.8% of returns)
62618:
$9,850
Illinois:
$17,929
(% of AGI for various income ranges: 1.2% for AGIs below $25k, 1.1% for AGIs $25k-50k, 2.0% for AGIs $50k-75k, 1.3% for AGIs $75k-100k, 2.6% for AGIs $100k-200k)
Total itemized deductions: $17,450 (22% of AGI, reported on 13.3% of returns)
Here:
$17,450
State:
$26,433
Here:
22.5% of AGI
State:
19.2% of AGI
(% of AGI for various income ranges: 2.8% for AGIs below $25k, 5.0% for AGIs $25k-50k, 5.6% for AGIs $50k-75k, 6.7% for AGIs $75k-100k, 9.7% for AGIs $100k-200k, 9.0% for AGIs over 200k)
Charity contributions: $3,910 (reported on 8.9% of returns)
Here:
$3,910
State:
$4,525
(% of AGI for various income ranges: 0.2% for AGIs below $25k, 0.4% for AGIs $25k-50k, 0.9% for AGIs $50k-75k, 1.0% for AGIs $75k-100k, 2.8% for AGIs $100k-200k)
Taxes paid: $5,758 (reported on 13.0% of returns)
62618:
$5,758
State:
$11,968
(% of AGI for various income ranges: 0.3% for AGIs below $25k, 1.2% for AGIs $25k-50k, 1.5% for AGIs $50k-75k, 2.4% for AGIs $75k-100k, 3.9% for AGIs $100k-200k, 4.9% for AGIs over 200k)
Earned income credit: $2,396 (reported on 28.2% of returns)
Here:
$2,396
State:
$2,349
(% of AGI for various income ranges: 8.8% for AGIs below $25k, 1.5% for AGIs $25k-50k)
Percentage of individuals using paid preparers for their 2012 taxes: 72.3%
Here:
72%
State:
57%
(% for various income ranges: 69.3% for AGIs below $25k, 72.3% for AGIs $25k-50k, 76.2% for AGIs $50k-75k, 79.2% for AGIs $75k-100k, 81.2% for AGIs $100k-200k, 66.7% for AGIs over 200k)
Averages for the 2004 tax year for zip code 62618, filed in 2005:
Average Adjusted Gross Income (AGI) in 2004: $31,958 (Individual Income Tax Returns)
Here:
$31,958
State:
$54,625
Salary/wage: $28,930 (reported on 86.2% of returns)
Here:
$28,930
State:
$46,811
(% of AGI for various income ranges: 84.6% for AGIs below $10k, 81.2% for AGIs $10k-25k, 82.6% for AGIs $25k-50k, 83.3% for AGIs $50k-75k, 71.2% for AGIs $75k-100k, 56.5% for AGIs over 100k)
Taxable interest for individuals: $1,530 (reported on 38.1% of returns)
This zip code:
$1,530
Illinois:
$2,101
(% of AGI for various income ranges: 6.5% for AGIs below $10k, 2.4% for AGIs $10k-25k, 1.4% for AGIs $25k-50k, 0.8% for AGIs $50k-75k, 2.5% for AGIs $75k-100k, 2.4% for AGIs over 100k)
Taxable dividends: $2,649 (reported on 17.8% of returns)
Here:
$2,649
State:
$4,306
(% of AGI for various income ranges: 2.1% for AGIs below $10k, 1.1% for AGIs $10k-25k, 1.0% for AGIs $25k-50k, 1.5% for AGIs $50k-75k, 1.5% for AGIs $75k-100k, 3.1% for AGIs over 100k)
Net capital gain/loss: +$5,310 (reported on 11.0% of returns)
Here:
+$5,310
State:
+$17,321
(% of AGI for various income ranges: -0.5% for AGIs below $10k, 0.3% for AGIs $10k-25k, 0.8% for AGIs $25k-50k, 0.9% for AGIs $50k-75k, 1.8% for AGIs $75k-100k, 9.4% for AGIs over 100k)
Profit/loss from business: +$5,210 (reported on 11.4% of returns)
Here:
+$5,210
State:
+$11,771
(% of AGI for various income ranges: 1.5% for AGIs below $10k, 2.0% for AGIs $10k-25k, 1.6% for AGIs $25k-50k, 1.3% for AGIs $50k-75k, 0.1% for AGIs $75k-100k, 5.7% for AGIs over 100k)
Profit/loss from farming: +$1,907 (reported on 3.4% of returns)
Here:
+$1,907
State:
+$2,327
(% of AGI for various income ranges: -0.3% for AGIs below $10k, -0.1% for AGIs $10k-25k, 0.3% for AGIs $25k-50k, 0.4% for AGIs $50k-75k, 0.4% for AGIs $75k-100k)
IRA payment deduction: $3,270 (reported on 2.0% of returns)
62618:
$3,270
Illinois:
$3,087
Self-employed pension: $15,455 (reported on 0.3% of returns)
Here:
$15,455
Illinois:
$16,965
Total itemized deductions: $14,796 (24% of AGI, reported on 12.5% of returns)
Here:
$14,796
State:
$20,239
Here:
23.5% of AGI
State:
19.5% of AGI
(% of AGI for various income ranges: 4.2% for AGIs $10k-25k, 4.2% for AGIs $25k-50k, 6.6% for AGIs $50k-75k, 7.6% for AGIs $75k-100k, 10.2% for AGIs over 100k)
Charity contributions deductions: $3,327 (5% of AGI, reported on 9.4% of returns)
Here:
$3,327
State:
$3,719
Here:
4.9% of AGI
State:
3.4% of AGI
(% of AGI for various income ranges: 0.3% for AGIs $10k-25k, 0.5% for AGIs $25k-50k, 0.9% for AGIs $50k-75k, 1.6% for AGIs $75k-100k, 2.8% for AGIs over 100k)
Total tax: $3,731 (reported on 68.3% of returns)
62618:
$3,731
State:
$9,882
(% of AGI for various income ranges: 1.4% for AGIs below $10k, 3.5% for AGIs $10k-25k, 6.2% for AGIs $25k-50k, 8.2% for AGIs $50k-75k, 11.2% for AGIs $75k-100k, 16.7% for AGIs over 100k)
Earned income credit: $1,766 (reported on 20.9% of returns)
Here:
$1,766
State:
$1,788
Percentage of individuals using paid preparers for their 2004 taxes: 71.3%
Here:
71%
State:
61%
(% for various income ranges: 61.7% for AGIs below $10k, 73.8% for AGIs $10k-25k, 72.7% for AGIs $25k-50k, 75.4% for AGIs $50k-75k, 76.8% for AGIs $75k-100k, 75.9% for AGIs over 100k)
Likely homosexual households (counted as self-reported same-sex unmarried-partner households)
Lesbian couples: 0.8% of all households
Gay men: 0.0% of all households
Household received Food Stamps/SNAP in the past 12 months: 425 Household did not receive Food Stamps/SNAP in the past 12 months: 2,217
Women who had a birth in the past 12 months: 183 (165 now married, 16 unmarried) Women who did not have a birth in the past 12 months: 1,317 (570 now married, 746 unmarried)
Housing units in zip code 62618 with a mortgage: 936 (39 second mortgage, 28 both second mortgage and home equity loan) Houses without a mortgage: 25
Median monthly owner costs for units with a mortgage: $1,020 Median monthly owner costs for units without a mortgage: $527
Residents with income below the poverty level in 2022:
This zip code:
14.5%
Whole state:
11.9%
Residents with income below 50% of the poverty level in 2022:
This zip code:
8.9%
Whole state:
5.7%
Median number of rooms in houses and condos:
Here:
6.0
State:
6.4
Median number of rooms in apartments:
Here:
4.3
State:
4.1
Notable locations in this zip code not listed on our city pages
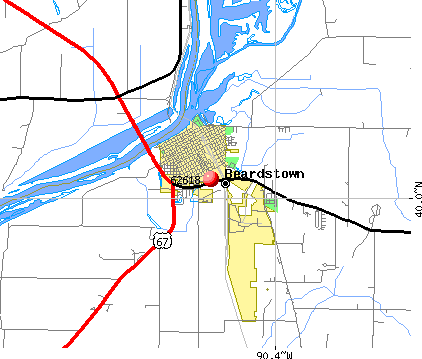
Notable locations in zip code 62618: South Beardstown Pumping Station (A), Schultz Hall (B), Beardstown Public Library (C), Beardstown City Hall (D), Beardstown Fire Department and Ambulance Service (E), Hagener Townhall (F), Beardstown River Museum (G). Display/hide their locations on the map
Churches in zip code 62618 include: Black Oak Church (A), Beardstown Church of Christ (B), Beardstown Church of the Nazarene (C), First Congregational United Church of Christ (D), First Evangelical Lutheran Church (E), First Southern Baptist Church (F), First United Methodist Church (G), Reorganized Church of Jesus Christ of Latter Day Saints (H), Saint Alexius Catholic Church (I). Display/hide their locations on the map
Cemeteries: Beard Cemetery (1), Carr Cemetery (2), Beardstown City Cemetery (3), Hager Cemetery (4), Oak Grove Cemetery (5), Otgen Cemetery (6), Schneider Cemetery (7). Display/hide their locations on the map
1,179 married couples with children.
557 single-parent households (218 men, 339 women).
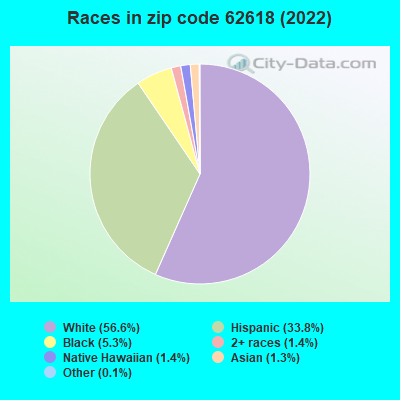
65.9% of residents of 62618 zip code speak English at home.
28.5% of residents speak Spanish at home (45% very well, 26% well, 17% not well, 12% not at all).
2.8% of residents speak other Indo-European language at home (40% very well, 32% well, 27% not well).
1.3% of residents speak Asian or Pacific Island language at home (31% very well, 46% well, 17% not well, 6% not at all).
1.1% of residents speak other language at home (36% very well, 11% well, 54% not well).
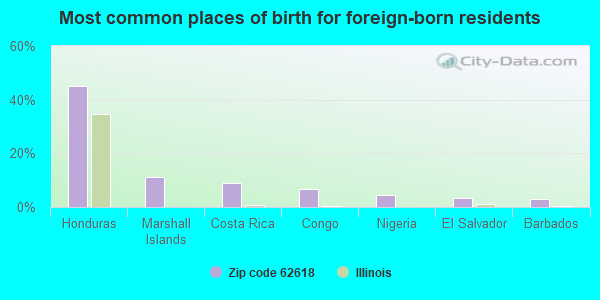
Foreign born population: 1,301 (18.0%) (22.7% of them are naturalized citizens)
This zip code:
18.0%
Whole state:
14.4%
45%Honduras
11%Marshall Islands
9%Costa Rica
7%Congo
5%Nigeria
3%El Salvador
3%Barbados
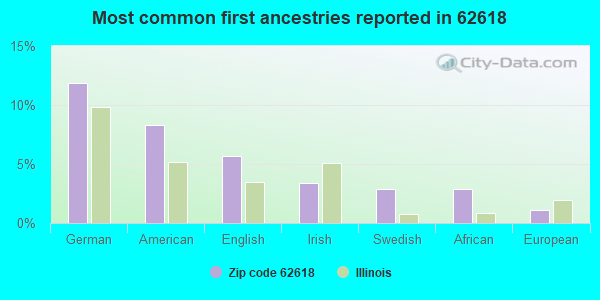
12%German
8%American
6%English
3%Irish
3%Swedish
3%African
1%European
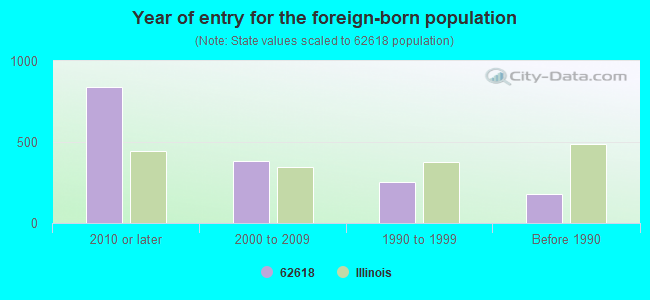
Year of entry for the foreign-born population
8392010 or later
3812000 to 2009
2541990 to 1999
179Before 1990
Major facilities with environmental interests located in this zip code:
KENT FEEDS INC (HIGHWAY 125 EAST in BEARDSTOWN, IL)
STATE MASTER (Illinois EPA Project) - AIR PROGRAM, National Pollutant Discharge Elimination System Permit AIR MINOR (AIRS/AFS) CRITERIA AND HAZARDOUS AIR POLLUTANT INVENTORY (Inventory of air pollution sources) National Pollutant Discharge Elimination System NON-MAJOR (Tracking pollutant discharge elimination systems) - permit TRI REPORTER (Tracking of toxic chemicals releasing facilities) Business SIC classification: PREPARED FEEDS AND FEED INGREDIENTS FOR ANIMALS AND FOWLS, EXCEPT DOGS AND CATS Organizations: KENT FEEDS, INC. (CONTACT/OWNER)
JEFFERSON SMURFIT CORP (905 BAY STREET in BEARDSTOWN, IL)
STATE MASTER (Illinois EPA Project) - SOLID WASTE PROGRAM, AIR PROGRAM AIR MINOR (AIRS/AFS) National Pollutant Discharge Elimination System NON-MAJOR (Tracking pollutant discharge elimination systems) - permit Business SIC classification: FIBER CANS, TUBES, DRUMS, AND SIMILAR PRODUCTS Organizations: JEFFERSON SMURFIT CORPORATION (CONTACT/OWNER)
Alternative names: JEFFERSON SMURFIT-BEARDSTOWN
PLAZA LEATHER CLEANERS INC (106 E 2ND ST in BEARDSTOWN, IL)
STATE MASTER (Illinois EPA Project) - HAZARDOUS WASTE PROGRAM, AIR PROGRAM AIR MINOR (AIRS/AFS) CRITERIA AND HAZARDOUS AIR POLLUTANT INVENTORY (Inventory of air pollution sources) (Resource Conservation and Recovery Act (tracking hazardous waste)) Business SIC classification: DRYCLEANING PLANTS, EXCEPT RUG CLEANING Organizations: CARVER BROOKS (CONTACT/OWNER)
Alternative names: PLAZA CLEANERS
OSMOSE INC (6681 KENT FEED RD in BEARDSTOWN, IL)
STATE MASTER (Illinois EPA Project) - AIR PROGRAM, National Pollutant Discharge Elimination System Permit AIR MINOR (AIRS/AFS) National Pollutant Discharge Elimination System NON-MAJOR (Tracking pollutant discharge elimination systems) - permit Business SIC classification: WOOD PRESERVING; PESTICIDES AND AGRICULTURAL CHEMICALS Alternative names: CASSWOOD TREATED PRODUCTS, OSMOSE CASSWOOD SITE-BEARDSTWN, OSMOSE WOOD PRESERVATION, OSMOSE WOOD PRESERVING-BEARDST
NEWLINE HARDWOODS INC (8727 ARENZVILLE ROAD in BEARDSTOWN, IL)
STATE MASTER (Illinois EPA Project) - AIR PROGRAM AIR MINOR (AIRS/AFS) CRITERIA AND HAZARDOUS AIR POLLUTANT INVENTORY (Inventory of air pollution sources) Business SIC classification: LUMBER, PLYWOOD, MILLWORK, AND WOOD PANELS Alternative names: RICH LUMBER CO INC
OSMOSE WOOD PRESERVING (ARENZVILLE RD in BEARDSTOWN, IL)
STATE MASTER (Illinois EPA Project) - AIR PROGRAM AIR MINOR (AIRS/AFS) CRITERIA AND HAZARDOUS AIR POLLUTANT INVENTORY (Inventory of air pollution sources) Business SIC classification: WOOD PRESERVING
BLUFF SPRINGS FARMERS ELEVATOR (900 W MAIN in BEARDSTOWN, IL)
STATE MASTER (Illinois EPA Project) - AIR PROGRAM AIR MINOR (AIRS/AFS) Business SIC classification: GRAIN AND FIELD BEANS Alternative names: BLUFF SPRNGS FRM ELV
CITY OF BEARDSTOWN (RURAL ROUTE 1 BOX 285 in BEARDSTOWN, IL)
STATE MASTER (Illinois EPA Project) - National Pollutant Discharge Elimination System Permit National Pollutant Discharge Elimination System NON-MAJOR (Tracking pollutant discharge elimination systems) - permit Organizations: BEARDSTOWN?CITY OF (CONTACT/OWNER)
Alternative names: BEARDSTOWN AIRPORT?CITY OF, CITY OF BEARDSTOWN AIRPORT
CLARKSON GRAIN CO INC (601 E. 2ND ST. in BEARDSTOWN, IL)
STATE MASTER (Illinois EPA Project) - AIR PROGRAM AIR MINOR (AIRS/AFS) CRITERIA AND HAZARDOUS AIR POLLUTANT INVENTORY (Inventory of air pollution sources) Business SIC classification: GRAIN AND FIELD BEANS
COMMUNITY READY MIX OF BEARDSTOWN INC (RURAL ROUTE 1 SPRINGFIELD ROAD in BEARDSTOWN, IL)
STATE MASTER (Illinois EPA Project) - AIR PROGRAM AIR MINOR (AIRS/AFS) CRITERIA AND HAZARDOUS AIR POLLUTANT INVENTORY (Inventory of air pollution sources) Business SIC classification: READY-MIXED CONCRETE
AMEREN CIPS (MAIN ST in BEARDSTOWN, IL)
STATE MASTER (Illinois EPA Project) - AIR PROGRAM AIR MINOR (AIRS/AFS) Business SIC classification: ELECTRIC SERVICES
AMERENCIPS- BEARDSTOWN MGP SITE CLEANUP (101 N. BAY in BEARDSTOWN, IL)
STATE MASTER (Illinois EPA Project) - SOLID WASTE PROGRAM, HAZARDOUS WASTE PROGRAM, AIR PROGRAM AIR MINOR (AIRS/AFS) Business SIC classification: NONCLASSIFIABLE ESTABLISHMENTS Alternative names: AMEREN CIPS-BEARDSTOWN MGP SITE CLEANUP
LAUDER SALVAGE YARD (COUNTY ROAD 1050E in BEARDSTOWN, IL)
STATE MASTER (Illinois EPA Project) - AIR PROGRAM, SOLID WASTE PROGRAM AIR MINOR (AIRS/AFS) Business SIC classification: WOMEN'S, MISSES', CHILDREN'S, AND INFANTS' UNDERWEAR AND NIGHTWEAR Alternative names: JOHN W NOLAND P E VICE PRESIDENT
Housing units lacking complete plumbing facilities: 2.6% Housing units lacking complete kitchen facilities: 2.2%
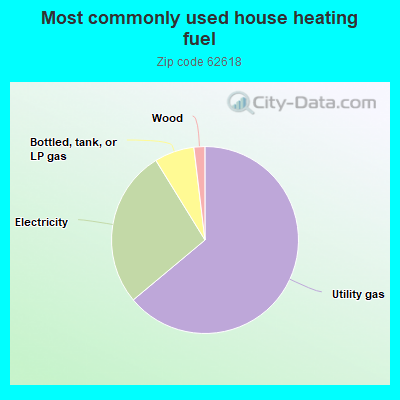
64.0%Utility gas
27.3%Electricity
6.9%Bottled, tank, or LP gas
1.9%Wood
Population in 1990: 7,369. Population change in the 1990s: +209 (+2.8%).
Place of birth for U.S.-born residents:
This state: 4,763
Northeast: 86
Midwest: 331
South: 152
West: 319
56% of the 62618 zip code residents lived in the same house 5 years ago. Out of people who lived in different houses, 60% lived in this county. Out of people who lived in different counties, 50% lived in Illinois.
87% of the 62618 zip code residents lived in the same house 1 year ago. Out of people who lived in different houses, 46% moved from this county. Out of people who lived in different houses, 7% moved from different county within same state. Out of people who lived in different houses, 6% moved from different state. Out of people who lived in different houses, 47% moved from abroad.
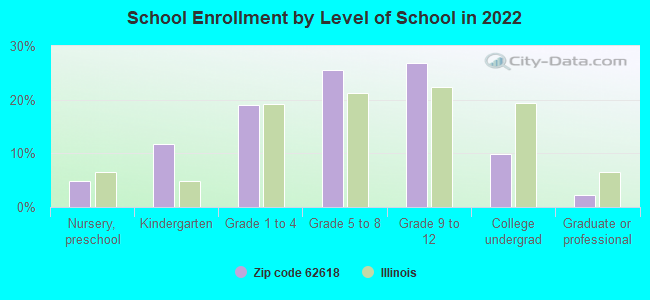
Private vs. public school enrollment:
Students in private schools in grades 1 to 8 (elementary and middle school): 104
Here:
13.1%
Illinois:
13.3%
Students in private schools in grades 9 to 12 (high school): 54
Here:
11.4%
Illinois:
9.9%
Students in private undergraduate colleges: 16
Here:
9.3%
Illinois:
27.4%
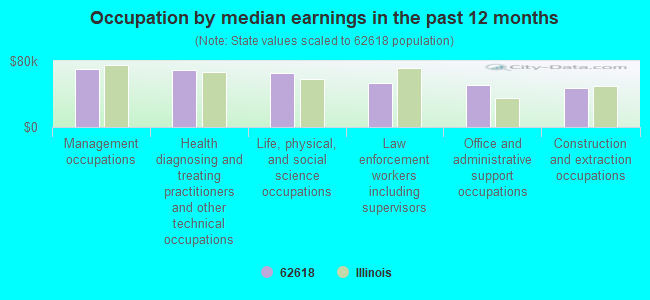
Occupation by median earnings in the past 12 months ($)
70,804Management occupations
69,422Health diagnosing and treating practitioners and other technical occupations
65,562Life, physical, and social science occupations
53,073Law enforcement workers including supervisors
50,902Office and administrative support occupations
47,276Construction and extraction occupations
Companies with federal contracts located in this zip code:
RANKIN, BREE (9416 N BLUFF SPRINGS RD in BEARDSTOWN, IL; small business)
$6,293 with Army for Technical Assistance. Signed on 2003-05-01. Completion date: 2003-08-22.
PATEL, BJ (9918 GRAND AVE in BEARDSTOWN, IL; small business) : $672 in 3 contractsfrom 2005 to 2006
$264 with Army for Lodging - Hotel/Motel. Signed on 2006-03-07. Completion date: 2005-11-11.
$204, same as above.Signed on 2006-01-18. Completion date: 2005-11-05.
$204, same as above.Signed on 2005-09-14. Completion date: 2005-08-21.
Top industries in this zip code by the number of employees in 2005:
Health Care and Social Assistance: Nursing Care Facilities (50-99 employees: 2 establishments)
Utilities: Electric Power Distribution (50-99: 1, 5-9: 1)
Administrative and Support and Waste Management and Remediation Services: Security Guards and Patrol Services (50-99: 1)
People in group quarters in 2010:
105 people in nursing facilities/skilled-nursing facilities
30 people in group homes intended for adults
People in group quarters in 2000:
119 people in nursing homes
30 people in homes for the mentally retarded
Fatal accident statistics in 2012:
Fatal accident count: 2
Vehicles involved in fatal accidents: 3
Fatal accidents caused by drunken drivers: 1
Fatalities: 2
Persons involved in fatal accidents: 11
Pedestrians involved in fatal accidents: 0
2002 - 2018 National Fire Incident Reporting System (NFIRS) incidents
Based on the data from the years 2002 - 2018 the average number of fires per year is 38. The highest number of fires - 66 took place in 2012, and the least - 19 in 2007. The data has a growing trend.
When looking into fire subcategories, the most reports belonged to: Structure Fires (36.5%), and Outside Fires (36.2%).
Fire incident types reported to NFIRS in Zip Code 62618

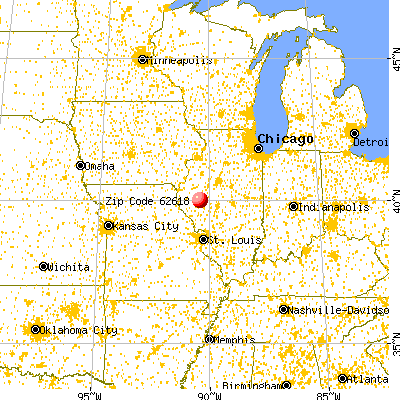


 Nearest zip codes: 62622, 62611, 62639, 62631, 62624, 62691.
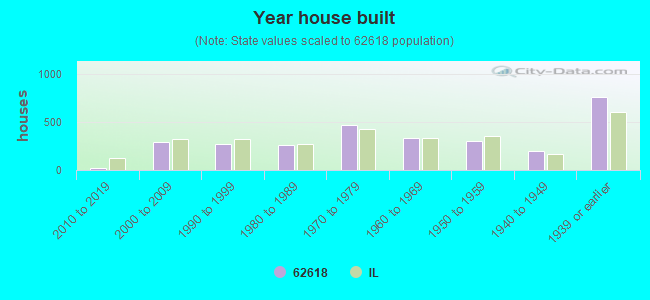


 Based on the data from the years 2002 - 2018 the average number of fires per year is 38. The highest number of fires - 66 took place in 2012, and the least - 19 in 2007. The data has a growing trend.
 When looking into fire subcategories, the most reports belonged to: Structure Fires (36.5%), and Outside Fires (36.2%).