Estimated zip code population in 2022: 522 Zip code population in 2010: 572 Zip code population in 2000: 761
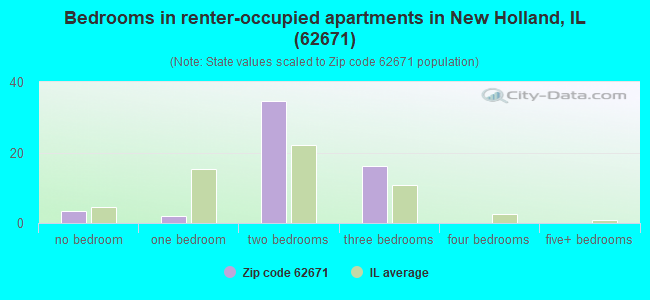
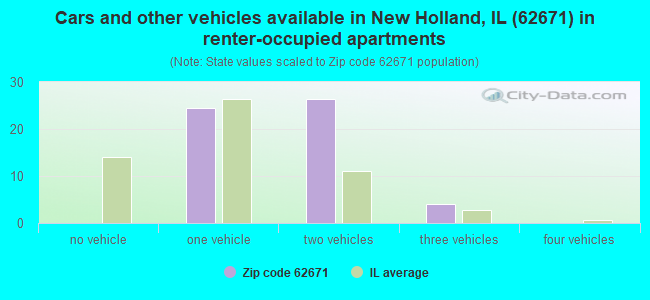
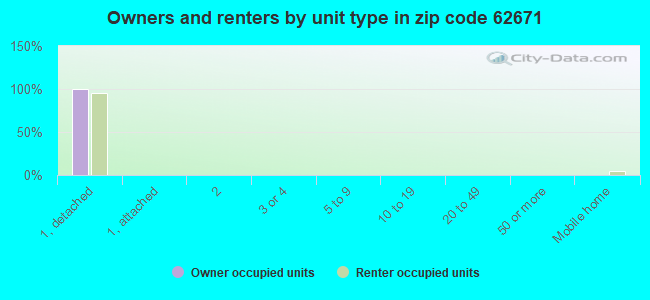
Houses and condos: 276 Renter-occupied apartments: 56
% of renters here:
25%
State:
33%
March 2022 cost of living index in zip code 62671: 83.7 (less than average, U.S. average is 100)
Land area: 48.3 sq. mi. Water area: 0.0 sq. mi.
Population density: 11 people per square mile
(very low).
OSM Map
General Map
Google Map
MSN Map
OSM Map
General Map
Google Map
MSN Map
OSM Map
General Map
Google Map
MSN Map
OSM Map
General Map
Google Map
MSN Map
Please wait while loading the map...
Real estate property taxes paid for housing units in 2022:
This zip code:
2.0% ($2,506)
Illinois:
2.0% ($4,912)
Median real estate property taxes paid for housing units with mortgages in 2022: $1,913 (1.8%) Median real estate property taxes paid for housing units with no mortgage in 2022: $2,982 (1.8%)
Business Search- 14 Million verified businesses
Males: 250
(47.9%)
Females: 272
(52.1%)
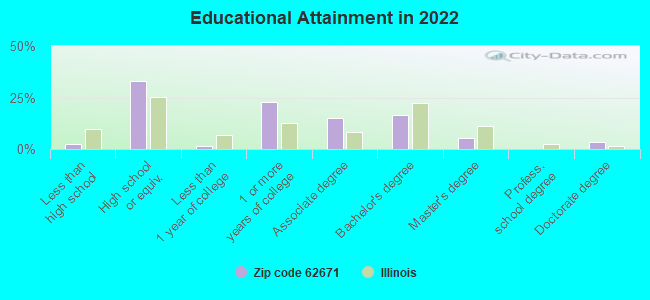
For population 25 years and over in 62671:
High school or higher: 96.5%
Bachelor's degree or higher: 25.2%
Graduate or professional degree: 9.0%
Unemployed: 3.5%
Mean travel time to work (commute): 22.9 minutes
For population 15 years and over in 62671:
Never married: 25.6%
Now married: 62.6%
Separated: 0.9%
Widowed: 5.1%
Divorced: 5.9%
Zip code 62671 compared to state average:
Median house value below state average.
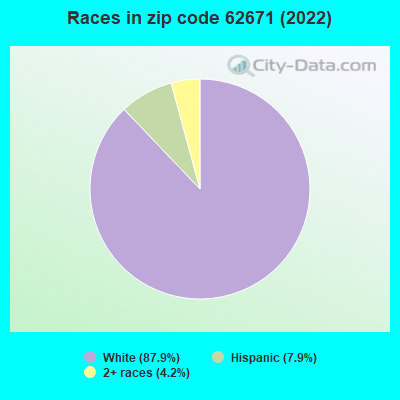
Black race population percentage significantly below state average.
Hispanic race population percentage below state average.
Foreign-born population percentage below state average.
Length of stay since moving in significantly above state average.
Estimated median house/condo value in 2022: $123,117
62671:
$123,117
Illinois:
$251,600
According to our research of Illinois and other state lists, there was 1 registered sex offender living in 62671 zip code as of May 28, 2024. The ratio of all residents to sex offenders in zip code 62671 is 440 to 1.
Median resident age:
This zip code:
40.1 years
Illinois median age:
39.1 years
Average household size:
This zip code:
2.3 people
Illinois:
2.4 people
Averages for the 2020 tax year for zip code 62671, filed in 2021:
Average Adjusted Gross Income (AGI) in 2020: $70,635 (Individual Income Tax Returns)
Here:
$70,635
State:
$82,626
Salary/wage: $45,864 (reported on 84.6% of returns)
Here:
$45,864
State:
$66,640
(% of AGI for various income ranges: 1160.0% for AGIs below $25k, 3932.0% for AGIs $25k-50k, 7463.3% for AGIs $50k-75k, 8610.0% for AGIs $75k-100k, 17915.0% for AGIs $100k-200k)
Taxable interest for individuals: $1,300 (reported on 42.3% of returns)
This zip code:
$1,300
Illinois:
$2,376
(% of AGI for various income ranges: 50.0% for AGIs below $25k, 43.3% for AGIs $50k-75k, 525.0% for AGIs $100k-200k)
Ordinary dividends: $3,820 (reported on 19.2% of returns)
Here:
$3,820
State:
$9,061
(% of AGI for various income ranges: 42.0% for AGIs below $25k, 850.0% for AGIs $100k-200k)
Net capital gain/loss in AGI: +$3,600 (reported on 19.2% of returns)
Here:
+$3,600
State:
+$31,684
(% of AGI for various income ranges: 10.0% for AGIs below $25k, 875.0% for AGIs $100k-200k)
Profit/loss from business: +$5,200 (reported on 7.7% of returns)
Here:
+$5,200
State:
+$12,175
(% of AGI for various income ranges: 208.0% for AGIs below $25k)
Earned income credit: $2,967 (reported on 11.5% of returns)
Here:
$2,967
State:
$2,311
(% of AGI for various income ranges: 178.0% for AGIs below $25k)
Percentage of individuals using paid preparers for their 2020 taxes: 100.0%
Here:
100%
State:
93%
(% for various income ranges: 100.0% for AGIs below $25k, 100.0% for AGIs $25k-50k, 100.0% for AGIs $50k-75k, 100.0% for AGIs $75k-100k, 100.0% for AGIs $100k-200k)
Averages for the 2012 tax year for zip code 62671, filed in 2013:
Average Adjusted Gross Income (AGI) in 2012: $56,532 (Individual Income Tax Returns)
Here:
$56,532
State:
$68,058
Salary/wage: $37,061 (reported on 82.1% of returns)
Here:
$37,061
State:
$55,396
(% of AGI for various income ranges: 78.8% for AGIs below $25k, 77.6% for AGIs $25k-50k, 70.3% for AGIs $50k-75k, 66.9% for AGIs $75k-100k, 34.3% for AGIs $100k-200k)
Taxable interest for individuals: $967 (reported on 42.9% of returns)
This zip code:
$967
Illinois:
$1,969
(% of AGI for various income ranges: 2.4% for AGIs below $25k, 1.0% for AGIs $50k-75k, 0.8% for AGIs $100k-200k)
Ordinary dividends: $900 (reported on 21.4% of returns)
Here:
$900
State:
$7,786
Net capital gain/loss in AGI: +$1,750 (reported on 14.3% of returns)
Here:
+$1,750
State:
+$22,183
Taxable individual retirement arrangement distribution: $9,150 (reported on 7.1% of returns)
62671:
$9,150
Illinois:
$17,929
Total itemized deductions: $14,580 (14% of AGI, reported on 17.9% of returns)
Here:
$14,580
State:
$26,433
Here:
13.8% of AGI
State:
19.2% of AGI
Charity contributions: $3,267 (reported on 10.7% of returns)
Here:
$3,267
State:
$4,525
Taxes paid: $7,625 (reported on 14.3% of returns)
62671:
$7,625
State:
$11,968
Earned income credit: $1,950 (reported on 14.3% of returns)
Here:
$1,950
State:
$2,349
(% of AGI for various income ranges: 5.9% for AGIs below $25k)
Percentage of individuals using paid preparers for their 2012 taxes: 78.6%
Here:
79%
State:
57%
(% for various income ranges: 72.7% for AGIs below $25k, 71.4% for AGIs $25k-50k, 125.0% for AGIs $50k-75k, 100.0% for AGIs $100k-200k)
Averages for the 2004 tax year for zip code 62671, filed in 2005:
Average Adjusted Gross Income (AGI) in 2004: $39,593 (Individual Income Tax Returns)
Here:
$39,593
State:
$54,625
Salary/wage: $30,426 (reported on 83.2% of returns)
Here:
$30,426
State:
$46,811
(% of AGI for various income ranges: 120.9% for AGIs below $10k, 73.0% for AGIs $10k-25k, 76.6% for AGIs $25k-50k, 68.6% for AGIs $50k-75k, 61.9% for AGIs $75k-100k, 32.7% for AGIs over 100k)
Taxable interest for individuals: $1,706 (reported on 50.2% of returns)
This zip code:
$1,706
Illinois:
$2,101
(% of AGI for various income ranges: 9.3% for AGIs below $10k, 3.2% for AGIs $10k-25k, 2.2% for AGIs $25k-50k, 2.2% for AGIs $50k-75k, 0.7% for AGIs $75k-100k, 2.0% for AGIs over 100k)
Taxable dividends: $1,738 (reported on 22.8% of returns)
Here:
$1,738
State:
$4,306
(% of AGI for various income ranges: 0.8% for AGIs $10k-25k, 0.2% for AGIs $25k-50k, 1.1% for AGIs $50k-75k, 2.8% for AGIs over 100k)
Net capital gain/loss: +$26 (reported on 13.3% of returns)
Here:
+$26
State:
+$17,321
Profit/loss from business: +$7,771 (reported on 12.3% of returns)
Here:
+$7,771
State:
+$11,771
Profit/loss from farming: +$35,275 (reported on 14.0% of returns)
Here:
+$35,275
State:
+$2,327
Total itemized deductions: $12,395 (23% of AGI, reported on 13.3% of returns)
Here:
$12,395
State:
$20,239
Here:
22.5% of AGI
State:
19.5% of AGI
Charity contributions deductions: $2,833 (6% of AGI, reported on 10.5% of returns)
Here:
$2,833
State:
$3,719
Here:
6.0% of AGI
State:
3.4% of AGI
Total tax: $5,949 (reported on 75.8% of returns)
62671:
$5,949
State:
$9,882
(% of AGI for various income ranges: 1.9% for AGIs below $10k, 5.1% for AGIs $10k-25k, 8.1% for AGIs $25k-50k, 10.1% for AGIs $50k-75k, 12.2% for AGIs $75k-100k, 20.8% for AGIs over 100k)
Earned income credit: $1,500 (reported on 11.9% of returns)
Here:
$1,500
State:
$1,788
Percentage of individuals using paid preparers for their 2004 taxes: 80.7%
Here:
81%
State:
61%
(% for various income ranges: 68.8% for AGIs below $10k, 78.5% for AGIs $10k-25k, 82.3% for AGIs $25k-50k, 86.0% for AGIs $50k-75k, 95.7% for AGIs $75k-100k, 92.9% for AGIs over 100k)
Household received Food Stamps/SNAP in the past 12 months: 24 Household did not receive Food Stamps/SNAP in the past 12 months: 198
Women who had a birth in the past 12 months: 8 (2 now married, 5 unmarried) Women who did not have a birth in the past 12 months: 74 (37 now married, 36 unmarried)
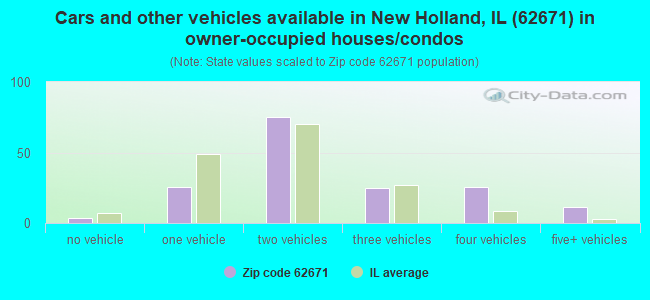
Housing units in zip code 62671 with a mortgage: 74 (11 second mortgage, 11 both second mortgage and home equity loan) Median monthly owner costs for units with a mortgage: $1,056 Median monthly owner costs for units without a mortgage: $657
Residents with income below the poverty level in 2022:
This zip code:
5.1%
Whole state:
11.9%
Residents with income below 50% of the poverty level in 2022:
This zip code:
0.7%
Whole state:
5.7%
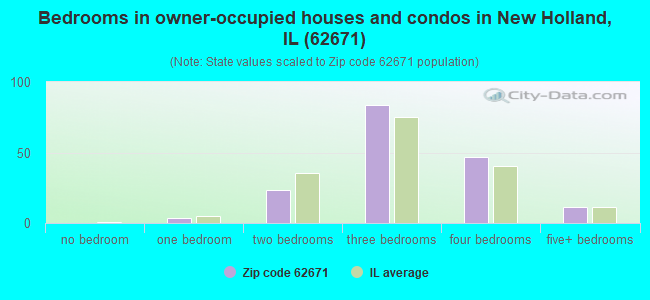
Median number of rooms in houses and condos:
Here:
6.8
State:
6.4
Median number of rooms in apartments:
Here:
4.9
State:
4.1
Notable locations in this zip code not listed on our city pages
Cemeteries: Pool Hill Cemetery (1), Stephen's Cemetery (2), Pleasant Valley Cemetery (3), Richmond Grove Cemetery (4). Display/hide their locations on the map
Size of family households: 68 2-persons, 28 3-persons, 25 4-persons, 16 5-persons, 4 6-persons, 3 7-or-more-persons
Size of nonfamily households: 69 1-person, 4 2-persons, 3 3-persons
103 married couples with children.
15 single-parent households (7 men, 8 women).
94.6% of residents of 62671 zip code speak English at home.
3.8% of residents speak Spanish at home (100% very well).
0.4% of residents speak other Indo-European language at home (100% very well).
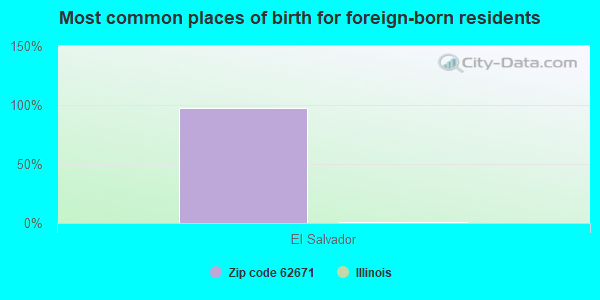
Foreign born population: 43 (8.3%) (97.7% of them are naturalized citizens)
This zip code:
8.3%
Whole state:
14.4%
98%El Salvador
42%German
10%Irish
9%American
7%English
6%Welsh
2%European
2%Scotch-Irish
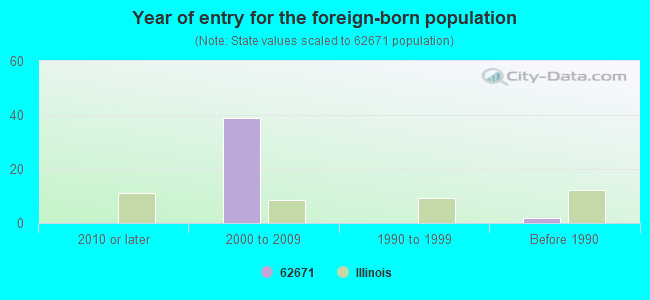
Year of entry for the foreign-born population
02010 or later
392000 to 2009
01990 to 1999
2Before 1990
Facilities with environmental interests located in this zip code:
AG LAND FS INC (RT 10 EAST in NEW HOLLAND, IL)
STATE MASTER (Illinois EPA Project) - AIR PROGRAM STATE MASTER (Illinois EPA Project) - SOLID WASTE PROGRAM AIR MINOR (AIRS/AFS) Business SIC classification: FERTILIZERS, MIXING ONLY
LOGAN FS INC (ROUTE 1 in NEW HOLLAND, IL)
STATE MASTER (Illinois EPA Project) - AIR PROGRAM AIR MINOR (AIRS/AFS) (Resource Conservation and Recovery Act (tracking hazardous waste)) Business SIC classification: FARM SUPPLIES
HAWES CC IMPLEMENT CO (RTE 10 PO BOX 148 in NEW HOLLAND, IL)
Conditionally Exempt Small Quantity Generators, less than 100 kg/month of hazardous waste (Resource Conservation and Recovery Act (tracking hazardous waste)) Organizations: HAWES CC IMPT CO (CONTACT/OWNER)
ILDOT BRG 054 0009 (IL RTE 10 OVER SUGAR CREEK in NEW HOLLAND, IL)
Conditionally Exempt Small Quantity Generators, less than 100 kg/month of hazardous waste (Resource Conservation and Recovery Act (tracking hazardous waste)) - notification
AG LAND F.S. INC.- NEW HOLLAND (153 RT. 10 in NEW HOLLAND, IL)
ENFORCEMENT/COMPLIANCE ACTIVITY (Integrated Compliance Information System)
NEW HOLLAND-MIDDLETOWN CUSD 22 (BOX 8 in NEW HOLLAND, IL)
COMPLIANCE ACTIVITY (Tracking inspections of insecticide, fungicide, and rodenticide, and toxic substances)
Housing units lacking complete plumbing facilities: 1.8% Housing units lacking complete kitchen facilities: 3.9%
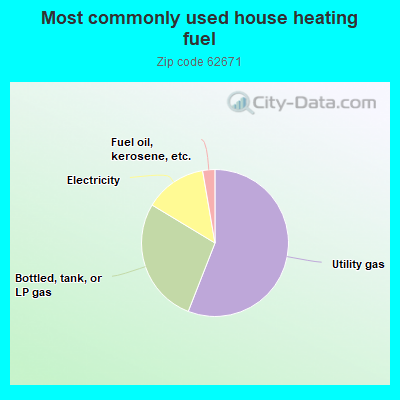
56.1%Utility gas
27.8%Bottled, tank, or LP gas
13.7%Electricity
2.7%Fuel oil, kerosene, etc.
Population in 1990: 663. Population change in the 1990s: +98 (+14.8%).
Place of birth for U.S.-born residents:
This state: 436
Northeast: 2
Midwest: 10
South: 12
West: 14
72% of the 62671 zip code residents lived in the same house 5 years ago. Out of people who lived in different houses, 55% lived in this county. Out of people who lived in different counties, 50% lived in Illinois.
96% of the 62671 zip code residents lived in the same house 1 year ago. Out of people who lived in different houses, 57% moved from this county. Out of people who lived in different houses, 21% moved from different county within same state. Out of people who lived in different houses, 21% moved from different state.
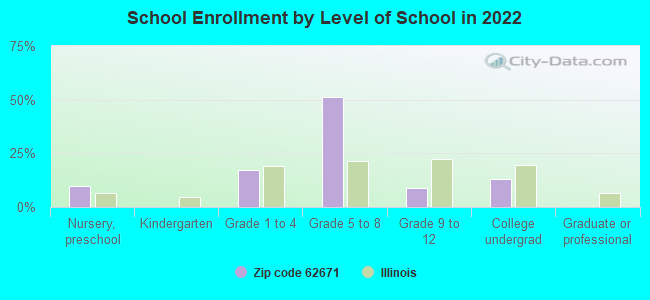
Private vs. public school enrollment:
Students in private schools in grades 1 to 8 (elementary and middle school): 8
Here:
9.8%
Illinois:
13.3%
Students in private schools in grades 9 to 12 (high school):
Here:
0.0%
Illinois:
9.9%
Students in private undergraduate colleges: 8
Here:
49.8%
Illinois:
27.4%
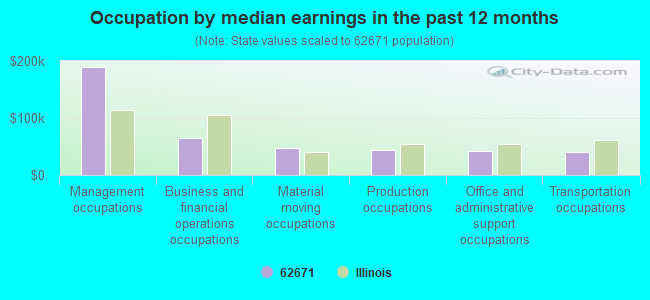
Occupation by median earnings in the past 12 months ($)
190,284Management occupations
65,099Business and financial operations occupations
47,635Material moving occupations
44,549Production occupations
42,032Office and administrative support occupations
39,744Transportation occupations
Top industries in this zip code by the number of employees in 2005:
Wholesale Trade: Farm and Garden Machinery and Equipment Merchant Wholesalers (10-19 employees: 1 establishment)
Wholesale Trade: Grain and Field Bean Merchant Wholesalers (10-19: 1)
Finance and Insurance: Commercial Banking (5-9: 1)
Other Services (except Public Administration): Religious Organizations (1-4: 1)
Other Services (except Public Administration): General Automotive Repair (1-4: 1)
Arts, Entertainment, and Recreation: All Other Amusement and Recreation Industries (1-4: 1)
2002 - 2018 National Fire Incident Reporting System (NFIRS) incidents
Based on the data from the years 2002 - 2018 the average number of fires per year is 7. The highest number of fire incidents - 19 took place in 2010, and the least - 1 in 2004. The data has a decreasing trend.
When looking into fire subcategories, the most incidents belonged to: Outside Fires (40.8%), and Structure Fires (40.0%).
Fire incident types reported to NFIRS in Zip Code 62671

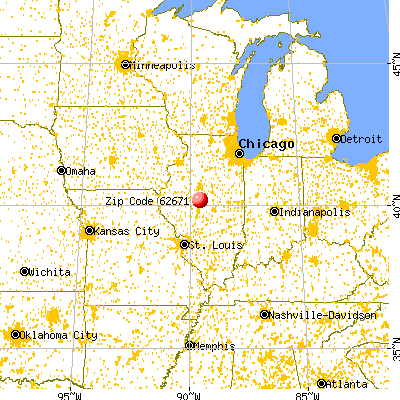


 Nearest zip codes: 62666, 62643, 62682, 62635, 62664, 62642.
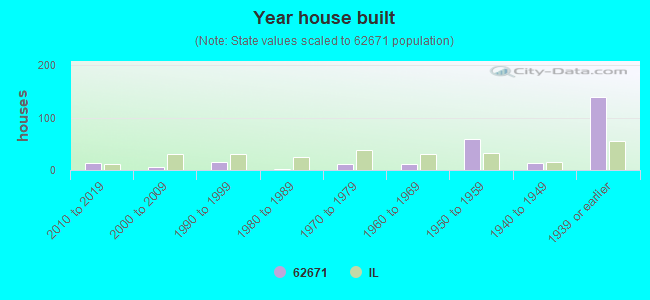


 Based on the data from the years 2002 - 2018 the average number of fires per year is 7. The highest number of fire incidents - 19 took place in 2010, and the least - 1 in 2004. The data has a decreasing trend.
 When looking into fire subcategories, the most incidents belonged to: Outside Fires (40.8%), and Structure Fires (40.0%).