Estimated zip code population in 2022: 5,638 Zip code population in 2010: 5,602 Zip code population in 2000: 5,089
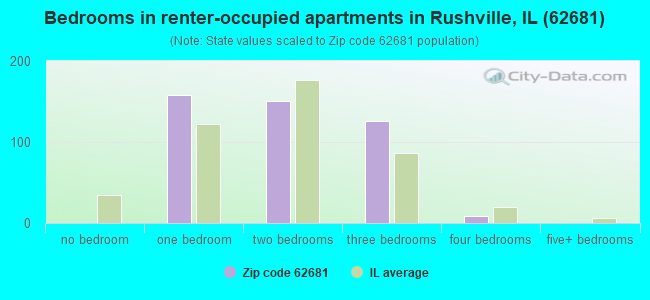
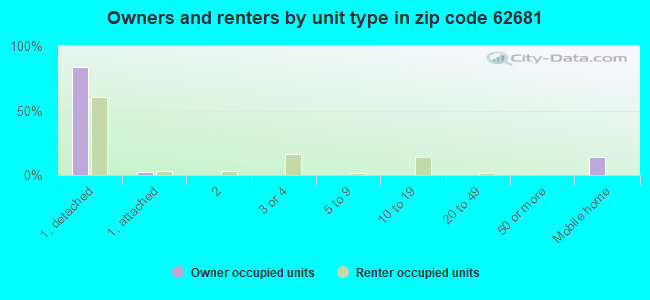
Houses and condos: 2,545 Renter-occupied apartments: 451
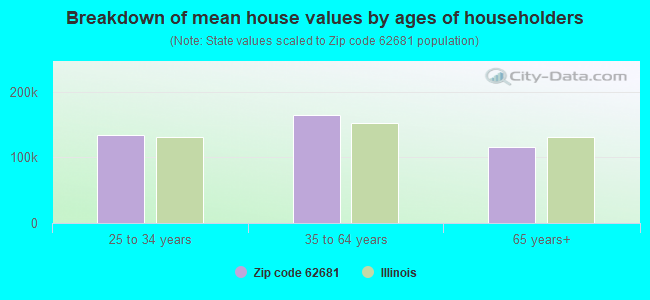
% of renters here:
20%
State:
33%
March 2022 cost of living index in zip code 62681: 74.6 (low, U.S. average is 100)
Land area: 173.2 sq. mi. Water area: 0.7 sq. mi.
Population density: 33 people per square mile
(very low).
OSM Map
General Map
Google Map
MSN Map
OSM Map
General Map
Google Map
MSN Map
OSM Map
General Map
Google Map
MSN Map
OSM Map
General Map
Google Map
MSN Map
Please wait while loading the map...
Real estate property taxes paid for housing units in 2022:
This zip code:
1.7% ($1,862)
Illinois:
2.0% ($4,912)
Median real estate property taxes paid for housing units with mortgages in 2022: $2,267 (1.8%) Median real estate property taxes paid for housing units with no mortgage in 2022: $1,533 (1.6%)
Averages for the 2020 tax year for zip code 62681, filed in 2021:
Average Adjusted Gross Income (AGI) in 2020: $57,614 (Individual Income Tax Returns)
Here:
$57,614
State:
$82,626
Salary/wage: $45,112 (reported on 79.4% of returns)
Here:
$45,112
State:
$66,640
(% of AGI for various income ranges: 1169.1% for AGIs below $25k, 3486.5% for AGIs $25k-50k, 5828.9% for AGIs $50k-75k, 8764.1% for AGIs $75k-100k, 15578.8% for AGIs $100k-200k)
Taxable interest for individuals: $1,000 (reported on 37.4% of returns)
This zip code:
$1,000
Illinois:
$2,376
(% of AGI for various income ranges: 23.2% for AGIs below $25k, 31.6% for AGIs $25k-50k, 42.9% for AGIs $50k-75k, 68.8% for AGIs $75k-100k, 164.4% for AGIs $100k-200k)
Ordinary dividends: $3,574 (reported on 14.0% of returns)
Here:
$3,574
State:
$9,061
(% of AGI for various income ranges: 13.4% for AGIs below $25k, 36.7% for AGIs $25k-50k, 50.0% for AGIs $50k-75k, 97.6% for AGIs $75k-100k, 302.5% for AGIs $100k-200k)
Net capital gain/loss in AGI: +$7,950 (reported on 13.2% of returns)
Here:
+$7,950
State:
+$31,684
(% of AGI for various income ranges: 6.2% for AGIs below $25k, 36.5% for AGIs $25k-50k, 29.3% for AGIs $50k-75k, 130.6% for AGIs $75k-100k, 358.1% for AGIs $100k-200k)
Profit/loss from business: +$6,115 (reported on 14.0% of returns)
Here:
+$6,115
State:
+$12,175
(% of AGI for various income ranges: 38.7% for AGIs below $25k, 75.9% for AGIs $25k-50k, 91.4% for AGIs $50k-75k, 202.9% for AGIs $75k-100k, 563.1% for AGIs $100k-200k)
Taxable individual retirement arrangement distribution: $10,084 (reported on 10.3% of returns)
62681:
$10,084
Illinois:
$21,613
(% of AGI for various income ranges: 39.1% for AGIs below $25k, 104.5% for AGIs $25k-50k, 147.9% for AGIs $50k-75k, 275.9% for AGIs $75k-100k, 574.4% for AGIs $100k-200k)
Total itemized deductions: $35,100 (reported on 1.6% of returns)
Here:
$35,100
State:
$34,948
(% of AGI for various income ranges: 877.5% for AGIs $100k-200k)
Charity contributions: $11,667 (reported on 1.2% of returns)
Here:
$11,667
State:
$13,122
(% of AGI for various income ranges: 218.8% for AGIs $100k-200k)
Taxes paid: $7,750 (reported on 1.6% of returns)
62681:
$7,750
State:
$8,563
(% of AGI for various income ranges: 193.8% for AGIs $100k-200k)
Earned income credit: $2,184 (reported on 15.6% of returns)
Here:
$2,184
State:
$2,311
(% of AGI for various income ranges: 89.4% for AGIs below $25k, 72.7% for AGIs $25k-50k)
Percentage of individuals using paid preparers for their 2020 taxes: 90.5%
Here:
91%
State:
93%
(% for various income ranges: 86.1% for AGIs below $25k, 92.1% for AGIs $25k-50k, 90.0% for AGIs $50k-75k, 92.6% for AGIs $75k-100k, 96.6% for AGIs $100k-200k, 100.0% for AGIs over 200k)
Averages for the 2012 tax year for zip code 62681, filed in 2013:
Average Adjusted Gross Income (AGI) in 2012: $47,879 (Individual Income Tax Returns)
Here:
$47,879
State:
$68,058
Salary/wage: $39,131 (reported on 82.7% of returns)
Here:
$39,131
State:
$55,396
(% of AGI for various income ranges: 74.5% for AGIs below $25k, 78.0% for AGIs $25k-50k, 70.5% for AGIs $50k-75k, 73.3% for AGIs $75k-100k, 63.5% for AGIs $100k-200k, 39.8% for AGIs over 200k)
Taxable interest for individuals: $1,249 (reported on 36.7% of returns)
This zip code:
$1,249
Illinois:
$1,969
(% of AGI for various income ranges: 1.8% for AGIs below $25k, 0.8% for AGIs $25k-50k, 0.9% for AGIs $50k-75k, 0.8% for AGIs $75k-100k, 1.0% for AGIs $100k-200k, 0.7% for AGIs over 200k)
Ordinary dividends: $2,729 (reported on 13.7% of returns)
Here:
$2,729
State:
$7,786
(% of AGI for various income ranges: 0.7% for AGIs below $25k, 0.5% for AGIs $25k-50k, 0.6% for AGIs $50k-75k, 0.4% for AGIs $75k-100k, 1.5% for AGIs $100k-200k, 0.7% for AGIs over 200k)
Net capital gain/loss in AGI: +$10,971 (reported on 12.5% of returns)
Here:
+$10,971
State:
+$22,183
(% of AGI for various income ranges: 0.1% for AGIs $25k-50k, 0.8% for AGIs $50k-75k, 0.8% for AGIs $75k-100k, 2.9% for AGIs $100k-200k, 16.0% for AGIs over 200k)
Profit/loss from business: +$11,112 (reported on 16.1% of returns)
Here:
+$11,112
State:
+$12,903
(% of AGI for various income ranges: 5.0% for AGIs below $25k, 3.0% for AGIs $25k-50k, 2.7% for AGIs $50k-75k, 2.6% for AGIs $75k-100k, 8.0% for AGIs $100k-200k)
Taxable individual retirement arrangement distribution: $8,142 (reported on 9.7% of returns)
62681:
$8,142
Illinois:
$17,929
(% of AGI for various income ranges: 3.0% for AGIs below $25k, 1.3% for AGIs $25k-50k, 1.1% for AGIs $50k-75k, 1.2% for AGIs $75k-100k, 3.1% for AGIs $100k-200k)
Total itemized deductions: $19,288 (21% of AGI, reported on 19.4% of returns)
Here:
$19,288
State:
$26,433
Here:
20.6% of AGI
State:
19.2% of AGI
(% of AGI for various income ranges: 4.4% for AGIs below $25k, 8.7% for AGIs $25k-50k, 6.6% for AGIs $50k-75k, 7.1% for AGIs $75k-100k, 10.2% for AGIs $100k-200k, 8.3% for AGIs over 200k)
Charity contributions: $3,755 (reported on 13.3% of returns)
Here:
$3,755
State:
$4,525
(% of AGI for various income ranges: 0.9% for AGIs $25k-50k, 0.9% for AGIs $50k-75k, 0.9% for AGIs $75k-100k, 1.3% for AGIs $100k-200k, 2.0% for AGIs over 200k)
Taxes paid: $6,775 (reported on 19.4% of returns)
62681:
$6,775
State:
$11,968
(% of AGI for various income ranges: 0.7% for AGIs below $25k, 1.5% for AGIs $25k-50k, 1.9% for AGIs $50k-75k, 2.8% for AGIs $75k-100k, 4.6% for AGIs $100k-200k, 4.6% for AGIs over 200k)
Earned income credit: $2,029 (reported on 16.9% of returns)
Here:
$2,029
State:
$2,349
(% of AGI for various income ranges: 5.0% for AGIs below $25k, 1.2% for AGIs $25k-50k)
Percentage of individuals using paid preparers for their 2012 taxes: 62.5%
Here:
62%
State:
57%
(% for various income ranges: 55.7% for AGIs below $25k, 62.3% for AGIs $25k-50k, 63.6% for AGIs $50k-75k, 69.6% for AGIs $75k-100k, 78.9% for AGIs $100k-200k, 100.0% for AGIs over 200k)
Averages for the 2004 tax year for zip code 62681, filed in 2005:
Average Adjusted Gross Income (AGI) in 2004: $35,572 (Individual Income Tax Returns)
Here:
$35,572
State:
$54,625
Salary/wage: $29,646 (reported on 82.8% of returns)
Here:
$29,646
State:
$46,811
(% of AGI for various income ranges: 94.6% for AGIs below $10k, 75.0% for AGIs $10k-25k, 75.0% for AGIs $25k-50k, 73.2% for AGIs $50k-75k, 70.9% for AGIs $75k-100k, 43.9% for AGIs over 100k)
Taxable interest for individuals: $1,986 (reported on 45.5% of returns)
This zip code:
$1,986
Illinois:
$2,101
(% of AGI for various income ranges: 8.3% for AGIs below $10k, 3.0% for AGIs $10k-25k, 1.9% for AGIs $25k-50k, 1.9% for AGIs $50k-75k, 2.8% for AGIs $75k-100k, 3.1% for AGIs over 100k)
Taxable dividends: $2,608 (reported on 17.2% of returns)
Here:
$2,608
State:
$4,306
(% of AGI for various income ranges: 1.5% for AGIs below $10k, 0.9% for AGIs $10k-25k, 0.8% for AGIs $25k-50k, 1.2% for AGIs $50k-75k, 1.5% for AGIs $75k-100k, 2.1% for AGIs over 100k)
Net capital gain/loss: +$9,930 (reported on 15.1% of returns)
Here:
+$9,930
State:
+$17,321
(% of AGI for various income ranges: 2.3% for AGIs below $10k, 1.2% for AGIs $10k-25k, 1.0% for AGIs $25k-50k, 1.8% for AGIs $50k-75k, 1.8% for AGIs $75k-100k, 17.1% for AGIs over 100k)
Profit/loss from business: +$12,499 (reported on 15.9% of returns)
Here:
+$12,499
State:
+$11,771
(% of AGI for various income ranges: 5.3% for AGIs below $10k, 4.3% for AGIs $10k-25k, 3.8% for AGIs $25k-50k, 3.6% for AGIs $50k-75k, 2.7% for AGIs $75k-100k, 14.6% for AGIs over 100k)
Profit/loss from farming: +$2,557 (reported on 7.5% of returns)
Here:
+$2,557
State:
+$2,327
(% of AGI for various income ranges: -1.8% for AGIs below $10k, -1.1% for AGIs $10k-25k, 1.6% for AGIs $25k-50k, 1.1% for AGIs $50k-75k, 0.2% for AGIs $75k-100k, -0.1% for AGIs over 100k)
IRA payment deduction: $3,308 (reported on 2.1% of returns)
62681:
$3,308
Illinois:
$3,087
(% of AGI for various income ranges: 0.2% for AGIs $10k-25k, 0.2% for AGIs $25k-50k, 0.2% for AGIs $50k-75k, 0.4% for AGIs $75k-100k)
Self-employed pension: $17,300 (reported on 0.4% of returns)
Here:
$17,300
Illinois:
$16,965
Total itemized deductions: $15,894 (22% of AGI, reported on 16.2% of returns)
Here:
$15,894
State:
$20,239
Here:
22.5% of AGI
State:
19.5% of AGI
(% of AGI for various income ranges: 5.8% for AGIs $10k-25k, 6.2% for AGIs $25k-50k, 6.9% for AGIs $50k-75k, 9.3% for AGIs $75k-100k, 9.6% for AGIs over 100k)
Charity contributions deductions: $4,117 (6% of AGI, reported on 12.9% of returns)
Here:
$4,117
State:
$3,719
Here:
5.5% of AGI
State:
3.4% of AGI
(% of AGI for various income ranges: 0.7% for AGIs $10k-25k, 0.9% for AGIs $25k-50k, 1.2% for AGIs $50k-75k, 1.6% for AGIs $75k-100k, 3.6% for AGIs over 100k)
Total tax: $4,557 (reported on 74.1% of returns)
62681:
$4,557
State:
$9,882
(% of AGI for various income ranges: 2.7% for AGIs below $10k, 4.2% for AGIs $10k-25k, 6.8% for AGIs $25k-50k, 9.0% for AGIs $50k-75k, 10.8% for AGIs $75k-100k, 18.0% for AGIs over 100k)
Earned income credit: $1,531 (reported on 16.2% of returns)
Here:
$1,531
State:
$1,788
Percentage of individuals using paid preparers for their 2004 taxes: 65.7%
Here:
66%
State:
61%
(% for various income ranges: 55.2% for AGIs below $10k, 63.1% for AGIs $10k-25k, 67.6% for AGIs $25k-50k, 74.2% for AGIs $50k-75k, 74.8% for AGIs $75k-100k, 84.4% for AGIs over 100k)
Household received Food Stamps/SNAP in the past 12 months: 202 Household did not receive Food Stamps/SNAP in the past 12 months: 1,994
Women who had a birth in the past 12 months: 55 (26 now married, 29 unmarried) Women who did not have a birth in the past 12 months: 862 (441 now married, 417 unmarried)
Housing units in zip code 62681 with a mortgage: 832 (31 second mortgage, 6 home equity loan, 13 both second mortgage and home equity loan) Houses without a mortgage: 45
Median monthly owner costs for units with a mortgage: $1,080 Median monthly owner costs for units without a mortgage: $465
Residents with income below the poverty level in 2022:
This zip code:
21.4%
Whole state:
11.9%
Residents with income below 50% of the poverty level in 2022:
This zip code:
7.8%
Whole state:
5.7%
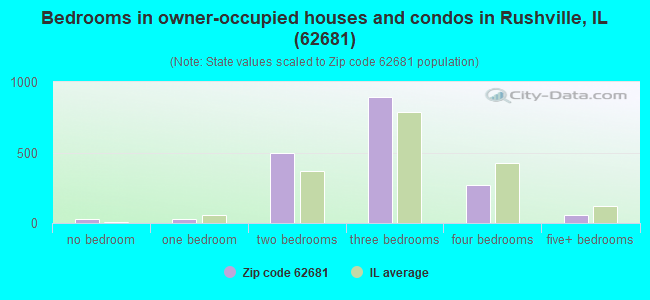
Median number of rooms in houses and condos:
Here:
6.3
State:
6.4
Median number of rooms in apartments:
Here:
4.6
State:
4.1
Notable locations in this zip code not listed on our city pages
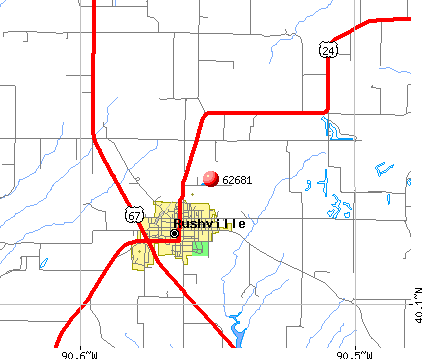
Notable locations in zip code 62681: Schuyler County Courthouse (A), Woodstock Townhall (B), Rushville City Hall (C), Rushville Public Library (D), Schuyler County Ambulance Service / Schuyler County Rescue (E), Schuyler County Fire Protection District (F), Rushville Fire Department (G). Display/hide their locations on the map
Churches in zip code 62681 include: Church of Christ (A), Church of the Nazarene (B), First Christian Church (C), First Southern Baptist Church (D), First United Methodist Church (E), First United Presbyterian Church (F), Free Methodist Church (G), Saint Johns Lutheran Church (H), Saint Rose Catholic Church (I). Display/hide their locations on the map
Cemeteries: Adams Cemetery (1), Bauer Cemetery (2), Bethany Cemetery (3), Black Cemetery (4), Boling Cemetery (5), Burnsides Cemetery (6), Burress Cemetery (7). Display/hide their locations on the map
Streams, rivers, and creeks: Shelby Creek (A), Brushy Branch (B), East Fork Crane Creek (C), Bauer Branch (D), McKee Branch (E), West Creek (F), West Branch Sugar Creek (G), Sand Branch (H), Ryan Branch (I). Display/hide their locations on the map
Parks in zip code 62681 include: Scripps Park (1), Schuy-Rush Park (2), Schuyler County Fairground (3), Public Square (4). Display/hide their locations on the map
In group quarters: 781 (-1 institutionalized population)
Size of family households: 646 2-persons, 245 3-persons, 206 4-persons, 107 5-persons, 42 6-persons, 12 7-or-more-persons
Size of nonfamily households: 696 1-person, 254 2-persons, 12 5-persons
630 married couples with children.
209 single-parent households (53 men, 156 women).
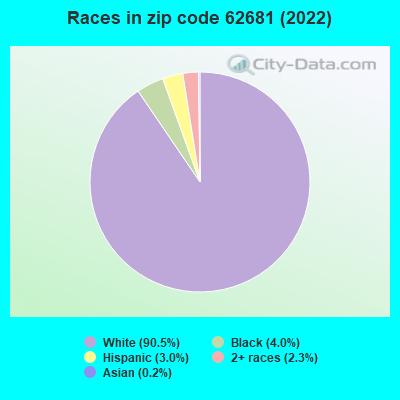
96.5% of residents of 62681 zip code speak English at home.
1.7% of residents speak Spanish at home (100% very well).
1.6% of residents speak other Indo-European language at home (33% very well, 38% not well, 29% not at all).
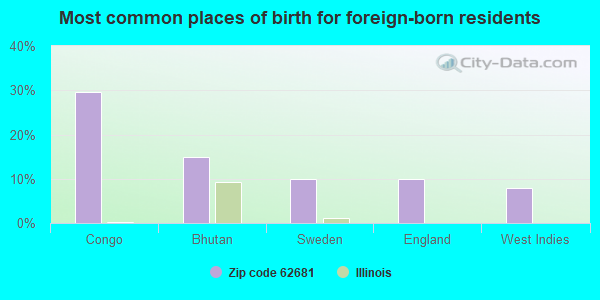
Foreign born population: 101 (1.8%) (42.8% of them are naturalized citizens)
This zip code:
1.8%
Whole state:
14.4%
30%Congo
15%Bhutan
10%Sweden
10%England
8%West Indies
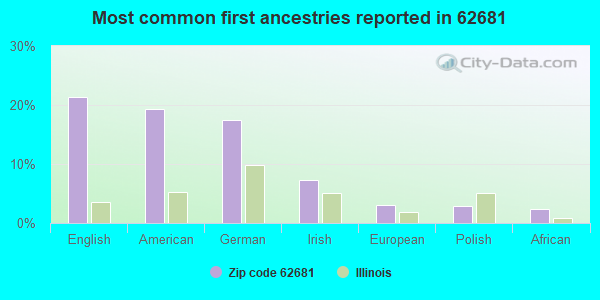
21%English
19%American
17%German
7%Irish
3%European
3%Polish
2%African
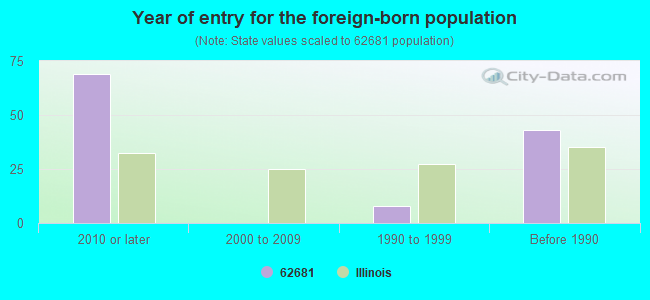
Year of entry for the foreign-born population
692010 or later
02000 to 2009
81990 to 1999
43Before 1990
Major facilities with environmental interests located in this zip code:
RUSHVILLE, CITY OF (220 W WASHINGTON ST in RUSHVILLE, IL)
STATE MASTER (Illinois EPA Project) - HAZARDOUS WASTE PROGRAM STATE MASTER (Illinois EPA Project) - National Pollutant Discharge Elimination System Permit Large Quantity Generators, more that 1000 kg of hazardous waste/month (Resource Conservation and Recovery Act (tracking hazardous waste)) - notification Organizations: RUSHVILLE CITY OF (CONTACT/OWNER)
RUSHVILLE STP (SOUTH LIBERTY STREET in RUSHVILLE, IL)
STATE MASTER (Illinois EPA Project) - National Pollutant Discharge Elimination System Permit National Pollutant Discharge Elimination System NON-MAJOR (Tracking pollutant discharge elimination systems) - permit National Pollutant Discharge Elimination System NON-MAJOR (Tracking pollutant discharge elimination systems) - permit Business SIC classification: SEWERAGE SYSTEMS Alternative names: RUSHVILLE STP, CITY OF
IL DOT (705 WILSON in RUSHVILLE, IL)
STATE MASTER (Illinois EPA Project) - HAZARDOUS WASTE PROGRAM, AIR PROGRAM AIR MINOR (AIRS/AFS) Small Quantity Generators, between 100 kg and 1000 kg of hazardous waste/month (Resource Conservation and Recovery Act (tracking hazardous waste)) - notification Business SIC classification: REGULATION AND ADMINISTRATION OF TRANSPORTATION PROGRAMS Organizations: ILDOT DIST 6 (CONTACT/OWNER)
Alternative names: ILDOT DIST 6
CLINARD READY MIX CO (RT 24E, NORTH CITY LIMITS in RUSHVILLE, IL)
STATE MASTER (Illinois EPA Project) - National Pollutant Discharge Elimination System Permit National Pollutant Discharge Elimination System NON-MAJOR (Tracking pollutant discharge elimination systems) - permit Organizations: CLINARD READY MIX CO. (CONTACT/OWNER)
, CLINARD READY MIX, CO. (CONTACT/OWNER)
Alternative names: CLINARD READY MIX-RUSHVILLE
RUSHVILLE JR. HIGH SCHOOL - DISTRICT 1 (RURAL ROUTE 3 in RUSHVILLE, IL)
STATE MASTER (Illinois EPA Project) - AIR PROGRAM AIR MINOR (AIRS/AFS) CRITERIA AND HAZARDOUS AIR POLLUTANT INVENTORY (Inventory of air pollution sources) Business SIC and NAICS classification: ELEMENTARY AND SECONDARY SCHOOLS Alternative names: SCHUYLER C.U. DISTRICT #1
H E JACOBUS &SON (S. ELM ST. in RUSHVILLE, IL)
STATE MASTER (Illinois EPA Project) - AIR PROGRAM AIR MINOR (AIRS/AFS) Business SIC classification: PETROLEUM BULK STATIONS AND TERMINALS
ILLINOIS YOUTH CENTER RUSHVILLE (COUNTY FARM & HORNEY BRANCH RD in RUSHVILLE, IL)
STATE MASTER (Illinois EPA Project) - AIR PROGRAM AIR MINOR (AIRS/AFS) Business SIC classification: CORRECTIONAL INSTITUTIONS
ROBERTS PERFORMANCE MACHINE (203 W ADAMS in RUSHVILLE, IL)
STATE MASTER (Illinois EPA Project) - HAZARDOUS WASTE PROGRAM Conditionally Exempt Small Quantity Generators, less than 100 kg/month of hazardous waste (Resource Conservation and Recovery Act (tracking hazardous waste)) Organizations: ROBERTS PERFORMANCE & MACHINE (CONTACT/OPERATOR)
Alternative names: ROBERTS PERFORMANCE & MACHINE
RUSHVILLE NORGE VILLAGE (231 N LIBERTY in RUSHVILLE, IL)
STATE MASTER (Illinois EPA Project) - AIR PROGRAM AIR MINOR (AIRS/AFS) Business SIC classification: DRYCLEANING PLANTS, EXCEPT RUG CLEANING
RUSHVILLE WTP (HILLTOP TANK ROAD in RUSHVILLE, IL)
STATE MASTER (Illinois EPA Project) - National Pollutant Discharge Elimination System Permit National Pollutant Discharge Elimination System NON-MAJOR (Tracking pollutant discharge elimination systems) - permit Business SIC classification: WATER SUPPLY Alternative names: RUSHVILLE WTP, CITY OF
CLINARD READY MIX INC (RR 1 in RUSHVILLE, IL)
STATE MASTER (Illinois EPA Project) - AIR PROGRAM AIR MINOR (AIRS/AFS) Business SIC classification: READY-MIXED CONCRETE
RUSHVILLE HIGH SCHOOL (730 N CONGRESS ST in RUSHVILLE, IL)
(Geographic Names Information System) (National Center for Education Statistics) - STATE ID-2208500100001 Organizations: SCHUYLER CO C U SCH DIST 1 (SCHOOL DISTRICT)
L & N INDUSTRIES (RT 24 E OUT OF RUSHVILLE 8 MI. in RUSHVILLE, IL)
National Pollutant Discharge Elimination System NON-MAJOR (Tracking pollutant discharge elimination systems) - permit
Housing units lacking complete plumbing facilities: 1.5% Housing units lacking complete kitchen facilities: 4.0%
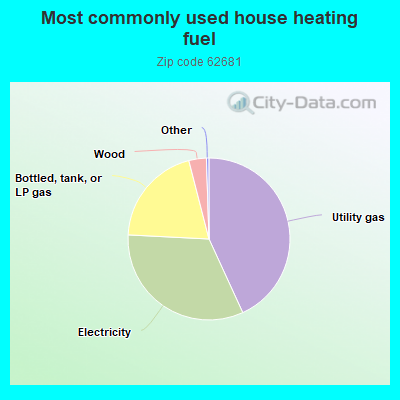
43.2%Utility gas
32.7%Electricity
20.2%Bottled, tank, or LP gas
3.5%Wood
Population in 1990: 4,747. Population change in the 1990s: +342 (+7.2%).
Place of birth for U.S.-born residents:
This state: 4,641
Northeast: 58
Midwest: 375
South: 223
West: 206
64% of the 62681 zip code residents lived in the same house 5 years ago. Out of people who lived in different houses, 60% lived in this county. Out of people who lived in different counties, 50% lived in Illinois.
89% of the 62681 zip code residents lived in the same house 1 year ago. Out of people who lived in different houses, 48% moved from this county. Out of people who lived in different houses, 42% moved from different county within same state. Out of people who lived in different houses, 6% moved from different state. Out of people who lived in different houses, 5% moved from abroad.
Private vs. public school enrollment:
Students in private schools in grades 1 to 8 (elementary and middle school): 80
Here:
15.3%
Illinois:
13.3%
Students in private schools in grades 9 to 12 (high school): 5
Here:
2.5%
Illinois:
9.9%
Students in private undergraduate colleges:
Here:
0.0%
Illinois:
27.4%
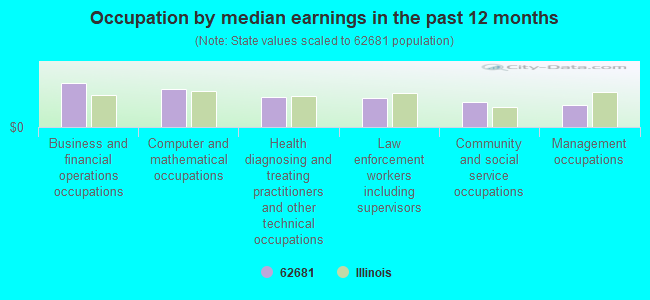
Occupation by median earnings in the past 12 months ($)
112,292Business and financial operations occupations
97,810Computer and mathematical occupations
75,854Health diagnosing and treating practitioners and other technical occupations
74,732Law enforcement workers including supervisors
63,181Community and social service occupations
56,988Management occupations
Companies with federal contracts located in this zip code:
STRONG OIL COMPANY INC (300 ELM ST in RUSHVILLE, IL) : $61,738 in 7 contractsfrom 2002 to 2004
Contracts for Petroleum Production and Distribution Equipment, Fuel Oils, Oils and Greases: Cutting, Lubricating, and Hydraulic by Army, U.S. Army Corps of Engineers - civil program financing only Signed by year:2000: $0; 2001: $0; 2002: $12,738; 2003: $9,000; 2004: $40,000; 2005: $0; 2006: $0.
Biggest contracts:
$12,000 with Army for Petroleum Production and Distribution Equipment. Signed on 2004-01-23. Completion date: 2004-01-22.
$12,000 with U.S. Army Corps of Engineers - civil program financing only for Petroleum Production and Distribution Equipment. Signed on 2004-01-23. Completion date: 2004-01-22.
$9,000, same as above.Signed on 2003-08-12. Completion date: 2003-08-11.
$8,000, same as above.Signed on 2004-12-01. Completion date: 2004-11-05.
Top industries in this zip code by the number of employees in 2005:
Wholesale Trade: Grain and Field Bean Merchant Wholesalers (100-249 employees: 1 establishment)
Health Care and Social Assistance: General Medical and Surgical Hospitals (100-249: 1)
Health Care and Social Assistance: Nursing Care Facilities (50-99: 1)
Finance and Insurance: Commercial Banking (10-19: 2, 5-9: 2)
Professional, Scientific, and Technical Services: Offices of Lawyers (20-49: 1, 1-4: 4)
People in group quarters in 2010:
396 people in residential treatment centers for adults
57 people in nursing facilities/skilled-nursing facilities
10 people in local jails and other municipal confinement facilities
People in group quarters in 2000:
81 people in nursing homes
18 people in other group homes
6 people in local jails and other confinement facilities (including police lockups)
Fatal accident statistics in 2013:
Fatal accident count: 1
Vehicles involved in fatal accidents: 2
Fatal accidents caused by drunken drivers: 0
Fatalities: 1
Persons involved in fatal accidents: 2
Pedestrians involved in fatal accidents: 0
Fatal accident statistics in 2011:
Fatal accident count: 1
Vehicles involved in fatal accidents: 1
Fatal accidents caused by drunken drivers: 1
Fatalities: 1
Persons involved in fatal accidents: 1
Pedestrians involved in fatal accidents: 0
2002 - 2018 National Fire Incident Reporting System (NFIRS) incidents
Based on the data from the years 2002 - 2018 the average number of fires per year is 24. The highest number of fire incidents - 45 took place in 2003, and the least - 1 in 2004. The data has an increasing trend.
When looking into fire subcategories, the most incidents belonged to: Outside Fires (43.4%), and Structure Fires (31.0%).
Fire incident types reported to NFIRS in Zip Code 62681

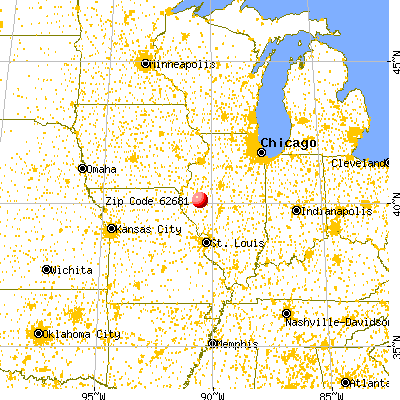


 Nearest zip codes: 62639, 61452, 61440, 62319, 62624, 61484.


 Based on the data from the years 2002 - 2018 the average number of fires per year is 24. The highest number of fire incidents - 45 took place in 2003, and the least - 1 in 2004. The data has an increasing trend.
 When looking into fire subcategories, the most incidents belonged to: Outside Fires (43.4%), and Structure Fires (31.0%).