Estimated zip code population in 2022: 1,088 Zip code population in 2010: 1,306 Zip code population in 2000: 1,320
Houses and condos: 567 Renter-occupied apartments: 53
% of renters here:
11%
State:
33%
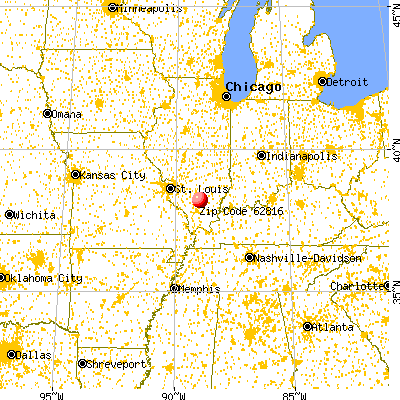
March 2022 cost of living index in zip code 62816: 82.0 (low, U.S. average is 100)
Land area: 34.6 sq. mi. Water area: 6.7 sq. mi.
Population density: 31 people per square mile
(very low).
OSM Map
General Map
Google Map
MSN Map
OSM Map
General Map
Google Map
MSN Map
OSM Map
General Map
Google Map
MSN Map
OSM Map
General Map
Google Map
MSN Map
Please wait while loading the map...
Real estate property taxes paid for housing units in 2022:
This zip code:
1.3% ($1,122)
Illinois:
2.0% ($4,912)
Median real estate property taxes paid for housing units with mortgages in 2022: $943 (1.0%) Median real estate property taxes paid for housing units with no mortgage in 2022: $1,295 (1.5%)
Business Search- 14 Million verified businesses
Males: 545
(50.1%)
Females: 543
(49.9%)
For population 25 years and over in 62816:
High school or higher: 85.4%
Bachelor's degree or higher: 8.9%
Graduate or professional degree: 1.8%
Unemployed: 5.4%
Mean travel time to work (commute): 24.6 minutes
For population 15 years and over in 62816:
Never married: 21.2%
Now married: 62.4%
Separated: 0.8%
Widowed: 4.9%
Divorced: 10.6%
Zip code 62816 compared to state average:
Median house value significantly below state average.
Black race population percentage significantly below state average.
Hispanic race population percentage significantly below state average.
Median age significantly above state average.
Foreign-born population percentage significantly below state average.
Renting percentage significantly below state average.
Length of stay since moving in significantly above state average.
Percentage of population with a bachelor's degree or higher significantly below state average.
Averages for the 2020 tax year for zip code 62816, filed in 2021:
Average Adjusted Gross Income (AGI) in 2020: $51,794 (Individual Income Tax Returns)
Here:
$51,794
State:
$82,626
Salary/wage: $43,812 (reported on 79.2% of returns)
Here:
$43,812
State:
$66,640
(% of AGI for various income ranges: 1220.0% for AGIs below $25k, 3250.8% for AGIs $25k-50k, 6112.9% for AGIs $50k-75k, 7790.0% for AGIs $75k-100k, 16206.7% for AGIs $100k-200k)
Taxable interest for individuals: $554 (reported on 24.5% of returns)
This zip code:
$554
Illinois:
$2,376
(% of AGI for various income ranges: 8.3% for AGIs below $25k, 15.0% for AGIs $25k-50k, 16.0% for AGIs $75k-100k, 120.0% for AGIs $100k-200k)
Ordinary dividends: $1,586 (reported on 13.2% of returns)
Here:
$1,586
State:
$9,061
(% of AGI for various income ranges: 18.3% for AGIs below $25k, 31.4% for AGIs $50k-75k, 223.3% for AGIs $100k-200k)
Net capital gain/loss in AGI: +$1,214 (reported on 13.2% of returns)
Here:
+$1,214
State:
+$31,684
(% of AGI for various income ranges: 32.5% for AGIs $25k-50k, 92.0% for AGIs $75k-100k)
Profit/loss from business: +$2,367 (reported on 11.3% of returns)
Here:
+$2,367
State:
+$12,175
(% of AGI for various income ranges: 100.0% for AGIs below $25k, 100.8% for AGIs $25k-50k)
Taxable individual retirement arrangement distribution: $12,333 (reported on 5.7% of returns)
62816:
$12,333
Illinois:
$21,613
(% of AGI for various income ranges: 308.3% for AGIs $25k-50k)
Earned income credit: $1,922 (reported on 17.0% of returns)
Here:
$1,922
State:
$2,311
(% of AGI for various income ranges: 97.5% for AGIs below $25k, 46.7% for AGIs $25k-50k)
Percentage of individuals using paid preparers for their 2020 taxes: 98.1%
Here:
98%
State:
93%
(% for various income ranges: 94.1% for AGIs below $25k, 100.0% for AGIs $25k-50k, 100.0% for AGIs $50k-75k, 100.0% for AGIs $75k-100k, 100.0% for AGIs $100k-200k)
Averages for the 2012 tax year for zip code 62816, filed in 2013:
Average Adjusted Gross Income (AGI) in 2012: $39,873 (Individual Income Tax Returns)
Here:
$39,873
State:
$68,058
Salary/wage: $36,407 (reported on 82.1% of returns)
Here:
$36,407
State:
$55,396
(% of AGI for various income ranges: 69.9% for AGIs below $25k, 76.4% for AGIs $25k-50k, 81.5% for AGIs $50k-75k, 74.0% for AGIs $75k-100k, 65.5% for AGIs $100k-200k)
Taxable interest for individuals: $675 (reported on 28.6% of returns)
This zip code:
$675
Illinois:
$1,969
(% of AGI for various income ranges: 0.9% for AGIs below $25k, 0.6% for AGIs $25k-50k, 0.3% for AGIs $50k-75k, 0.7% for AGIs $75k-100k)
Ordinary dividends: $871 (reported on 12.5% of returns)
Here:
$871
State:
$7,786
Net capital gain/loss in AGI: +$850 (reported on 7.1% of returns)
Here:
+$850
State:
+$22,183
Profit/loss from business: +$4,556 (reported on 16.1% of returns)
Here:
+$4,556
State:
+$12,903
(% of AGI for various income ranges: 6.5% for AGIs below $25k, 2.7% for AGIs $25k-50k, 1.8% for AGIs $75k-100k)
Taxable individual retirement arrangement distribution: $10,375 (reported on 7.1% of returns)
62816:
$10,375
Illinois:
$17,929
Total itemized deductions: $16,362 (25% of AGI, reported on 14.3% of returns)
Here:
$16,362
State:
$26,433
Here:
24.7% of AGI
State:
19.2% of AGI
Charity contributions: $4,633 (reported on 10.7% of returns)
Here:
$4,633
State:
$4,525
Taxes paid: $4,912 (reported on 14.3% of returns)
62816:
$4,912
State:
$11,968
Earned income credit: $1,773 (reported on 19.6% of returns)
Here:
$1,773
State:
$2,349
(% of AGI for various income ranges: 5.2% for AGIs below $25k, 1.0% for AGIs $25k-50k)
Percentage of individuals using paid preparers for their 2012 taxes: 57.1%
Here:
57%
State:
57%
(% for various income ranges: 52.2% for AGIs below $25k, 57.1% for AGIs $25k-50k, 60.0% for AGIs $50k-75k, 66.7% for AGIs $75k-100k, 66.7% for AGIs $100k-200k)
Averages for the 2004 tax year for zip code 62816, filed in 2005:
Average Adjusted Gross Income (AGI) in 2004: $32,947 (Individual Income Tax Returns)
Here:
$32,947
State:
$54,625
Salary/wage: $31,730 (reported on 86.6% of returns)
Here:
$31,730
State:
$46,811
(% of AGI for various income ranges: 92.5% for AGIs below $10k, 75.0% for AGIs $10k-25k, 82.9% for AGIs $25k-50k, 88.1% for AGIs $50k-75k, 82.1% for AGIs $75k-100k)
Taxable interest for individuals: $1,442 (reported on 37.1% of returns)
This zip code:
$1,442
Illinois:
$2,101
(% of AGI for various income ranges: 2.0% for AGIs below $10k, 2.8% for AGIs $10k-25k, 2.0% for AGIs $25k-50k, 0.8% for AGIs $50k-75k, 1.4% for AGIs $75k-100k)
Taxable dividends: $614 (reported on 15.7% of returns)
Here:
$614
State:
$4,306
(% of AGI for various income ranges: 0.6% for AGIs $10k-25k, 0.3% for AGIs $25k-50k, 0.1% for AGIs $50k-75k, 0.5% for AGIs $75k-100k)
Profit/loss from business: +$2,466 (reported on 15.7% of returns)
Here:
+$2,466
State:
+$11,771
(% of AGI for various income ranges: 6.7% for AGIs below $10k, 1.9% for AGIs $10k-25k, 2.2% for AGIs $25k-50k, -0.2% for AGIs $50k-75k)
Profit/loss from farming: +$1,923 (reported on 4.6% of returns)
Here:
+$1,923
State:
+$2,327
IRA payment deduction: $2,471 (reported on 3.0% of returns)
62816:
$2,471
Illinois:
$3,087
Total itemized deductions: $13,123 (22% of AGI, reported on 11.6% of returns)
Here:
$13,123
State:
$20,239
Here:
22.4% of AGI
State:
19.5% of AGI
(% of AGI for various income ranges: 5.7% for AGIs $10k-25k, 3.6% for AGIs $25k-50k, 4.9% for AGIs $50k-75k, 6.0% for AGIs $75k-100k)
Charity contributions deductions: $2,745 (5% of AGI, reported on 9.1% of returns)
Here:
$2,745
State:
$3,719
Here:
4.6% of AGI
State:
3.4% of AGI
(% of AGI for various income ranges: 0.7% for AGIs $10k-25k, 0.4% for AGIs $25k-50k, 1.0% for AGIs $50k-75k, 1.2% for AGIs $75k-100k)
Total tax: $3,689 (reported on 75.6% of returns)
62816:
$3,689
State:
$9,882
(% of AGI for various income ranges: 2.6% for AGIs below $10k, 4.1% for AGIs $10k-25k, 6.1% for AGIs $25k-50k, 8.8% for AGIs $50k-75k, 16.4% for AGIs $75k-100k)
Earned income credit: $1,478 (reported on 16.4% of returns)
Here:
$1,478
State:
$1,788
Percentage of individuals using paid preparers for their 2004 taxes: 64.2%
Here:
64%
State:
61%
(% for various income ranges: 55.5% for AGIs below $10k, 62.8% for AGIs $10k-25k, 68.2% for AGIs $25k-50k, 68.9% for AGIs $50k-75k, 65.5% for AGIs $75k-100k)
Household received Food Stamps/SNAP in the past 12 months: 91 Household did not receive Food Stamps/SNAP in the past 12 months: 411
Women who had a birth in the past 12 months: 12 (7 now married, 4 unmarried) Women who did not have a birth in the past 12 months: 203 (111 now married, 91 unmarried)
Housing units in zip code 62816 with a mortgage: 166 (10 second mortgage, 2 home equity loan, 3 both second mortgage and home equity loan) Median monthly owner costs for units with a mortgage: $973 Median monthly owner costs for units without a mortgage: $459
Residents with income below the poverty level in 2022:
This zip code:
14.6%
Whole state:
11.9%
Residents with income below 50% of the poverty level in 2022:
This zip code:
6.4%
Whole state:
5.7%
Median number of rooms in houses and condos:
Here:
6.1
State:
6.4
Median number of rooms in apartments:
Here:
4.2
State:
4.1
Notable locations in this zip code not listed on our city pages
Size of family households: 236 2-persons, 75 3-persons, 54 4-persons, 6 5-persons, 1 6-persons
Size of nonfamily households: 106 1-person, 18 2-persons, 1 3-persons
82 married couples with children.
46 single-parent households (28 men, 18 women).
96.4% of residents of 62816 zip code speak English at home.
3.0% of residents speak Spanish at home (84% very well, 16% not at all).
0.5% of residents speak other Indo-European language at home (100% very well).
0.2% of residents speak Asian or Pacific Island language at home (100% well).
Foreign born population: 4 (0.5%) (0.0% of them are naturalized citizens)
:
0.5%
Whole state:
14.4%
100%Nicaragua
22%German
21%English
21%American
7%Irish
5%Scotch-Irish
2%Eastern European
2%European
Year of entry for the foreign-born population
02010 or later
42000 to 2009
01990 to 1999
1Before 1990
Facilities with environmental interests located in this zip code:
J & J SERVICES INC (155 S HWY 39 in BONNIE, IL)
STATE MASTER (Illinois EPA Project) - AIR PROGRAM AIR MINOR (AIRS/AFS) CRITERIA AND HAZARDOUS AIR POLLUTANT INVENTORY (Inventory of air pollution sources) Business SIC classification: ELECTROPLATING, PLATING, POLISHING, ANODIZING, AND COLORING
BONNIE STP (700 SEWER PLANT ROAD in BONNIE, IL)
STATE MASTER (Illinois EPA Project) - National Pollutant Discharge Elimination System Permit National Pollutant Discharge Elimination System NON-MAJOR (Tracking pollutant discharge elimination systems) - permit Business SIC classification: SEWERAGE SYSTEMS Alternative names: BONNIE STP, VILLAGE OF
J AND J SERVICES INC (HWY 37 in BONNIE, IL)
(Resource Conservation and Recovery Act (tracking hazardous waste))
BONNIE, VILLAGE OF (270 SOUTH RAILRD AVENUE in BONNIE, IL)
National Pollutant Discharge Elimination System NON-MAJOR (Tracking pollutant discharge elimination systems) - permit Business SIC classification: SEWERAGE SYSTEMS Alternative names: BONNIE STP
IDOT (BRG 041-0001 in BONNIE, IL)
Small Quantity Generators, between 100 kg and 1000 kg of hazardous waste/month (Resource Conservation and Recovery Act (tracking hazardous waste)) - notification
ILDOT (IL BRG 041 0054 415 in BONNIE, IL)
Small Quantity Generators, between 100 kg and 1000 kg of hazardous waste/month (Resource Conservation and Recovery Act (tracking hazardous waste)) - notification
M&M NITROGEN/GOLDSTAR FS INC. (16325 E. SADDLE CLUB RD. in BONNIE, IL)
ENFORCEMENT/COMPLIANCE ACTIVITY (Integrated Compliance Information System)
Housing units lacking complete plumbing facilities: 4.3% Housing units lacking complete kitchen facilities: 3.2%
36.1%Bottled, tank, or LP gas
30.2%Electricity
28.1%Utility gas
4.3%Wood
0.8%Fuel oil, kerosene, etc.
0.8%Other fuel
Population in 1990: 994. Population change in the 1990s: +326 (+32.8%).
Place of birth for U.S.-born residents:
This state: 897
Northeast: 15
Midwest: 126
South: 29
West: 8
67% of the 62816 zip code residents lived in the same house 5 years ago. Out of people who lived in different houses, 62% lived in this county. Out of people who lived in different counties, 50% lived in Illinois.
91% of the 62816 zip code residents lived in the same house 1 year ago. Out of people who lived in different houses, 37% moved from this county. Out of people who lived in different houses, 58% moved from different county within same state. Out of people who lived in different houses, 5% moved from abroad.
Private vs. public school enrollment:
Students in private schools in grades 1 to 8 (elementary and middle school):
Here:
0.0%
Illinois:
13.3%
Students in private schools in grades 9 to 12 (high school): 4
Here:
10.8%
Illinois:
9.9%
Students in private undergraduate colleges:
Here:
0.0%
Illinois:
27.4%
Occupation by median earnings in the past 12 months ($)
92,127Health diagnosing and treating practitioners and other technical occupations
80,610Education, training, and library occupations
60,079Production occupations
57,148Business and financial operations occupations
53,906Installation, maintenance, and repair occupations
53,025Transportation occupations
Top industries in this zip code by the number of employees in 2005:
Construction: Plumbing, Heating, and Air-Conditioning Contractors (20-49 employees: 1 establishment)
Other Services (except Public Administration): Religious Organizations (1-4: 4)
Real Estate and Rental and Leasing: Offices of Real Estate Agents and Brokers (1-4: 1)
Administrative and Support and Waste Management and Remediation Services: Solid Waste Landfill (1-4: 1)
Fatal accident statistics in 2014:
Fatal accident count: 1
Vehicles involved in fatal accidents: 1
Fatal accidents caused by drunken drivers: 0
Fatalities: 2
Persons involved in fatal accidents: 3
Pedestrians involved in fatal accidents: 0
Fatal accident statistics in 2012:
Fatal accident count: 1
Vehicles involved in fatal accidents: 1
Fatal accidents caused by drunken drivers: 0
Fatalities: 1
Persons involved in fatal accidents: 3
Pedestrians involved in fatal accidents: 1
2002 - 2018 National Fire Incident Reporting System (NFIRS) incidents
According to the data from the years 2002 - 2018 the average number of fires per year is 9. The highest number of reported fires - 20 took place in 2007, and the least - 3 in 2002. The data has a rising trend.
When looking into fire subcategories, the most reports belonged to: Outside Fires (39.4%), and Structure Fires (25.8%).
Fire incident types reported to NFIRS in Zip Code 62816


 Nearest zip codes: 62846, 62897, 62894, 62872, 62864, 62836.


 According to the data from the years 2002 - 2018 the average number of fires per year is 9. The highest number of reported fires - 20 took place in 2007, and the least - 3 in 2002. The data has a rising trend.
 When looking into fire subcategories, the most reports belonged to: Outside Fires (39.4%), and Structure Fires (25.8%).