Estimated zip code population in 2022: 1,235 Zip code population in 2010: 1,230 Zip code population in 2000: 1,005
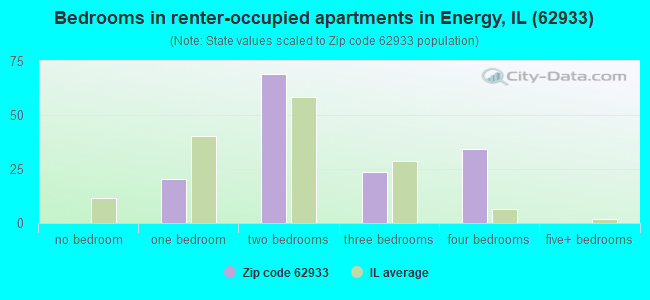
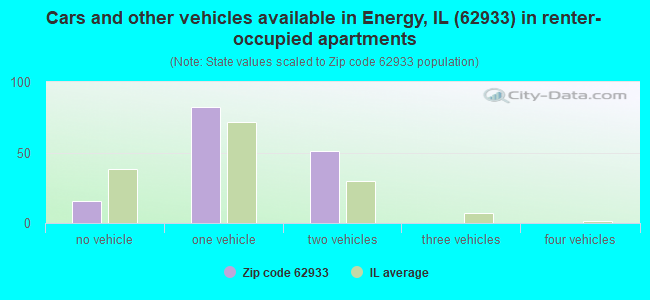
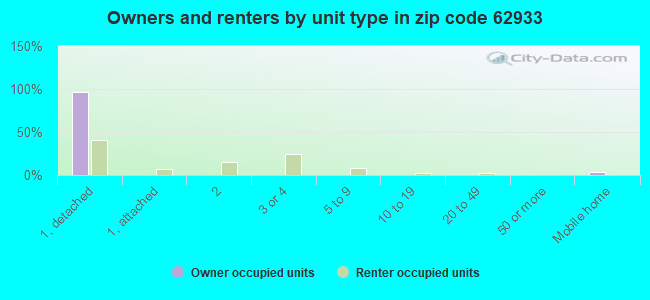
Houses and condos: 613 Renter-occupied apartments: 150
% of renters here:
27%
State:
33%
March 2022 cost of living index in zip code 62933: 75.3 (low, U.S. average is 100)
Land area: 1.4 sq. mi. Water area: 0.1 sq. mi.
Population density: 859 people per square mile
(low).
OSM Map
General Map
Google Map
MSN Map
OSM Map
General Map
Google Map
MSN Map
OSM Map
General Map
Google Map
MSN Map
OSM Map
General Map
Google Map
MSN Map
Please wait while loading the map...
Real estate property taxes paid for housing units in 2022:
This zip code:
1.4% ($1,901)
Illinois:
2.0% ($4,912)
Median real estate property taxes paid for housing units with mortgages in 2022: $2,552 (1.7%) Median real estate property taxes paid for housing units with no mortgage in 2022: $1,657 (1.3%)
Business Search- 14 Million verified businesses
Males: 503
(40.7%)
Females: 732
(59.3%)
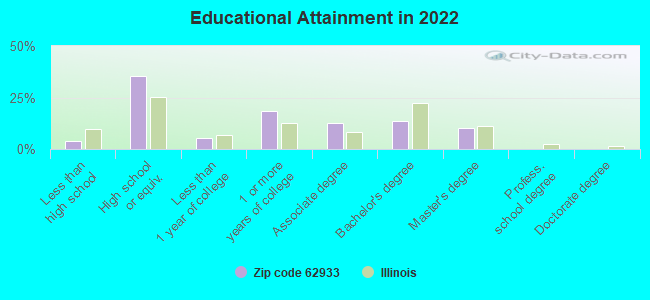
For population 25 years and over in 62933:
High school or higher: 94.6%
Bachelor's degree or higher: 23.9%
Graduate or professional degree: 10.4%
Unemployed: 4.9%
Mean travel time to work (commute): 21.0 minutes
For population 15 years and over in 62933:
Never married: 25.4%
Now married: 51.8%
Separated: 1.2%
Widowed: 12.2%
Divorced: 9.4%
Zip code 62933 compared to state average:
Median house value below state average.
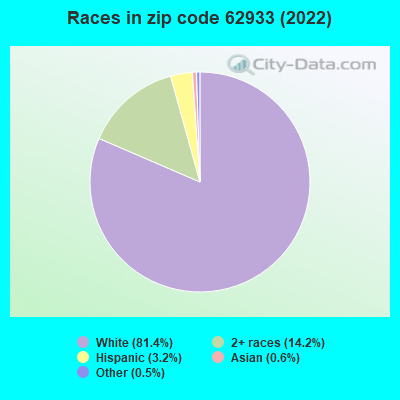
Black race population percentage significantly below state average.
Hispanic race population percentage significantly below state average.
Median age above state average.
Foreign-born population percentage significantly below state average.
Length of stay since moving in above state average.
Number of college students below state average.
Percentage of population with a bachelor's degree or higher below state average.
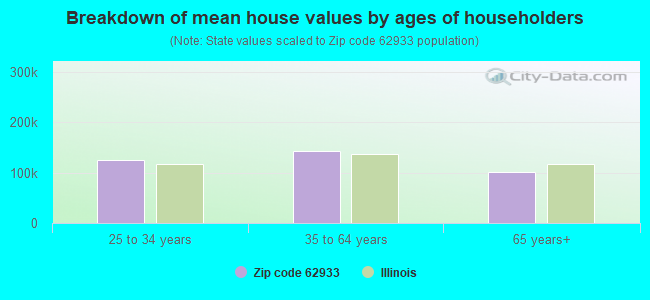
Estimated median house/condo value in 2022: $137,007
62933:
$137,007
Illinois:
$251,600
According to our research of Illinois and other state lists, there were 2 registered sex offenders living in 62933 zip code as of May 28, 2024. The ratio of all residents to sex offenders in zip code 62933 is 674 to 1. The ratio of registered sex offenders to all residents in this zip code is near the state average.
Median resident age:
This zip code:
43.1 years
Illinois median age:
39.1 years
Average household size:
This zip code:
2.2 people
Illinois:
2.4 people
Averages for the 2020 tax year for zip code 62933, filed in 2021:
Average Adjusted Gross Income (AGI) in 2020: $52,247 (Individual Income Tax Returns)
Here:
$52,247
State:
$82,626
Salary/wage: $45,170 (reported on 78.3% of returns)
Here:
$45,170
State:
$66,640
(% of AGI for various income ranges: 1035.9% for AGIs below $25k, 3385.0% for AGIs $25k-50k, 7103.3% for AGIs $50k-75k, 8622.5% for AGIs $75k-100k, 19240.0% for AGIs $100k-200k)
Taxable interest for individuals: $640 (reported on 33.3% of returns)
This zip code:
$640
Illinois:
$2,376
(% of AGI for various income ranges: 7.1% for AGIs below $25k, 13.3% for AGIs $25k-50k, 20.0% for AGIs $50k-75k, 27.5% for AGIs $75k-100k, 192.5% for AGIs $100k-200k)
Ordinary dividends: $1,650 (reported on 16.7% of returns)
Here:
$1,650
State:
$9,061
(% of AGI for various income ranges: 14.7% for AGIs below $25k, 91.7% for AGIs $50k-75k, 212.5% for AGIs $100k-200k)
Net capital gain/loss in AGI: +$1,662 (reported on 13.3% of returns)
Here:
+$1,662
State:
+$31,684
(% of AGI for various income ranges: 19.2% for AGIs $25k-50k, 275.0% for AGIs $75k-100k)
Profit/loss from business: +$4,300 (reported on 10.0% of returns)
Here:
+$4,300
State:
+$12,175
(% of AGI for various income ranges: 80.0% for AGIs below $25k, 203.3% for AGIs $50k-75k)
Taxable individual retirement arrangement distribution: $12,817 (reported on 10.0% of returns)
62933:
$12,817
Illinois:
$21,613
(% of AGI for various income ranges: 110.0% for AGIs below $25k, 1455.0% for AGIs $75k-100k)
Earned income credit: $1,889 (reported on 15.0% of returns)
Here:
$1,889
State:
$2,311
(% of AGI for various income ranges: 66.5% for AGIs below $25k, 47.5% for AGIs $25k-50k)
Percentage of individuals using paid preparers for their 2020 taxes: 93.3%
Here:
93%
State:
93%
(% for various income ranges: 90.9% for AGIs below $25k, 93.3% for AGIs $25k-50k, 88.9% for AGIs $50k-75k, 100.0% for AGIs $75k-100k, 100.0% for AGIs $100k-200k)
Averages for the 2012 tax year for zip code 62933, filed in 2013:
Average Adjusted Gross Income (AGI) in 2012: $42,112 (Individual Income Tax Returns)
Here:
$42,112
State:
$68,058
Salary/wage: $36,047 (reported on 80.4% of returns)
Here:
$36,047
State:
$55,396
(% of AGI for various income ranges: 68.0% for AGIs below $25k, 75.2% for AGIs $25k-50k, 67.0% for AGIs $50k-75k, 79.3% for AGIs $75k-100k, 55.9% for AGIs $100k-200k)
Taxable interest for individuals: $568 (reported on 33.9% of returns)
This zip code:
$568
Illinois:
$1,969
(% of AGI for various income ranges: 0.6% for AGIs below $25k, 0.4% for AGIs $25k-50k, 0.3% for AGIs $50k-75k, 0.8% for AGIs $100k-200k)
Ordinary dividends: $1,167 (reported on 16.1% of returns)
Here:
$1,167
State:
$7,786
(% of AGI for various income ranges: 1.2% for AGIs below $25k, 0.5% for AGIs $25k-50k, 0.3% for AGIs $50k-75k, 0.7% for AGIs $75k-100k)
Profit/loss from business: +$7,429 (reported on 12.5% of returns)
Here:
+$7,429
State:
+$12,903
(% of AGI for various income ranges: 5.2% for AGIs below $25k, 3.2% for AGIs $25k-50k, 3.9% for AGIs $50k-75k)
Taxable individual retirement arrangement distribution: $9,500 (reported on 8.9% of returns)
62933:
$9,500
Illinois:
$17,929
Total itemized deductions: $17,730 (23% of AGI, reported on 17.9% of returns)
Here:
$17,730
State:
$26,433
Here:
23.3% of AGI
State:
19.2% of AGI
(% of AGI for various income ranges: 14.7% for AGIs below $25k, 10.1% for AGIs $50k-75k, 7.6% for AGIs $75k-100k, 8.5% for AGIs $100k-200k)
Charity contributions: $4,000 (reported on 12.5% of returns)
Here:
$4,000
State:
$4,525
Taxes paid: $5,610 (reported on 17.9% of returns)
62933:
$5,610
State:
$11,968
(% of AGI for various income ranges: 3.6% for AGIs below $25k, 2.4% for AGIs $50k-75k, 2.5% for AGIs $75k-100k, 3.9% for AGIs $100k-200k)
Earned income credit: $1,927 (reported on 19.6% of returns)
Here:
$1,927
State:
$2,349
(% of AGI for various income ranges: 4.7% for AGIs below $25k, 1.4% for AGIs $25k-50k)
Percentage of individuals using paid preparers for their 2012 taxes: 51.8%
Here:
52%
State:
57%
(% for various income ranges: 41.7% for AGIs below $25k, 53.3% for AGIs $25k-50k, 62.5% for AGIs $50k-75k, 60.0% for AGIs $75k-100k, 75.0% for AGIs $100k-200k)
Averages for the 2004 tax year for zip code 62933, filed in 2005:
Average Adjusted Gross Income (AGI) in 2004: $34,243 (Individual Income Tax Returns)
Here:
$34,243
State:
$54,625
Salary/wage: $30,557 (reported on 84.8% of returns)
Here:
$30,557
State:
$46,811
(% of AGI for various income ranges: 107.9% for AGIs below $10k, 71.0% for AGIs $10k-25k, 79.6% for AGIs $25k-50k, 81.8% for AGIs $50k-75k, 70.4% for AGIs $75k-100k, 62.1% for AGIs over 100k)
Taxable interest for individuals: $1,004 (reported on 44.2% of returns)
This zip code:
$1,004
Illinois:
$2,101
(% of AGI for various income ranges: 3.2% for AGIs below $10k, 2.9% for AGIs $10k-25k, 1.4% for AGIs $25k-50k, 0.9% for AGIs $50k-75k, 0.6% for AGIs $75k-100k, 0.8% for AGIs over 100k)
Taxable dividends: $1,017 (reported on 21.5% of returns)
Here:
$1,017
State:
$4,306
(% of AGI for various income ranges: 0.8% for AGIs below $10k, 1.2% for AGIs $10k-25k, 0.6% for AGIs $25k-50k, 0.1% for AGIs $50k-75k, 0.1% for AGIs $75k-100k, 1.7% for AGIs over 100k)
Profit/loss from business: +$2,025 (reported on 14.5% of returns)
Here:
+$2,025
State:
+$11,771
(% of AGI for various income ranges: 4.0% for AGIs below $10k, 0.5% for AGIs $10k-25k, 2.0% for AGIs $25k-50k, 0.7% for AGIs $50k-75k, 0.0% for AGIs $75k-100k)
Total itemized deductions: $14,953 (23% of AGI, reported on 19.1% of returns)
Here:
$14,953
State:
$20,239
Here:
23.1% of AGI
State:
19.5% of AGI
(% of AGI for various income ranges: 9.0% for AGIs $10k-25k, 9.1% for AGIs $25k-50k, 7.8% for AGIs $50k-75k, 9.3% for AGIs $75k-100k, 8.0% for AGIs over 100k)
Charity contributions deductions: $3,656 (6% of AGI, reported on 16.6% of returns)
Here:
$3,656
State:
$3,719
Here:
5.7% of AGI
State:
3.4% of AGI
(% of AGI for various income ranges: 1.3% for AGIs $10k-25k, 1.4% for AGIs $25k-50k, 1.5% for AGIs $50k-75k, 4.7% for AGIs $75k-100k)
Total tax: $4,336 (reported on 76.0% of returns)
62933:
$4,336
State:
$9,882
(% of AGI for various income ranges: 2.6% for AGIs below $10k, 3.5% for AGIs $10k-25k, 6.9% for AGIs $25k-50k, 9.2% for AGIs $50k-75k, 11.0% for AGIs $75k-100k, 20.8% for AGIs over 100k)
Earned income credit: $1,416 (reported on 18.1% of returns)
Here:
$1,416
State:
$1,788
Percentage of individuals using paid preparers for their 2004 taxes: 59.6%
Here:
60%
State:
61%
(% for various income ranges: 54.0% for AGIs below $10k, 57.9% for AGIs $10k-25k, 61.6% for AGIs $25k-50k, 61.4% for AGIs $50k-75k, 65.0% for AGIs $75k-100k, 80.0% for AGIs over 100k)
Household received Food Stamps/SNAP in the past 12 months: 70 Household did not receive Food Stamps/SNAP in the past 12 months: 481
Women who had a birth in the past 12 months: 4 (4 now married, 0 unmarried) Women who did not have a birth in the past 12 months: 226 (69 now married, 158 unmarried)
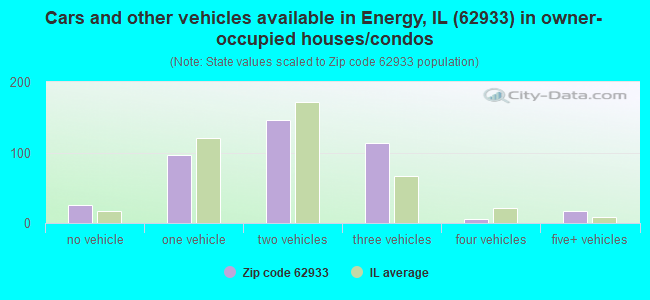
Housing units in zip code 62933 with a mortgage: 175 (6 second mortgage, 3 both second mortgage and home equity loan) Houses without a mortgage: 8
Median monthly owner costs for units with a mortgage: $1,184 Median monthly owner costs for units without a mortgage: $545
Residents with income below the poverty level in 2022:
This zip code:
9.6%
Whole state:
11.9%
Residents with income below 50% of the poverty level in 2022:
This zip code:
8.1%
Whole state:
5.7%
Median number of rooms in houses and condos:
Here:
6.1
State:
6.4
Median number of rooms in apartments:
Here:
5.0
State:
4.1
Notable locations in this zip code not listed on our city pages
In group quarters: 37 (-1 institutionalized population)
Size of family households: 158 2-persons, 67 3-persons, 76 4-persons, 17 5-persons, 1 7-or-more-persons
Size of nonfamily households: 185 1-person, 49 2-persons
111 married couples with children.
198 single-parent households (35 men, 163 women).
97.8% of residents of 62933 zip code speak English at home.
1.1% of residents speak Spanish at home (100% very well).
0.3% of residents speak other Indo-European language at home (100% very well).
0.7% of residents speak Asian or Pacific Island language at home (62% very well, 38% well).
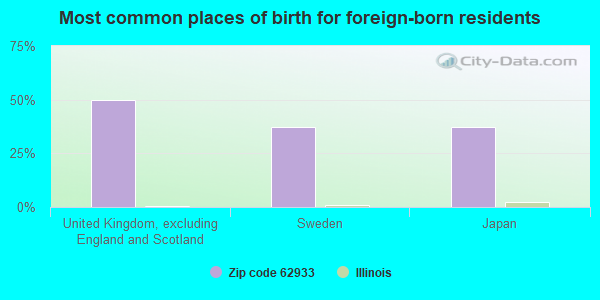
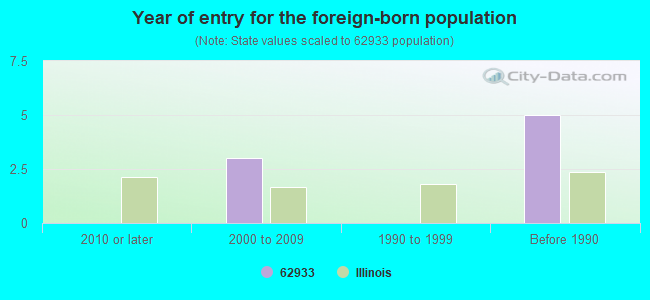
Foreign born population: 8 (0.6%) (50.2% of them are naturalized citizens)
This zip code:
0.6%
Whole state:
14.4%
50%United Kingdom, excluding England and Scotland
38%Sweden
38%Japan
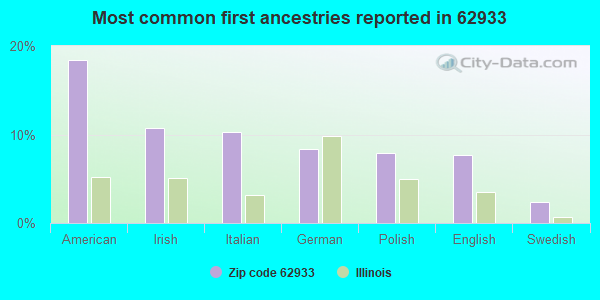
18%American
11%Irish
10%Italian
8%German
8%Polish
8%English
2%Swedish
Year of entry for the foreign-born population
02010 or later
32000 to 2009
01990 to 1999
5Before 1990
Facilities with environmental interests located in this zip code:
MCVICKER FARMS (111 S MCVICKER DR in ENERGY, IL)
STATE MASTER (Illinois EPA Project) - AIR PROGRAM AIR MINOR (AIRS/AFS) Business SIC classification: NONCLASSIFIABLE ESTABLISHMENTS
COTTONWOOD COAL CO-MINE #1 (MINE NUMBER 1 in ENERGY, IL)
National Pollutant Discharge Elimination System NON-MAJOR (Tracking pollutant discharge elimination systems) - permit Business SIC classification: BITUMINOUS COAL AND LIGNITE SURFACE MINING Alternative names: COTTONWOOD COAL CO-MINE # 1
Housing units lacking complete plumbing facilities: 0.8%
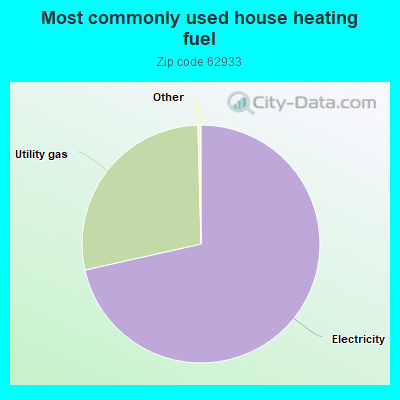
71.7%Electricity
28.2%Utility gas
Place of birth for U.S.-born residents:
This state: 1,019
Northeast: 19
Midwest: 58
South: 103
West: 18
61% of the 62933 zip code residents lived in the same house 5 years ago. Out of people who lived in different houses, 61% lived in this county. Out of people who lived in different counties, 50% lived in Illinois.
93% of the 62933 zip code residents lived in the same house 1 year ago. Out of people who lived in different houses, 39% moved from this county. Out of people who lived in different houses, 59% moved from different county within same state. Out of people who lived in different houses, 3% moved from different state.
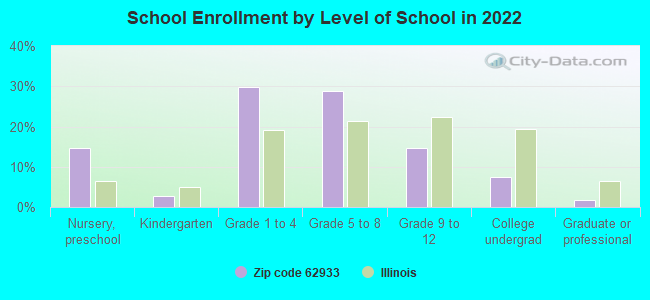
Private vs. public school enrollment:
Students in private schools in grades 1 to 8 (elementary and middle school): 95
Here:
52.9%
Illinois:
13.3%
Students in private schools in grades 9 to 12 (high school):
Here:
0.0%
Illinois:
9.9%
Students in private undergraduate colleges: 11
Here:
47.8%
Illinois:
27.4%
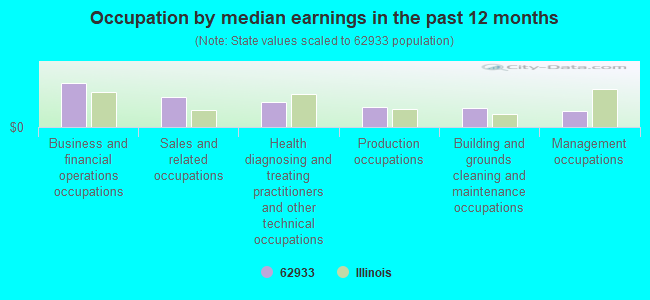
Occupation by median earnings in the past 12 months ($)
124,856Business and financial operations occupations
85,075Sales and related occupations
71,575Health diagnosing and treating practitioners and other technical occupations
57,014Production occupations
53,559Building and grounds cleaning and maintenance occupations
44,661Management occupations
Companies with federal contracts located in this zip code:
CARDINAL HEALTH CARE INCORPORATED (210 E COLLEGE ST in ENERGY, IL) 110 employees, $1500000 revenue. : $142,412 in 5 contractsfrom 2003 to 2004
Contracts for Medical and Surgical Instruments, Equipment, and Supplies, Drugs and Biologicals by Department of Veterans Affairs Signed by year:2000: $0; 2001: $0; 2002: $0; 2003: $55,182; 2004: $87,230; 2005: $0; 2006: $0.
Biggest contracts:
$32,718 with Department of Veterans Affairs for Medical and Surgical Instruments, Equipment, and Supplies. Taking place in LA. Signed on 2004-03-16. Completion date: 2004-04-10.
$28,718, same as above.Signed on 2003-11-13. Completion date: 2003-12-05.
$28,718 with Department of Veterans Affairs for Drugs and Biologicals. Taking place in LA. Signed on 2004-04-01. Completion date: 2004-04-01.
$26,464 with Department of Veterans Affairs for Medical and Surgical Instruments, Equipment, and Supplies. Taking place in LA. Signed on 2003-10-01. Completion date: 2003-10-01.
Top industries in this zip code by the number of employees in 2005:
Health Care and Social Assistance: Nursing Care Facilities (50-99 employees: 1 establishment)
Educational Services: Elementary and Secondary Schools (20-49: 1)


 Nearest zip codes: 62948, 62918, 62921, 62841, 62915, 62951.