Estimated zip code population in 2022: 1,502 Zip code population in 2010: 1,401 Zip code population in 2000: 1,401
Houses and condos: 745 Renter-occupied apartments: 66
% of renters here:
10%
State:
33%
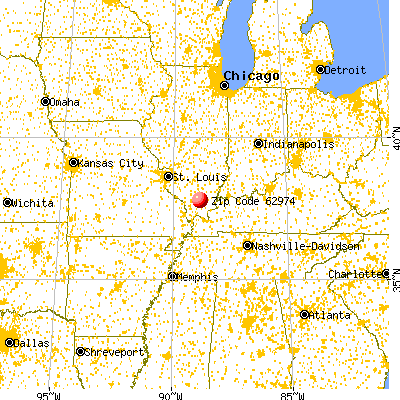
March 2022 cost of living index in zip code 62974: 85.1 (less than average, U.S. average is 100)
Land area: 26.7 sq. mi. Water area: 0.4 sq. mi.
Population density: 56 people per square mile
(very low).
OSM Map
General Map
Google Map
MSN Map
OSM Map
General Map
Google Map
MSN Map
OSM Map
General Map
Google Map
MSN Map
OSM Map
General Map
Google Map
MSN Map
Please wait while loading the map...
Real estate property taxes paid for housing units in 2022:
This zip code:
1.2% ($1,982)
Illinois:
2.0% ($4,912)
Median real estate property taxes paid for housing units with mortgages in 2022: $2,622 (1.6%) Median real estate property taxes paid for housing units with no mortgage in 2022: $1,337 (0.8%)
Business Search- 14 Million verified businesses
Males: 722
(48.1%)
Females: 779
(51.9%)
For population 25 years and over in 62974:
High school or higher: 94.2%
Bachelor's degree or higher: 24.9%
Graduate or professional degree: 6.0%
Unemployed: 1.8%
Mean travel time to work (commute): 25.6 minutes
For population 15 years and over in 62974:
Never married: 23.3%
Now married: 54.7%
Separated: 2.0%
Widowed: 7.2%
Divorced: 12.8%
Zip code 62974 compared to state average:
Median house value below state average.
Unemployed percentage below state average.
Black race population percentage significantly below state average.
Hispanic race population percentage significantly below state average.
Median age significantly above state average.
Foreign-born population percentage significantly below state average.
Renting percentage significantly below state average.
Length of stay since moving in below state average.
Averages for the 2020 tax year for zip code 62974, filed in 2021:
Average Adjusted Gross Income (AGI) in 2020: $55,228 (Individual Income Tax Returns)
Here:
$55,228
State:
$82,626
Salary/wage: $48,449 (reported on 78.5% of returns)
Here:
$48,449
State:
$66,640
(% of AGI for various income ranges: 908.8% for AGIs below $25k, 3125.7% for AGIs $25k-50k, 6711.7% for AGIs $50k-75k, 8326.0% for AGIs $75k-100k, 17663.3% for AGIs $100k-200k)
Taxable interest for individuals: $305 (reported on 30.8% of returns)
This zip code:
$305
Illinois:
$2,376
(% of AGI for various income ranges: 4.7% for AGIs below $25k, 4.3% for AGIs $25k-50k, 10.0% for AGIs $50k-75k, 28.0% for AGIs $75k-100k, 45.0% for AGIs $100k-200k)
Ordinary dividends: $1,188 (reported on 12.3% of returns)
Here:
$1,188
State:
$9,061
(% of AGI for various income ranges: 20.0% for AGIs below $25k, 45.0% for AGIs $50k-75k, 56.7% for AGIs $100k-200k)
Net capital gain/loss in AGI: +$4,843 (reported on 10.8% of returns)
Here:
+$4,843
State:
+$31,684
(% of AGI for various income ranges: 65.0% for AGIs $50k-75k, 508.3% for AGIs $100k-200k)
Profit/loss from business: +$10,040 (reported on 15.4% of returns)
Here:
+$10,040
State:
+$12,175
(% of AGI for various income ranges: 127.6% for AGIs below $25k, 162.9% for AGIs $25k-50k, 931.7% for AGIs $100k-200k)
Taxable individual retirement arrangement distribution: $12,100 (reported on 7.7% of returns)
62974:
$12,100
Illinois:
$21,613
(% of AGI for various income ranges: 131.2% for AGIs below $25k, 636.7% for AGIs $50k-75k)
Total itemized deductions: $39,100 (reported on 3.1% of returns)
Here:
$39,100
State:
$34,948
(% of AGI for various income ranges: 1303.3% for AGIs $50k-75k)
Taxes paid: $8,000 (reported on 3.1% of returns)
62974:
$8,000
State:
$8,563
(% of AGI for various income ranges: 266.7% for AGIs $50k-75k)
Earned income credit: $2,073 (reported on 16.9% of returns)
Here:
$2,073
State:
$2,311
(% of AGI for various income ranges: 71.8% for AGIs below $25k, 75.7% for AGIs $25k-50k)
Percentage of individuals using paid preparers for their 2020 taxes: 96.9%
Here:
97%
State:
93%
(% for various income ranges: 95.5% for AGIs below $25k, 100.0% for AGIs $25k-50k, 88.9% for AGIs $50k-75k, 100.0% for AGIs $75k-100k, 100.0% for AGIs $100k-200k)
Averages for the 2012 tax year for zip code 62974, filed in 2013:
Average Adjusted Gross Income (AGI) in 2012: $46,844 (Individual Income Tax Returns)
Here:
$46,844
State:
$68,058
Salary/wage: $43,031 (reported on 81.8% of returns)
Here:
$43,031
State:
$55,396
(% of AGI for various income ranges: 71.8% for AGIs below $25k, 75.8% for AGIs $25k-50k, 83.7% for AGIs $50k-75k, 82.9% for AGIs $75k-100k, 62.5% for AGIs $100k-200k)
Taxable interest for individuals: $716 (reported on 28.8% of returns)
This zip code:
$716
Illinois:
$1,969
(% of AGI for various income ranges: 0.6% for AGIs below $25k, 0.2% for AGIs $25k-50k, 0.2% for AGIs $75k-100k, 1.1% for AGIs $100k-200k)
Ordinary dividends: $862 (reported on 12.1% of returns)
Here:
$862
State:
$7,786
(% of AGI for various income ranges: 1.0% for AGIs below $25k, 0.2% for AGIs $50k-75k, 0.3% for AGIs $75k-100k)
Net capital gain/loss in AGI: +$2,420 (reported on 7.6% of returns)
Here:
+$2,420
State:
+$22,183
Profit/loss from business: +$8,417 (reported on 18.2% of returns)
Here:
+$8,417
State:
+$12,903
(% of AGI for various income ranges: 9.0% for AGIs below $25k, 4.9% for AGIs $25k-50k, 7.1% for AGIs $75k-100k)
Taxable individual retirement arrangement distribution: $12,471 (reported on 10.6% of returns)
62974:
$12,471
Illinois:
$17,929
Total itemized deductions: $17,907 (22% of AGI, reported on 22.7% of returns)
Here:
$17,907
State:
$26,433
Here:
22.1% of AGI
State:
19.2% of AGI
(% of AGI for various income ranges: 9.2% for AGIs $25k-50k, 8.9% for AGIs $50k-75k, 8.6% for AGIs $75k-100k, 11.4% for AGIs $100k-200k)
Charity contributions: $4,878 (reported on 13.6% of returns)
Here:
$4,878
State:
$4,525
(% of AGI for various income ranges: 2.2% for AGIs $50k-75k, 1.6% for AGIs $75k-100k, 2.0% for AGIs $100k-200k)
Taxes paid: $6,129 (reported on 21.2% of returns)
62974:
$6,129
State:
$11,968
(% of AGI for various income ranges: 2.0% for AGIs $25k-50k, 2.4% for AGIs $50k-75k, 3.0% for AGIs $75k-100k, 4.4% for AGIs $100k-200k)
Earned income credit: $2,271 (reported on 21.2% of returns)
Here:
$2,271
State:
$2,349
(% of AGI for various income ranges: 8.1% for AGIs below $25k, 1.3% for AGIs $25k-50k)
Percentage of individuals using paid preparers for their 2012 taxes: 57.6%
Here:
58%
State:
57%
(% for various income ranges: 56.0% for AGIs below $25k, 60.0% for AGIs $25k-50k, 50.0% for AGIs $50k-75k, 62.5% for AGIs $75k-100k, 66.7% for AGIs $100k-200k)
Averages for the 2004 tax year for zip code 62974, filed in 2005:
Average Adjusted Gross Income (AGI) in 2004: $34,995 (Individual Income Tax Returns)
Here:
$34,995
State:
$54,625
Salary/wage: $32,190 (reported on 85.3% of returns)
Here:
$32,190
State:
$46,811
(% of AGI for various income ranges: 79.3% for AGIs below $10k, 72.9% for AGIs $10k-25k, 82.9% for AGIs $25k-50k, 81.0% for AGIs $50k-75k, 126.8% for AGIs $75k-100k)
Taxable interest for individuals: $901 (reported on 38.0% of returns)
This zip code:
$901
Illinois:
$2,101
(% of AGI for various income ranges: 2.7% for AGIs below $10k, 2.9% for AGIs $10k-25k, 0.9% for AGIs $25k-50k, 0.7% for AGIs $50k-75k, 0.3% for AGIs $75k-100k)
Taxable dividends: $600 (reported on 14.7% of returns)
Here:
$600
State:
$4,306
(% of AGI for various income ranges: 0.9% for AGIs $10k-25k, 0.1% for AGIs $25k-50k, 0.3% for AGIs $50k-75k, 0.2% for AGIs $75k-100k)
Net capital gain/loss: +$1,980 (reported on 8.0% of returns)
Here:
+$1,980
State:
+$17,321
Profit/loss from business: +$7,990 (reported on 16.4% of returns)
Here:
+$7,990
State:
+$11,771
(% of AGI for various income ranges: 6.6% for AGIs below $10k, 6.1% for AGIs $10k-25k, 3.2% for AGIs $25k-50k, 1.7% for AGIs $50k-75k, 10.0% for AGIs $75k-100k)
IRA payment deduction: $3,857 (reported on 2.3% of returns)
62974:
$3,857
Illinois:
$3,087
Total itemized deductions: $14,455 (23% of AGI, reported on 18.3% of returns)
Here:
$14,455
State:
$20,239
Here:
23.0% of AGI
State:
19.5% of AGI
Charity contributions deductions: $3,156 (5% of AGI, reported on 14.7% of returns)
Here:
$3,156
State:
$3,719
Here:
5.0% of AGI
State:
3.4% of AGI
Total tax: $4,063 (reported on 72.2% of returns)
62974:
$4,063
State:
$9,882
(% of AGI for various income ranges: 1.8% for AGIs below $10k, 4.1% for AGIs $10k-25k, 6.3% for AGIs $25k-50k, 8.4% for AGIs $50k-75k, 11.0% for AGIs $75k-100k, 18.2% for AGIs over 100k)
Earned income credit: $1,908 (reported on 19.6% of returns)
Here:
$1,908
State:
$1,788
Percentage of individuals using paid preparers for their 2004 taxes: 65.0%
Here:
65%
State:
61%
(% for various income ranges: 61.0% for AGIs below $10k, 62.0% for AGIs $10k-25k, 65.9% for AGIs $25k-50k, 73.2% for AGIs $50k-75k, 87.9% for AGIs $75k-100k)
Household received Food Stamps/SNAP in the past 12 months: 85 Household did not receive Food Stamps/SNAP in the past 12 months: 570
Women who had a birth in the past 12 months: 17 (11 now married, 5 unmarried) Women who did not have a birth in the past 12 months: 359 (137 now married, 222 unmarried)
Housing units in zip code 62974 with a mortgage: 307 (25 second mortgage, 25 both second mortgage and home equity loan) Houses without a mortgage: 6
Median monthly owner costs for units with a mortgage: $1,166 Median monthly owner costs for units without a mortgage: $527
Residents with income below the poverty level in 2022:
This zip code:
5.4%
Whole state:
11.9%
Residents with income below 50% of the poverty level in 2022:
This zip code:
1.5%
Whole state:
5.7%
Median number of rooms in houses and condos:
Here:
6.0
State:
6.4
Median number of rooms in apartments:
Here:
5.0
State:
4.1
Notable locations in this zip code not listed on our city pages
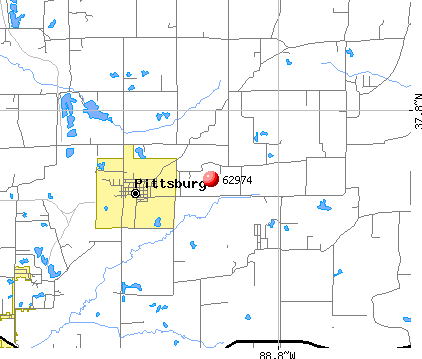
Churches in zip code 62974 include: Church of God (A), Union Grove Church (B), Number 8 Chapel (C), Pleasant Grove Church (D). Display/hide their locations on the map
Size of family households: 239 2-persons, 77 3-persons, 69 4-persons, 48 5-persons
Size of nonfamily households: 188 1-person, 24 2-persons, 7 3-persons
182 married couples with children.
58 single-parent households (10 men, 48 women).
98.8% of residents of 62974 zip code speak English at home.
0.6% of residents speak Spanish at home (100% well).
Foreign born population: 24 (1.6%) (71.0% of them are naturalized citizens)
This zip code:
1.6%
Whole state:
14.4%
33%United Kingdom, excluding England and Scotland
33%Honduras
29%Sweden
25%German
19%American
14%English
11%Irish
4%Italian
3%European
1%French
Year of entry for the foreign-born population
82010 or later
02000 to 2009
01990 to 1999
24Before 1990
Facilities with environmental interests located in this zip code:
PITTSBURG FIBERGLASS INC (P.O. BOX 147 in PITTSBURG, IL)
STATE MASTER (Illinois EPA Project) - National Pollutant Discharge Elimination System Permit National Pollutant Discharge Elimination System NON-MAJOR (Tracking pollutant discharge elimination systems) - permit Organizations: PITTSBURG FIBERGLASS, INC. (CONTACT/OWNER)
PITTSBURG STP (17864 PERRY ROAD in PITTSBURG, IL)
STATE MASTER (Illinois EPA Project) - National Pollutant Discharge Elimination System Permit National Pollutant Discharge Elimination System NON-MAJOR (Tracking pollutant discharge elimination systems) - permit Business SIC classification: SEWERAGE SYSTEMS Alternative names: PITTSBURG STP, VILLAGE OF
LINCOLN ELEM SCHOOL (20163 CORINTH RD in PITTSBURG, IL)
(National Center for Education Statistics) - STATE ID-2110000102004 Organizations: JOHNSTON CITY C U SCH DIST 1 (SCHOOL DISTRICT)
ADDINGTON ENTERPRISES (GP NO. 2 RURAL PITTSBURG in PITTSBURG, IL)
AIR MINOR (AIRS/AFS) CRITERIA AND HAZARDOUS AIR POLLUTANT INVENTORY (Inventory of air pollution sources) Business SIC classification: BITUMINOUS COAL UNDERGROUND MINING
LCC ILLINOIS, LLC-CLASSIC MINE (ADMINISTRATIVE OFFICE in PITTSBURG, IL)
National Pollutant Discharge Elimination System NON-MAJOR (Tracking pollutant discharge elimination systems) - permit Business SIC classification: BITUMINOUS COAL AND LIGNITE SURFACE MINING Alternative names: AYRSHIRE LAND CO-MINE 2, AYSHIRE LAND CO-MINE 2, LLC ILLINOIS LLC-CLASSIC MINE
Housing units lacking complete plumbing facilities: 7.1% Housing units lacking complete kitchen facilities: 2.8%
68.6%Electricity
21.3%Utility gas
9.6%Bottled, tank, or LP gas
0.8%Wood
Population in 1990: 1,330. Population change in the 1990s: +71 (+5.3%).
Place of birth for U.S.-born residents:
This state: 1,144
Northeast: 33
Midwest: 107
South: 158
West: 16
69% of the 62974 zip code residents lived in the same house 5 years ago. Out of people who lived in different houses, 75% lived in this county. Out of people who lived in different counties, 50% lived in Illinois.
92% of the 62974 zip code residents lived in the same house 1 year ago. Out of people who lived in different houses, 17% moved from this county. Out of people who lived in different houses, 5% moved from different county within same state. Out of people who lived in different houses, 85% moved from different state.
Private vs. public school enrollment:
Students in private schools in grades 1 to 8 (elementary and middle school): 10
Here:
7.7%
Illinois:
13.3%
Students in private schools in grades 9 to 12 (high school): 3
Here:
6.0%
Illinois:
9.9%
Students in private undergraduate colleges: 5
Here:
13.0%
Illinois:
27.4%
Occupation by median earnings in the past 12 months ($)
155,445Health diagnosing and treating practitioners and other technical occupations
56,122Construction and extraction occupations
54,279Management occupations
50,918Installation, maintenance, and repair occupations
39,996Transportation occupations
39,691Office and administrative support occupations
Top industries in this zip code by the number of employees in 2005:
Other Services (except Public Administration): Labor Unions and Similar Labor Organizations (10-19 employees: 1 establishment, 1-4 employees: 1 establishment)
Construction: Drywall and Insulation Contractors (5-9: 1, 1-4: 1)
Other Services (except Public Administration): Religious Organizations (1-4: 2)
Construction: New Single-Family Housing Construction (except Operative Builders) (1-4: 1)
Administrative and Support and Waste Management and Remediation Services: Document Preparation Services (1-4: 1)
Fatal accident statistics in 2014:
Fatal accident count: 1
Vehicles involved in fatal accidents: 1
Fatal accidents caused by drunken drivers: 0
Fatalities: 1
Persons involved in fatal accidents: 1
Pedestrians involved in fatal accidents: 0
Fatal accident statistics in 2012:
Fatal accident count: 1
Vehicles involved in fatal accidents: 2
Fatal accidents caused by drunken drivers: 0
Fatalities: 1
Persons involved in fatal accidents: 4
Pedestrians involved in fatal accidents: 0
2002 - 2018 National Fire Incident Reporting System (NFIRS) incidents
Based on the data from the years 2002 - 2018 the average number of fires per year is 12. The highest number of reported fires - 33 took place in 2018, and the least - 6 in 2002. The data has an increasing trend.
When looking into fire subcategories, the most incidents belonged to: Outside Fires (43.3%), and Structure Fires (41.3%).
Fire incident types reported to NFIRS in Zip Code 62974


 Nearest zip codes: 62890, 62959, 62951, 62917, 62935, 62922.


 Based on the data from the years 2002 - 2018 the average number of fires per year is 12. The highest number of reported fires - 33 took place in 2018, and the least - 6 in 2002. The data has an increasing trend.
 When looking into fire subcategories, the most incidents belonged to: Outside Fires (43.3%), and Structure Fires (41.3%).