Estimated zip code population in 2022: 13
Zip code population in 2010: 33
Zip code population in 2000: 41
March 2022 cost of living index in zip code 63370: 84.7
(less than average, U.S. average is 100)
Land area: 0.2
sq. mi.
Water area: 0.0
sq. mi.
| Population density: 54 people per square mile | | (very low). |
![Age and Sex of Residents in zip code 63370]()
- OSM Map
- General Map
- Google Map
- MSN Map
- OSM Map
- General Map
- Google Map
- MSN Map
- OSM Map
- General Map
- Google Map
- MSN Map
- OSM Map
- General Map
- Google Map
- MSN Map
Please wait while loading the map...
Business Search - 14 Million verified businesses
| Males: 4 |  (31.0%) (31.0%) |
| Females: 9 |  (69.0%) (69.0%) |
For population 25 years and over in 63370:
- High school or higher: 93.9%
- Bachelor's degree or higher: 0.0%
- Graduate or professional degree: 0.0%
For population 15 years and over in 63370:
- Never married: 0.0%
- Now married: 62.5%
- Separated: 0.0%
- Widowed: 37.5%
- Divorced: 0.0%
Zip code 63370 compared to state average:
- Median household income significantly below state average.
- Median house value significantly below state average.
- Black race population percentage significantly below state average.
- Hispanic race population percentage significantly below state average.
- Median age significantly above state average.
- Foreign-born population percentage significantly below state average.
- Renting percentage significantly below state average.
- Length of stay since moving in significantly above state average.
- Number of rooms per house significantly below state average.
- House age significantly below state average.
- Number of college students significantly below state average.
- Percentage of population with a bachelor's degree or higher significantly below state average.
Data:
100%
rural population.
Median resident age:| This zip code: | 87.5 years |
| Missouri median age: | 39.1 years |
Average household size:| This zip code: | 1.4 people |
| Missouri: | 2.4 people |
Averages for the 2004 tax year for zip code 63370, filed in 2005:
Average Adjusted Gross Income (AGI) in 2004: $18,312 (Individual Income Tax Returns)
| Here: | $18,312 |
| State: | $44,591 |
Percentage of individuals using paid preparers for their 2004 taxes: 81.2%
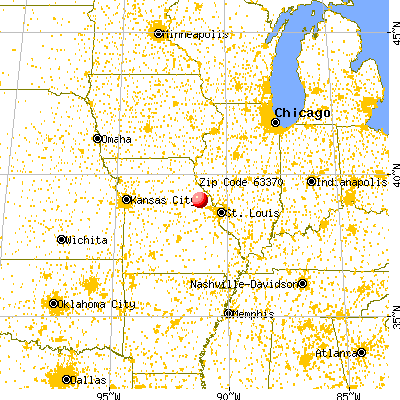
![63370 map]() Nearest zip codes: 63333
Nearest zip codes: 63333,
63381,
63359,
63377,
63349,
63334.
Percentage of family households:| This zip code: | 0.0% |
| Missouri: | 44.2% |
Percentage of households with unmarried partners:| This zip code: | 0.0% |
| Missouri: | 46.3% |
No gay or lesbian households reported
Household received Food Stamps/SNAP in the past 12 months: 0
Household did not receive Food Stamps/SNAP in the past 12 months: 9
Housing units in zip code 63370 with a mortgage: 5
Houses without a mortgage: 4

- Year house built (houses)
- 02014 or later
- 02010 to 2013
- 02000 to 2009
- 01990 to 1999
- 01980 to 1989
- 41970 to 1979
- 01960 to 1969
- 01950 to 1959
- 51940 to 1949
- 01939 or earlier
![Zip code 63370 satellite photo by USGS]()
- Bedrooms in owner-occupied houses and condos in 63370
- 0no bedroom
- 01 bedroom
- 02 bedrooms
- 93 bedrooms
- 04 bedrooms
- 05+ bedrooms
- Cars and other vehicles available in 63370 in owner-occupied houses/condos
- 5no vehicle
- 01 vehicle
- 02 vehicles
- 43 vehicles
- 04 vehicles
- 05+ vehicles
Zip code 63370 household income distribution in 2022
![Zip code 63370 household income distribution in 2022]()
- 3$15,000 to $19,999
- 3$50,000 to $59,999
Estimate of home value of owner-occupied houses/condos in 2022 in zip code 63370
![Estimate of home value of owner-occupied houses/condos in 2022 in zip code 63370]()
- 3$40,000 to $49,999
- 2$100,000 to $124,999
Estimated median house (or condo) value in 2022 for:
- White Non-Hispanic householders: $418,094
Housing units in structures:
Household type by relationship:
Households: 13
- Male householders: 4 (0 living alone), Female householders: 5 (5 living alone)
4 spouses (4 opposite-sex spouses), 0 unmarried partners, (0 opposite-sex unmarried partners), 0 children (0 natural, 0 adopted, 0 stepchildren), 0 grandchildren, 0 brothers or sisters, 0 parents, 0 foster children, 0 other relatives, 0 non-relatives
Size of family households: 4 2-persons
Size of nonfamily households: 5 1-person
107.7% of residents of 63370 zip code speak English at home.
Foreign born population: 0 (0.0%)

- 55.8%Bottled, tank, or LP gas
- 47.8%Electricity
Population in 1990: 351.
Place of birth for U.S.-born residents:
40% of the 63370 zip code residents lived in the same house 5 years ago.
Out of people who lived in different houses, 25% lived in this county.
100% of the 63370 zip code residents lived in the same house 1 year ago.
Top industries in this zip code by the number of employees in 2005:
- Professional, Scientific, and Technical Services: Environmental Consulting Services (10-19 employees: 1 establishment)
- Other Services (except Public Administration): Religious Organizations (1-4: 1)
Home Mortgage Disclosure Act Aggregated Statistics For Year 2009
(Based on 2 partial tracts)
|
| A) FHA, FSA/RHS & VA
Home Purchase Loans | B) Conventional
Home Purchase Loans | C) Refinancings
|
|---|
| Number | Average Value | Number | Average Value | Number | Average Value |
|---|
| LOANS ORIGINATED | 1 | $90,020 | 1 | $139,520 | 6 | $155,912 |
| APPLICATIONS APPROVED, NOT ACCEPTED | 0 | $0 | 0 | $0 | 0 | $0 |
| APPLICATIONS DENIED | 0 | $0 | 0 | $0 | 2 | $135,105 |
| APPLICATIONS WITHDRAWN | 0 | $0 | 0 | $0 | 1 | $134,290 |
| FILES CLOSED FOR INCOMPLETENESS | 0 | $0 | 0 | $0 | 0 | $0 |
Aggregated Statistics For Year 2008
(Based on 2 partial tracts)
|
| B) Conventional
Home Purchase Loans | C) Refinancings
| G) Loans On Manufactured
Home Dwelling (A B C & D) |
|---|
| Number | Average Value | Number | Average Value | Number | Average Value |
|---|
| LOANS ORIGINATED | 1 | $215,220 | 4 | $152,912 | 1 | $37,690 |
| APPLICATIONS APPROVED, NOT ACCEPTED | 0 | $0 | 0 | $0 | 0 | $0 |
| APPLICATIONS DENIED | 0 | $0 | 2 | $155,025 | 0 | $0 |
| APPLICATIONS WITHDRAWN | 0 | $0 | 1 | $140,260 | 0 | $0 |
| FILES CLOSED FOR INCOMPLETENESS | 0 | $0 | 0 | $0 | 0 | $0 |
Aggregated Statistics For Year 2007
(Based on 2 partial tracts)
|
| B) Conventional
Home Purchase Loans | C) Refinancings
| G) Loans On Manufactured
Home Dwelling (A B C & D) |
|---|
| Number | Average Value | Number | Average Value | Number | Average Value |
|---|
| LOANS ORIGINATED | 2 | $157,885 | 3 | $181,433 | 1 | $66,030 |
| APPLICATIONS APPROVED, NOT ACCEPTED | 0 | $0 | 1 | $109,620 | 0 | $0 |
| APPLICATIONS DENIED | 0 | $0 | 2 | $198,740 | 0 | $0 |
| APPLICATIONS WITHDRAWN | 0 | $0 | 1 | $148,850 | 0 | $0 |
| FILES CLOSED FOR INCOMPLETENESS | 0 | $0 | 0 | $0 | 0 | $0 |
Aggregated Statistics For Year 2006
(Based on 2 partial tracts)
|
| B) Conventional
Home Purchase Loans | C) Refinancings
| D) Home Improvement Loans
| G) Loans On Manufactured
Home Dwelling (A B C & D) |
|---|
| Number | Average Value | Number | Average Value | Number | Average Value | Number | Average Value |
|---|
| LOANS ORIGINATED | 3 | $153,760 | 4 | $140,885 | 0 | $0 | 1 | $64,680 |
| APPLICATIONS APPROVED, NOT ACCEPTED | 0 | $0 | 1 | $127,480 | 0 | $0 | 0 | $0 |
| APPLICATIONS DENIED | 1 | $84,400 | 3 | $122,067 | 1 | $28,350 | 0 | $0 |
| APPLICATIONS WITHDRAWN | 0 | $0 | 1 | $196,020 | 0 | $0 | 0 | $0 |
| FILES CLOSED FOR INCOMPLETENESS | 0 | $0 | 0 | $0 | 0 | $0 | 0 | $0 |
Aggregated Statistics For Year 2005
(Based on 2 partial tracts)
|
| B) Conventional
Home Purchase Loans | C) Refinancings
| G) Loans On Manufactured
Home Dwelling (A B C & D) |
|---|
| Number | Average Value | Number | Average Value | Number | Average Value |
|---|
| LOANS ORIGINATED | 3 | $128,243 | 4 | $157,175 | 1 | $44,020 |
| APPLICATIONS APPROVED, NOT ACCEPTED | 0 | $0 | 1 | $80,190 | 0 | $0 |
| APPLICATIONS DENIED | 1 | $63,560 | 2 | $133,900 | 1 | $52,050 |
| APPLICATIONS WITHDRAWN | 0 | $0 | 1 | $189,480 | 0 | $0 |
| FILES CLOSED FOR INCOMPLETENESS | 0 | $0 | 0 | $0 | 0 | $0 |
Aggregated Statistics For Year 2004
(Based on 2 partial tracts)
|
| B) Conventional
Home Purchase Loans | C) Refinancings
| G) Loans On Manufactured
Home Dwelling (A B C & D) |
|---|
| Number | Average Value | Number | Average Value | Number | Average Value |
|---|
| LOANS ORIGINATED | 2 | $142,105 | 4 | $127,845 | 1 | $60,120 |
| APPLICATIONS APPROVED, NOT ACCEPTED | 0 | $0 | 1 | $96,050 | 0 | $0 |
| APPLICATIONS DENIED | 1 | $56,550 | 2 | $120,535 | 1 | $63,220 |
| APPLICATIONS WITHDRAWN | 0 | $0 | 1 | $182,990 | 0 | $0 |
| FILES CLOSED FOR INCOMPLETENESS | 0 | $0 | 0 | $0 | 0 | $0 |
Aggregated Statistics For Year 2003
(Based on 2 partial tracts)
|
| B) Conventional
Home Purchase Loans | C) Refinancings
|
|---|
| Number | Average Value | Number | Average Value |
|---|
| LOANS ORIGINATED | 2 | $128,610 | 7 | $121,651 |
| APPLICATIONS APPROVED, NOT ACCEPTED | 0 | $0 | 1 | $113,360 |
| APPLICATIONS DENIED | 0 | $0 | 2 | $116,740 |
| APPLICATIONS WITHDRAWN | 0 | $0 | 1 | $153,050 |
| FILES CLOSED FOR INCOMPLETENESS | 0 | $0 | 0 | $0 |
Private Mortgage Insurance Companies Aggregated Statistics For Year 2004
(Based on 2 partial tracts)
|
| A) Conventional
Home Purchase Loans |
|---|
| Number | Average Value |
|---|
| LOANS ORIGINATED | 1 | $67,590 |
| APPLICATIONS APPROVED, NOT ACCEPTED | 0 | $0 |
| APPLICATIONS DENIED | 0 | $0 |
| APPLICATIONS WITHDRAWN | 0 | $0 |
| FILES CLOSED FOR INCOMPLETENESS | 0 | $0 |
Aggregated Statistics For Year 2003
(Based on 2 partial tracts)
|
| B) Refinancings
|
|---|
| Number | Average Value |
|---|
| LOANS ORIGINATED | 1 | $86,780 |
| APPLICATIONS APPROVED, NOT ACCEPTED | 0 | $0 |
| APPLICATIONS DENIED | 0 | $0 |
| APPLICATIONS WITHDRAWN | 0 | $0 |
| FILES CLOSED FOR INCOMPLETENESS | 0 | $0 |
 100% rural population.


 Nearest zip codes: 63333, 63381, 63359, 63377, 63349, 63334.


