Estimated zip code population in 2022: 3,660 Zip code population in 2010: 4,276 Zip code population in 2000: 4,155
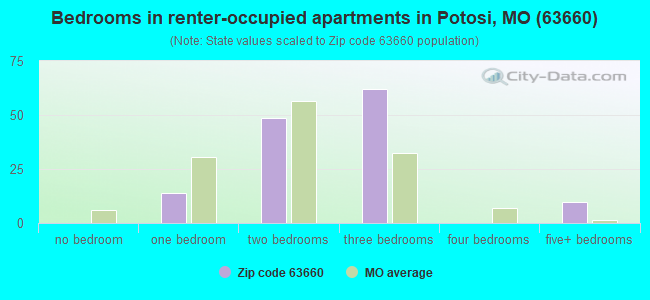
Houses and condos: 1,151 Renter-occupied apartments: 135
% of renters here:
14%
State:
32%
March 2022 cost of living index in zip code 63660: 75.7 (low, U.S. average is 100)
Land area: 37.3 sq. mi. Water area: 0.2 sq. mi.
Population density: 98 people per square mile
(very low).
OSM Map
General Map
Google Map
MSN Map
OSM Map
General Map
Google Map
MSN Map
OSM Map
General Map
Google Map
MSN Map
OSM Map
General Map
Google Map
MSN Map
Please wait while loading the map...
Real estate property taxes paid for housing units in 2022:
This zip code:
0.4% ($411)
Missouri:
0.8% ($1,810)
Median real estate property taxes paid for housing units with mortgages in 2022: $539 (0.5%) Median real estate property taxes paid for housing units with no mortgage in 2022: $336 (0.3%)
Business Search- 14 Million verified businesses
Males: 2,141
(58.5%)
Females: 1,518
(41.5%)
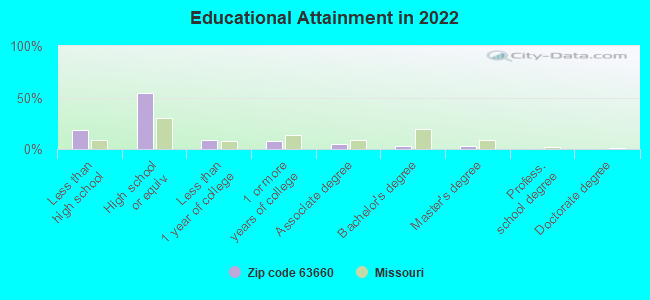
For population 25 years and over in 63660:
High school or higher: 80.3%
Bachelor's degree or higher: 5.7%
Graduate or professional degree: 3.2%
Unemployed: 1.3%
Mean travel time to work (commute): 40.1 minutes
For population 15 years and over in 63660:
Never married: 39.5%
Now married: 38.4%
Separated: 0.4%
Widowed: 8.1%
Divorced: 13.5%
Zip code 63660 compared to state average:
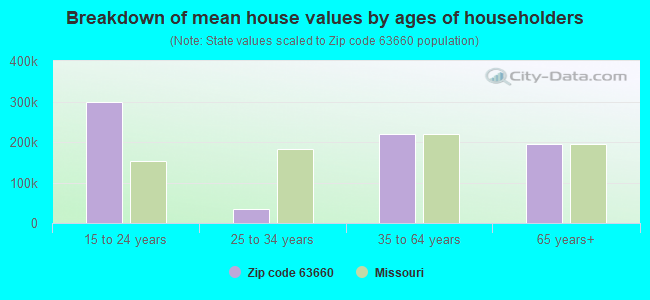
Median house value below state average.
Unemployed percentage significantly below state average.
Hispanic race population percentage below state average.
Foreign-born population percentage significantly below state average.
Renting percentage significantly below state average.
Number of college students significantly below state average.
Percentage of population with a bachelor's degree or higher significantly below state average.
Averages for the 2020 tax year for zip code 63660, filed in 2021:
Average Adjusted Gross Income (AGI) in 2020: $37,351 (Individual Income Tax Returns)
Here:
$37,351
State:
$68,151
Salary/wage: $34,834 (reported on 84.9% of returns)
Here:
$34,834
State:
$56,131
(% of AGI for various income ranges: 1260.2% for AGIs below $25k, 3485.6% for AGIs $25k-50k, 6267.7% for AGIs $50k-75k, 9275.0% for AGIs $75k-100k, 17227.5% for AGIs $100k-200k)
Taxable interest for individuals: $426 (reported on 16.0% of returns)
This zip code:
$426
Missouri:
$1,586
(% of AGI for various income ranges: 5.4% for AGIs below $25k, 6.3% for AGIs $25k-50k, 14.6% for AGIs $50k-75k, 57.5% for AGIs $100k-200k)
Ordinary dividends: $650 (reported on 5.0% of returns)
Here:
$650
State:
$10,947
(% of AGI for various income ranges: 3.2% for AGIs below $25k, 20.0% for AGIs $50k-75k)
Net capital gain/loss in AGI: +$7,800 (reported on 5.0% of returns)
Here:
+$7,800
State:
+$18,453
(% of AGI for various income ranges: 41.7% for AGIs below $25k, 228.5% for AGIs $50k-75k)
Profit/loss from business: +$4,321 (reported on 11.8% of returns)
Here:
+$4,321
State:
+$12,260
(% of AGI for various income ranges: 92.4% for AGIs below $25k, 81.9% for AGIs $25k-50k, 3.8% for AGIs $50k-75k)
Taxable individual retirement arrangement distribution: $8,300 (reported on 3.4% of returns)
63660:
$8,300
Missouri:
$19,719
(% of AGI for various income ranges: 123.0% for AGIs $25k-50k)
Earned income credit: $2,518 (reported on 27.7% of returns)
Here:
$2,518
State:
$2,315
(% of AGI for various income ranges: 136.8% for AGIs below $25k, 100.0% for AGIs $25k-50k)
Percentage of individuals using paid preparers for their 2020 taxes: 93.3%
Here:
93%
State:
93%
(% for various income ranges: 89.1% for AGIs below $25k, 96.9% for AGIs $25k-50k, 94.1% for AGIs $50k-75k, 100.0% for AGIs $75k-100k, 100.0% for AGIs $100k-200k)
Averages for the 2012 tax year for zip code 63660, filed in 2013:
Average Adjusted Gross Income (AGI) in 2012: $31,371 (Individual Income Tax Returns)
Here:
$31,371
State:
$55,896
Salary/wage: $28,705 (reported on 88.9% of returns)
Here:
$28,705
State:
$46,205
(% of AGI for various income ranges: 76.8% for AGIs below $25k, 84.6% for AGIs $25k-50k, 84.8% for AGIs $50k-75k, 86.5% for AGIs $75k-100k, 72.2% for AGIs $100k-200k)
Taxable interest for individuals: $621 (reported on 16.2% of returns)
This zip code:
$621
Missouri:
$1,559
(% of AGI for various income ranges: 0.7% for AGIs below $25k, 0.4% for AGIs $25k-50k, 0.1% for AGIs $50k-75k, 0.2% for AGIs $75k-100k)
Ordinary dividends: $500 (reported on 6.0% of returns)
Here:
$500
State:
$7,410
Net capital gain/loss in AGI: +$1,180 (reported on 4.3% of returns)
Here:
+$1,180
State:
+$11,579
Profit/loss from business: +$3,408 (reported on 10.3% of returns)
Here:
+$3,408
State:
+$11,688
(% of AGI for various income ranges: 4.9% for AGIs below $25k, 0.2% for AGIs $25k-50k)
Taxable individual retirement arrangement distribution: $7,600 (reported on 4.3% of returns)
63660:
$7,600
Missouri:
$14,773
Total itemized deductions: $18,100 (23% of AGI, reported on 8.5% of returns)
Here:
$18,100
State:
$22,730
Here:
23.3% of AGI
State:
19.2% of AGI
(% of AGI for various income ranges: 5.2% for AGIs $25k-50k, 9.5% for AGIs $50k-75k, 8.7% for AGIs $100k-200k)
Charity contributions: $3,140 (reported on 4.3% of returns)
Here:
$3,140
State:
$4,745
Taxes paid: $4,460 (reported on 8.5% of returns)
63660:
$4,460
State:
$8,399
(% of AGI for various income ranges: 0.8% for AGIs $25k-50k, 2.1% for AGIs $50k-75k, 3.6% for AGIs $100k-200k)
Earned income credit: $2,419 (reported on 36.8% of returns)
Here:
$2,419
State:
$2,288
(% of AGI for various income ranges: 9.9% for AGIs below $25k, 2.1% for AGIs $25k-50k)
Percentage of individuals using paid preparers for their 2012 taxes: 59.0%
Here:
59%
State:
55%
(% for various income ranges: 54.7% for AGIs below $25k, 61.3% for AGIs $25k-50k, 69.2% for AGIs $50k-75k, 60.0% for AGIs $75k-100k, 75.0% for AGIs $100k-200k)
Averages for the 2004 tax year for zip code 63660, filed in 2005:
Average Adjusted Gross Income (AGI) in 2004: $26,740 (Individual Income Tax Returns)
Here:
$26,740
State:
$44,591
Salary/wage: $25,633 (reported on 91.4% of returns)
Here:
$25,633
State:
$38,941
(% of AGI for various income ranges: 86.8% for AGIs below $10k, 84.2% for AGIs $10k-25k, 89.9% for AGIs $25k-50k, 93.9% for AGIs $50k-75k, 135.8% for AGIs $75k-100k)
Taxable interest for individuals: $507 (reported on 19.1% of returns)
This zip code:
$507
Missouri:
$1,801
(% of AGI for various income ranges: 0.7% for AGIs below $10k, 0.6% for AGIs $10k-25k, 0.3% for AGIs $25k-50k, 0.1% for AGIs $50k-75k, 0.6% for AGIs $75k-100k)
Taxable dividends: $909 (reported on 5.6% of returns)
Here:
$909
State:
$3,677
(% of AGI for various income ranges: 1.7% for AGIs below $10k, 0.4% for AGIs $10k-25k, 0.0% for AGIs $25k-50k, 0.0% for AGIs $50k-75k)
Net capital gain/loss: +$446 (reported on 4.7% of returns)
Here:
+$446
State:
+$8,915
(% of AGI for various income ranges: 0.4% for AGIs below $10k, 0.2% for AGIs $10k-25k, 0.0% for AGIs $25k-50k, -0.0% for AGIs $50k-75k)
Profit/loss from business: +$3,542 (reported on 10.2% of returns)
Here:
+$3,542
State:
+$9,793
(% of AGI for various income ranges: 9.5% for AGIs below $10k, 2.0% for AGIs $10k-25k, 1.3% for AGIs $25k-50k, -0.2% for AGIs $50k-75k)
Total itemized deductions: $14,262 (24% of AGI, reported on 8.7% of returns)
Here:
$14,262
State:
$18,261
Here:
24.3% of AGI
State:
20.5% of AGI
(% of AGI for various income ranges: 2.3% for AGIs $10k-25k, 3.7% for AGIs $25k-50k, 7.0% for AGIs $50k-75k, 15.1% for AGIs $75k-100k)
Charity contributions deductions: $2,431 (4% of AGI, reported on 5.5% of returns)
Here:
$2,431
State:
$3,665
Here:
3.9% of AGI
State:
3.9% of AGI
Total tax: $2,755 (reported on 62.8% of returns)
63660:
$2,755
State:
$6,999
(% of AGI for various income ranges: 2.3% for AGIs below $10k, 2.9% for AGIs $10k-25k, 5.4% for AGIs $25k-50k, 7.8% for AGIs $50k-75k, 9.5% for AGIs $75k-100k, 19.6% for AGIs over 100k)
Earned income credit: $1,810 (reported on 32.1% of returns)
Here:
$1,810
State:
$1,728
Percentage of individuals using paid preparers for their 2004 taxes: 64.3%
Here:
64%
State:
62%
(% for various income ranges: 58.2% for AGIs below $10k, 65.2% for AGIs $10k-25k, 64.4% for AGIs $25k-50k, 73.3% for AGIs $50k-75k, 65.5% for AGIs $75k-100k, 90.9% for AGIs over 100k)
Household received Food Stamps/SNAP in the past 12 months: 220 Household did not receive Food Stamps/SNAP in the past 12 months: 750
Women who had a birth in the past 12 months: 104 (100 now married, 0 unmarried) Women who did not have a birth in the past 12 months: 535 (172 now married, 363 unmarried)
Housing units in zip code 63660 with a mortgage: 309 (25 second mortgage, 24 both second mortgage and home equity loan) Median monthly owner costs for units with a mortgage: $838 Median monthly owner costs for units without a mortgage: $354
Residents with income below the poverty level in 2022:
This zip code:
29.9%
Whole state:
13.2%
Residents with income below 50% of the poverty level in 2022:
This zip code:
16.4%
Whole state:
6.8%
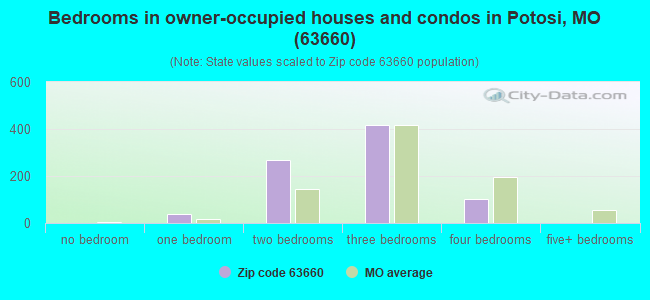
Median number of rooms in houses and condos:
Here:
5.7
State:
6.4
Median number of rooms in apartments:
Here:
5.0
State:
4.4
Notable locations in this zip code not listed on our city pages
Notable locations in zip code 63660: City of Potosi Waste Water Plant (A), Hopewell Community Center (B), Mineral Point Town Hall (C). Display/hide their locations on the map
Churches in zip code 63660 include: Pleasant Valley Chapel (A), Hopewell Union Church (B), Hopewell Assembly of God Church (C), Unity Southern Baptist Church (D), Big River Church (E), Hopewell Church of God (F), Stoney Point Missionary Baptist Church (G), United Methodist Church (H), New Diggens Tabernacle (I). Display/hide their locations on the map
Streams, rivers, and creeks: East Branch Mill Creek (A), Rubeneau Branch (B), West Branch Mill Creek (C), Hopewell Creek (D). Display/hide their locations on the map
In group quarters: 804 (-1 institutionalized population)
Size of family households: 255 2-persons, 136 3-persons, 162 4-persons, 128 5-persons, 50 6-persons, 26 7-or-more-persons
Size of nonfamily households: 175 1-person, 26 2-persons, 3 3-persons
462 married couples with children.
167 single-parent households (56 men, 111 women).
98.4% of residents of 63660 zip code speak English at home.
1.3% of residents speak Spanish at home (86% very well, 14% not well).
0.1% of residents speak other Indo-European language at home (100% very well).
Foreign born population: 21 (0.6%) (100.0% of them are naturalized citizens)
This zip code:
0.6%
Whole state:
4.1%
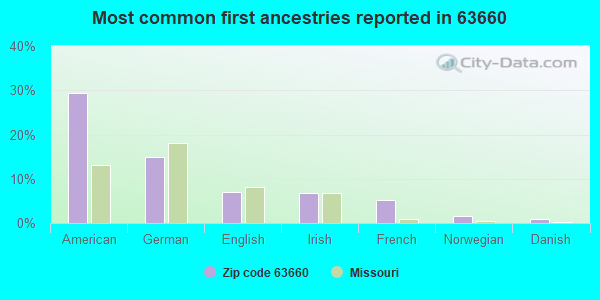
29%American
15%German
7%English
7%Irish
5%French
2%Norwegian
1%Danish
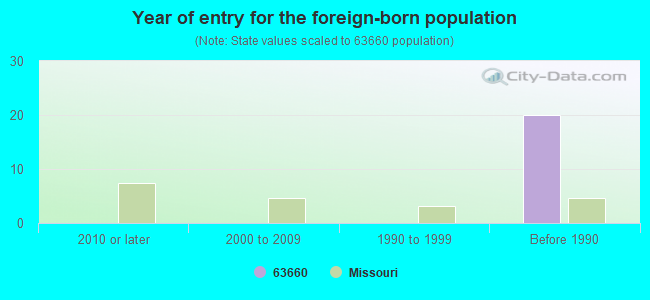
Year of entry for the foreign-born population
02010 or later
02000 to 2009
01990 to 1999
20Before 1990
Facilities with environmental interests located in this zip code:
POTOSI CORRECTIONAL CENTER-MO DEPT CRCTN (STATE ROUTE O in MINERAL POINT, MO)
AIR MINOR (AIRS/AFS) STATE MASTER (Missouri monitoring and compilance) - RCRAINFO-MOD981819618, NOT IN A UNIVERSE (Resource Conservation and Recovery Act (tracking hazardous waste)) Business SIC classification: CORRECTIONAL INSTITUTIONS Organizations: STATE OF MISSOURI (CONTACT/OWNER)
Alternative names: POTOSI CORRECTIONAL CTR
ARNOLD VANCE (ROUTE 2 in MINERAL POINT, MO)
STATE MASTER (Missouri monitoring and compilance) - PCS-MO0090522, NPDES NON-MAJOR National Pollutant Discharge Elimination System NON-MAJOR (Tracking pollutant discharge elimination systems) - permit Business SIC classification: SEWERAGE SYSTEMS Alternative names: SUMMIT ACRES MHP
BULK TANK INC (HWY O SOUTH in MINERAL POINT, MO)
STATE MASTER (Missouri monitoring and compilance) - RCRAINFO-MOD985820588, NOT IN A UNIVERSE (Resource Conservation and Recovery Act (tracking hazardous waste)) Organizations: DAVID E SISK (CONTACT/OWNER)
BSC TRUCK (RURAL ROUTE 1 BOX 148A in MINERAL POINT, MO)
National Pollutant Discharge Elimination System NON-MAJOR (Tracking pollutant discharge elimination systems) - permit Business SIC classification: TERMINAL AND JOINT TERMINAL MAINTENANCE FACILITIES FOR MOTOR FREIGHT TRANSPORTATION Organizations: BSC TRUCK INC (CONTACT/OWNER)
Alternative names: WILLIAM O COLEMAN
AMERENUE POTOSI WHQ (10040 AMEREN DR in MINERAL POINT, MO)
Small Quantity Generators, between 100 kg and 1000 kg of hazardous waste/month (Resource Conservation and Recovery Act (tracking hazardous waste))
Housing units lacking complete plumbing facilities: 6.3% Housing units lacking complete kitchen facilities: 2.7%
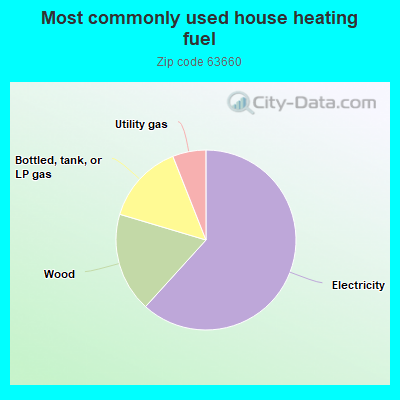
61.8%Electricity
17.9%Wood
14.4%Bottled, tank, or LP gas
6.0%Utility gas
Population in 1990: 4,032. Population change in the 1990s: +123 (+3.1%).
Place of birth for U.S.-born residents:
This state: 3,189
Northeast: 14
Midwest: 212
South: 165
West: 45
54% of the 63660 zip code residents lived in the same house 5 years ago. Out of people who lived in different houses, 35% lived in this county. Out of people who lived in different counties, 50% lived in Missouri.
82% of the 63660 zip code residents lived in the same house 1 year ago. Out of people who lived in different houses, 23% moved from this county. Out of people who lived in different houses, 71% moved from different county within same state. Out of people who lived in different houses, 4% moved from different state. Out of people who lived in different houses, 1% moved from abroad.
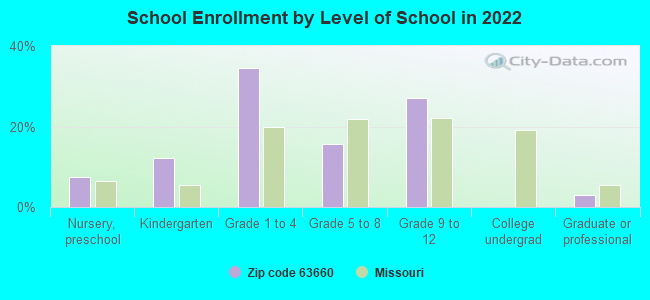
Private vs. public school enrollment:
Students in private schools in grades 1 to 8 (elementary and middle school):
Here:
0.0%
Missouri:
15.4%
Students in private schools in grades 9 to 12 (high school):
Here:
0.0%
Missouri:
13.9%
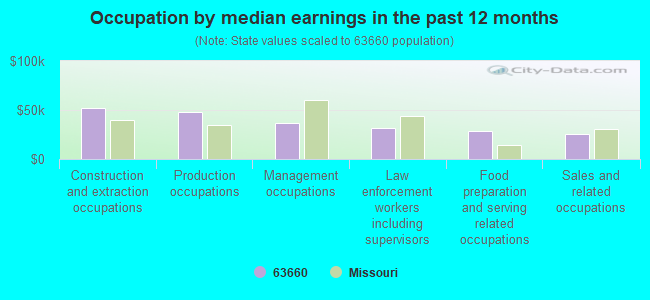
Occupation by median earnings in the past 12 months ($)
52,223Construction and extraction occupations
47,522Production occupations
37,141Management occupations
32,042Law enforcement workers including supervisors
28,360Food preparation and serving related occupations
25,897Sales and related occupations
Top industries in this zip code by the number of employees in 2005:
Health Care and Social Assistance: All Other Outpatient Care Centers (20-49 employees: 1 establishment)
Other Services (except Public Administration): Religious Organizations (5-9: 1, 1-4: 1)
Construction: New Single-Family Housing Construction (except Operative Builders) (5-9: 1, 1-4: 1)
Health Care and Social Assistance: Nursing Care Facilities (5-9: 1)
Construction: Poured Concrete Foundation and Structure Contractors (5-9: 1)
People in group quarters in 2010:
899 people in state prisons
13 people in nursing facilities/skilled-nursing facilities
People in group quarters in 2000:
915 people in state prisons
26 people in other noninstitutional group quarters
13 people in other nonhousehold living situations
Fatal accident statistics in 2013:
Fatal accident count: 2
Vehicles involved in fatal accidents: 3
Fatal accidents caused by drunken drivers: 1
Fatalities: 2
Persons involved in fatal accidents: 4
Pedestrians involved in fatal accidents: 0
Fatal accident statistics in 2011:
Fatal accident count: 2
Vehicles involved in fatal accidents: 2
Fatal accidents caused by drunken drivers: 1
Fatalities: 2
Persons involved in fatal accidents: 2
Pedestrians involved in fatal accidents: 0
2002 - 2018 National Fire Incident Reporting System (NFIRS) incidents
Based on the data from the years 2002 - 2018 the average number of fire incidents per year is 43. The highest number of fires - 64 took place in 2006, and the least - 17 in 2002. The data has a growing trend.
When looking into fire subcategories, the most reports belonged to: Outside Fires (40.5%), and Structure Fires (37.6%).
Fire incident types reported to NFIRS in Zip Code 63660

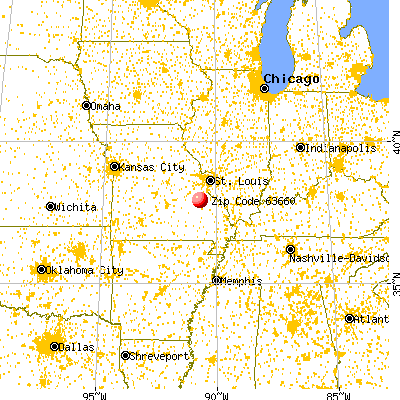


 Nearest zip codes: 63648, 63653, 63630, 63674, 63626, 63624.


 Based on the data from the years 2002 - 2018 the average number of fire incidents per year is 43. The highest number of fires - 64 took place in 2006, and the least - 17 in 2002. The data has a growing trend.
 When looking into fire subcategories, the most reports belonged to: Outside Fires (40.5%), and Structure Fires (37.6%).