Estimated zip code population in 2022: 3,273 Zip code population in 2010: 3,326 Zip code population in 2000: 3,156
Houses and condos: 1,344 Renter-occupied apartments: 307
% of renters here:
26%
State:
32%
March 2022 cost of living index in zip code 63960: 75.5 (low, U.S. average is 100)
Land area: 118.7 sq. mi. Water area: 3.3 sq. mi.
Population density: 28 people per square mile
(very low).
OSM Map
General Map
Google Map
MSN Map
OSM Map
General Map
Google Map
MSN Map
OSM Map
General Map
Google Map
MSN Map
OSM Map
General Map
Google Map
MSN Map
Please wait while loading the map...
Real estate property taxes paid for housing units in 2022:
This zip code:
0.6% ($623)
Missouri:
0.8% ($1,810)
Median real estate property taxes paid for housing units with mortgages in 2022: $756 (0.5%) Median real estate property taxes paid for housing units with no mortgage in 2022: $575 (0.7%)
Business Search- 14 Million verified businesses
Males: 1,624
(49.6%)
Females: 1,648
(50.4%)
For population 25 years and over in 63960:
High school or higher: 80.6%
Bachelor's degree or higher: 13.9%
Graduate or professional degree: 3.7%
Unemployed: 4.5%
Mean travel time to work (commute): 25.8 minutes
For population 15 years and over in 63960:
Never married: 22.3%
Now married: 56.4%
Separated: 0.6%
Widowed: 5.6%
Divorced: 15.1%
Zip code 63960 compared to state average:
Median house value below state average.
Black race population percentage significantly below state average.
Hispanic race population percentage significantly below state average.
Foreign-born population percentage significantly below state average.
Number of college students below state average.
Percentage of population with a bachelor's degree or higher significantly below state average.
Averages for the 2020 tax year for zip code 63960, filed in 2021:
Average Adjusted Gross Income (AGI) in 2020: $45,102 (Individual Income Tax Returns)
Here:
$45,102
State:
$68,151
Salary/wage: $41,925 (reported on 79.4% of returns)
Here:
$41,925
State:
$56,131
(% of AGI for various income ranges: 1248.5% for AGIs below $25k, 3681.0% for AGIs $25k-50k, 6160.8% for AGIs $50k-75k, 8016.7% for AGIs $75k-100k, 22826.0% for AGIs $100k-200k)
Taxable interest for individuals: $832 (reported on 29.4% of returns)
This zip code:
$832
Missouri:
$1,586
(% of AGI for various income ranges: 23.8% for AGIs below $25k, 18.7% for AGIs $25k-50k, 56.9% for AGIs $50k-75k, 55.6% for AGIs $75k-100k, 94.0% for AGIs $100k-200k)
Ordinary dividends: $1,540 (reported on 7.9% of returns)
Here:
$1,540
State:
$10,947
(% of AGI for various income ranges: 13.3% for AGIs $25k-50k, 70.0% for AGIs $50k-75k, 46.0% for AGIs $100k-200k)
Net capital gain/loss in AGI: +$6,327 (reported on 8.7% of returns)
Here:
+$6,327
State:
+$18,453
(% of AGI for various income ranges: 21.5% for AGIs below $25k, 123.8% for AGIs $50k-75k, 924.0% for AGIs $100k-200k)
Profit/loss from business: +$10,261 (reported on 18.3% of returns)
Here:
+$10,261
State:
+$12,260
(% of AGI for various income ranges: 152.4% for AGIs below $25k, 83.7% for AGIs $25k-50k, 418.5% for AGIs $50k-75k, 2094.0% for AGIs $100k-200k)
Taxable individual retirement arrangement distribution: $9,400 (reported on 5.6% of returns)
63960:
$9,400
Missouri:
$19,719
(% of AGI for various income ranges: 73.2% for AGIs below $25k, 314.6% for AGIs $50k-75k)
Total itemized deductions: $26,575 (reported on 3.2% of returns)
Here:
$26,575
State:
$36,651
(% of AGI for various income ranges: 1181.1% for AGIs $75k-100k)
Charity contributions: $16,033 (reported on 2.4% of returns)
Here:
$16,033
State:
$15,671
(% of AGI for various income ranges: 534.4% for AGIs $75k-100k)
Taxes paid: $5,750 (reported on 3.2% of returns)
63960:
$5,750
State:
$7,608
(% of AGI for various income ranges: 255.6% for AGIs $75k-100k)
Earned income credit: $2,397 (reported on 24.6% of returns)
Here:
$2,397
State:
$2,315
(% of AGI for various income ranges: 126.5% for AGIs below $25k, 104.3% for AGIs $25k-50k)
Percentage of individuals using paid preparers for their 2020 taxes: 96.0%
Here:
96%
State:
93%
(% for various income ranges: 96.0% for AGIs below $25k, 94.6% for AGIs $25k-50k, 100.0% for AGIs $50k-75k, 91.7% for AGIs $75k-100k, 100.0% for AGIs $100k-200k)
Averages for the 2012 tax year for zip code 63960, filed in 2013:
Average Adjusted Gross Income (AGI) in 2012: $38,836 (Individual Income Tax Returns)
Here:
$38,836
State:
$55,896
Salary/wage: $34,104 (reported on 82.5% of returns)
Here:
$34,104
State:
$46,205
(% of AGI for various income ranges: 74.4% for AGIs below $25k, 78.0% for AGIs $25k-50k, 78.2% for AGIs $50k-75k, 72.4% for AGIs $75k-100k, 57.9% for AGIs $100k-200k)
Taxable interest for individuals: $1,012 (reported on 28.1% of returns)
This zip code:
$1,012
Missouri:
$1,559
(% of AGI for various income ranges: 1.6% for AGIs below $25k, 0.6% for AGIs $25k-50k, 0.7% for AGIs $50k-75k, 0.7% for AGIs $75k-100k, 0.3% for AGIs $100k-200k)
Ordinary dividends: $882 (reported on 9.6% of returns)
Here:
$882
State:
$7,410
(% of AGI for various income ranges: 0.5% for AGIs below $25k, 0.2% for AGIs $25k-50k, 0.1% for AGIs $50k-75k, 0.3% for AGIs $100k-200k)
Net capital gain/loss in AGI: +$1,300 (reported on 7.0% of returns)
Here:
+$1,300
State:
+$11,579
Profit/loss from business: +$6,962 (reported on 18.4% of returns)
Here:
+$6,962
State:
+$11,688
(% of AGI for various income ranges: 6.6% for AGIs below $25k, 2.5% for AGIs $25k-50k, 3.0% for AGIs $50k-75k, 6.4% for AGIs $75k-100k)
Taxable individual retirement arrangement distribution: $9,675 (reported on 7.0% of returns)
63960:
$9,675
Missouri:
$14,773
(% of AGI for various income ranges: 2.4% for AGIs below $25k, 1.5% for AGIs $25k-50k, 6.5% for AGIs $75k-100k)
Total itemized deductions: $17,485 (24% of AGI, reported on 17.5% of returns)
Here:
$17,485
State:
$22,730
Here:
24.4% of AGI
State:
19.2% of AGI
(% of AGI for various income ranges: 6.0% for AGIs below $25k, 5.5% for AGIs $25k-50k, 8.1% for AGIs $50k-75k, 9.3% for AGIs $75k-100k, 11.1% for AGIs $100k-200k)
Charity contributions: $4,177 (reported on 11.4% of returns)
Here:
$4,177
State:
$4,745
(% of AGI for various income ranges: 1.1% for AGIs $25k-50k, 1.2% for AGIs $50k-75k, 1.0% for AGIs $75k-100k, 2.4% for AGIs $100k-200k)
Taxes paid: $4,405 (reported on 17.5% of returns)
63960:
$4,405
State:
$8,399
(% of AGI for various income ranges: 0.7% for AGIs below $25k, 0.8% for AGIs $25k-50k, 2.3% for AGIs $50k-75k, 2.1% for AGIs $75k-100k, 4.0% for AGIs $100k-200k)
Earned income credit: $2,300 (reported on 27.2% of returns)
Here:
$2,300
State:
$2,288
(% of AGI for various income ranges: 8.3% for AGIs below $25k, 1.5% for AGIs $25k-50k)
Percentage of individuals using paid preparers for their 2012 taxes: 64.0%
Here:
64%
State:
55%
(% for various income ranges: 59.6% for AGIs below $25k, 65.6% for AGIs $25k-50k, 68.8% for AGIs $50k-75k, 62.5% for AGIs $75k-100k, 83.3% for AGIs $100k-200k)
Averages for the 2004 tax year for zip code 63960, filed in 2005:
Average Adjusted Gross Income (AGI) in 2004: $28,632 (Individual Income Tax Returns)
Here:
$28,632
State:
$44,591
Salary/wage: $27,180 (reported on 83.5% of returns)
Here:
$27,180
State:
$38,941
(% of AGI for various income ranges: 144.0% for AGIs below $10k, 76.6% for AGIs $10k-25k, 85.9% for AGIs $25k-50k, 82.7% for AGIs $50k-75k, 74.1% for AGIs $75k-100k, 34.4% for AGIs over 100k)
Taxable interest for individuals: $1,193 (reported on 36.8% of returns)
This zip code:
$1,193
Missouri:
$1,801
(% of AGI for various income ranges: 8.5% for AGIs below $10k, 2.6% for AGIs $10k-25k, 0.8% for AGIs $25k-50k, 0.9% for AGIs $50k-75k, 1.6% for AGIs $75k-100k, 2.0% for AGIs over 100k)
Taxable dividends: $963 (reported on 9.1% of returns)
Here:
$963
State:
$3,677
(% of AGI for various income ranges: 0.9% for AGIs below $10k, 1.0% for AGIs $10k-25k, 0.1% for AGIs $25k-50k, 0.2% for AGIs $50k-75k, 0.1% for AGIs $75k-100k)
Net capital gain/loss: +$3,266 (reported on 9.2% of returns)
Here:
+$3,266
State:
+$8,915
(% of AGI for various income ranges: 3.9% for AGIs below $10k, 0.5% for AGIs $10k-25k, 1.5% for AGIs $25k-50k, 0.6% for AGIs $50k-75k, 1.6% for AGIs $75k-100k)
Profit/loss from business: +$7,356 (reported on 19.0% of returns)
Here:
+$7,356
State:
+$9,793
(% of AGI for various income ranges: 19.1% for AGIs below $10k, 6.3% for AGIs $10k-25k, 3.8% for AGIs $25k-50k, 1.1% for AGIs $50k-75k, 22.7% for AGIs over 100k)
IRA payment deduction: $2,857 (reported on 1.8% of returns)
63960:
$2,857
Missouri:
$2,972
Total itemized deductions: $14,191 (24% of AGI, reported on 13.7% of returns)
Here:
$14,191
State:
$18,261
Here:
24.2% of AGI
State:
20.5% of AGI
(% of AGI for various income ranges: 4.0% for AGIs $10k-25k, 5.8% for AGIs $25k-50k, 7.7% for AGIs $50k-75k, 11.3% for AGIs $75k-100k, 10.0% for AGIs over 100k)
Charity contributions deductions: $3,378 (5% of AGI, reported on 10.1% of returns)
Here:
$3,378
State:
$3,665
Here:
5.2% of AGI
State:
3.9% of AGI
(% of AGI for various income ranges: 3.0% for AGIs below $10k, 0.8% for AGIs $25k-50k, 1.1% for AGIs $50k-75k, 2.9% for AGIs $75k-100k, 2.8% for AGIs over 100k)
Total tax: $3,312 (reported on 67.8% of returns)
63960:
$3,312
State:
$6,999
(% of AGI for various income ranges: 4.5% for AGIs below $10k, 4.0% for AGIs $10k-25k, 6.1% for AGIs $25k-50k, 8.4% for AGIs $50k-75k, 11.4% for AGIs $75k-100k, 19.3% for AGIs over 100k)
Earned income credit: $1,703 (reported on 24.8% of returns)
Here:
$1,703
State:
$1,728
Percentage of individuals using paid preparers for their 2004 taxes: 69.8%
Here:
70%
State:
62%
(% for various income ranges: 65.2% for AGIs below $10k, 71.4% for AGIs $10k-25k, 72.0% for AGIs $25k-50k, 65.0% for AGIs $50k-75k, 75.5% for AGIs $75k-100k, 88.2% for AGIs over 100k)
Household received Food Stamps/SNAP in the past 12 months: 273 Household did not receive Food Stamps/SNAP in the past 12 months: 904
Women who had a birth in the past 12 months: 64 (30 now married, 36 unmarried) Women who did not have a birth in the past 12 months: 708 (315 now married, 392 unmarried)
Housing units in zip code 63960 with a mortgage: 517 (32 second mortgage, 17 both second mortgage and home equity loan) Median monthly owner costs for units with a mortgage: $842 Median monthly owner costs for units without a mortgage: $336
Residents with income below the poverty level in 2022:
This zip code:
16.6%
Whole state:
13.2%
Residents with income below 50% of the poverty level in 2022:
This zip code:
7.3%
Whole state:
6.8%
Median number of rooms in houses and condos:
Here:
6.0
State:
6.4
Median number of rooms in apartments:
Here:
5.1
State:
4.4
Notable locations in this zip code not listed on our city pages
Notable locations in zip code 63960: Red Mill Hunters Entrance (A), Job Corps Conservation Center (B), Puxico Volunteer Fire Department (C). Display/hide their locations on the map
Churches in zip code 63960 include: Pleasant Valley Church (A), Providence Church (B), Kinder Chapel (C), Snake Bluff Church (D), Egypt Church (E), West Union Church (F), Brown Church (G), Mount Olive Church (H), Corinth Church (I). Display/hide their locations on the map
Cemeteries: Fagen Cemetery (1), Rock Hill Cemetery (2), Clubb Cemetery (3), Gravel Hill Cemetery (4), Kimbrel Cemetery (5). Display/hide their locations on the map
Reservoirs and swamps: Red Mill Pond (A), Ellison Lake (B), Pool Eight (C), Pool Six (D), Rockhouse Cypress Lake (E). Display/hide their locations on the map
Streams, rivers, and creeks: Duck Creek (A), Club Creek (B), Cato Slough (C), Turkey Creek (D), Flat Mingo Creek (E). Display/hide their locations on the map
In group quarters: 46 (-1 institutionalized population)
Size of family households: 375 2-persons, 193 3-persons, 107 4-persons, 87 5-persons, 35 6-persons, 26 7-or-more-persons
Size of nonfamily households: 332 1-person, 20 2-persons
357 married couples with children.
245 single-parent households (167 men, 78 women).
99.5% of residents of 63960 zip code speak English at home.
0.3% of residents speak other Indo-European language at home (100% well).
Foreign born population: 0 (0.0%) (100.0% of them are naturalized citizens)
This zip code:
0.0%
Whole state:
4.1%
12%Philippines
48%American
15%English
12%German
5%Dutch
4%Irish
3%Nigerian
3%European
Year of entry for the foreign-born population
02010 or later
52000 to 2009
01990 to 1999
0Before 1990
Facilities with environmental interests located in this zip code:
PUXICO (HWY 51 SOUTH in PUXICO, MO)
STATE MASTER (Missouri monitoring and compilance) - PCS-MO0055158, NPDES NON-MAJOR National Pollutant Discharge Elimination System NON-MAJOR (Tracking pollutant discharge elimination systems) - permit Business SIC classification: SEWERAGE SYSTEMS Alternative names: PUXICO WWTF
ROBERT & PEARL ECK (8332 CO RD 420 RT 2 BX306 in PUXICO, MO)
STATE MASTER (Missouri monitoring and compilance) - PCS-MOG822108, NPDES NON-MAJOR National Pollutant Discharge Elimination System NON-MAJOR (Tracking pollutant discharge elimination systems) - permit Business SIC classification: MEAT PACKING PLANTS Alternative names: ECK MEAT PROCESSING CO
RALPH EDWARDS SPORTSWEAR INC (E RAILROAD & OWEN AVE in PUXICO, MO)
STATE MASTER (Missouri monitoring and compilance) - RCRAINFO-MOD000823237, NOT IN A UNIVERSE (Resource Conservation and Recovery Act (tracking hazardous waste))
PUXICO ELEM. (481 N BEDFORD ST in PUXICO, MO)
(National Center for Education Statistics) - STATE ID-4020103130 Organizations: PUXICO R-VIII (SCHOOL DISTRICT)
PUXICO HIGH (481 N BEDFORD ST in PUXICO, MO)
(National Center for Education Statistics) - STATE ID-1050103130 Organizations: PUXICO R-VIII (SCHOOL DISTRICT)
Housing units lacking complete plumbing facilities: 1.7% Housing units lacking complete kitchen facilities: 2.4%
51.2%Electricity
25.3%Bottled, tank, or LP gas
18.4%Utility gas
5.2%Wood
Population in 1990: 2,085. Population change in the 1990s: +1,071 (+51.4%).
Place of birth for U.S.-born residents:
This state: 2,559
Northeast: 9
Midwest: 282
South: 270
West: 142
53% of the 63960 zip code residents lived in the same house 5 years ago. Out of people who lived in different houses, 46% lived in this county. Out of people who lived in different counties, 50% lived in Missouri.
90% of the 63960 zip code residents lived in the same house 1 year ago. Out of people who lived in different houses, 46% moved from this county. Out of people who lived in different houses, 51% moved from different county within same state. Out of people who lived in different houses, 2% moved from different state.
Private vs. public school enrollment:
Students in private schools in grades 1 to 8 (elementary and middle school): 26
Here:
8.6%
Missouri:
15.4%
Students in private schools in grades 9 to 12 (high school):
Here:
0.0%
Missouri:
13.9%
Students in private undergraduate colleges: 4
Here:
7.5%
Missouri:
22.6%
Occupation by median earnings in the past 12 months ($)
64,510Health diagnosing and treating practitioners and other technical occupations
57,844Business and financial operations occupations
56,609Community and social service occupations
55,179Management occupations
43,837Production occupations
42,924Law enforcement workers including supervisors
Companies with federal contracts located in this zip code:
INDUSTRY ELECTRIC CONTRACTORS (26413 COUNTY RD 271 in PUXICO, MO; small business)
$19,100 with U.S. Army Corps of Engineers - civil program financing only for Maintenance, Repair or Alteration of Real Property -- Other Utilities. Signed on 2003-09-11. Completion date: 2003-10-24.
Top industries in this zip code by the number of employees in 2005:
Health Care and Social Assistance: Services for the Elderly and Persons with Disabilities (50-99: 1)
Health Care and Social Assistance: Nursing Care Facilities (20-49: 1)
Health Care and Social Assistance: Continuing Care Retirement Communities (10-19: 1)
People in group quarters in 2010:
213 people in workers' group living quarters and job corps centers
32 people in nursing facilities/skilled-nursing facilities
People in group quarters in 2000:
291 people in job corps and vocational training facilities
32 people in nursing homes
26 people in other noninstitutional group quarters
Fatal accident statistics in 2014:
Fatal accident count: 1
Vehicles involved in fatal accidents: 1
Fatal accidents caused by drunken drivers: 0
Fatalities: 1
Persons involved in fatal accidents: 1
Pedestrians involved in fatal accidents: 0
Fatal accident statistics in 2013:
Fatal accident count: 1
Vehicles involved in fatal accidents: 1
Fatal accidents caused by drunken drivers: 0
Fatalities: 1
Persons involved in fatal accidents: 1
Pedestrians involved in fatal accidents: 0
2002 - 2017 National Fire Incident Reporting System (NFIRS) incidents
According to the data from the years 2002 - 2017 the average number of fires per year is 12. The highest number of fires - 25 took place in 2005, and the least - 2 in 2003. The data has a rising trend.
When looking into fire subcategories, the most reports belonged to: Structure Fires (44.3%), and Outside Fires (39.7%).
Fire incident types reported to NFIRS in Zip Code 63960

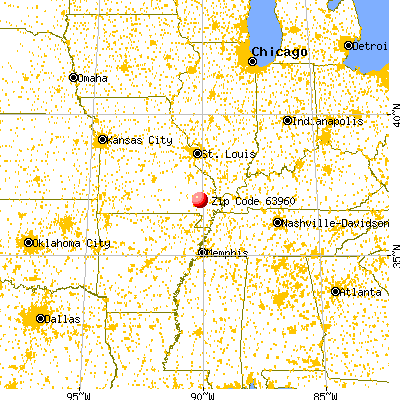


 Nearest zip codes: 63763, 63966, 63936, 63787, 63825, 63962.


 According to the data from the years 2002 - 2017 the average number of fires per year is 12. The highest number of fires - 25 took place in 2005, and the least - 2 in 2003. The data has a rising trend.
 When looking into fire subcategories, the most reports belonged to: Structure Fires (44.3%), and Outside Fires (39.7%).