Estimated zip code population in 2022: 924 Zip code population in 2010: 890 Zip code population in 2000: 913
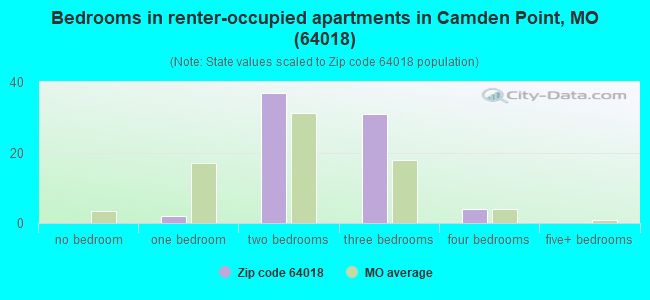
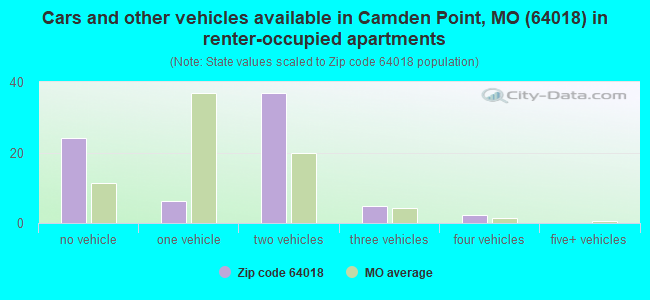
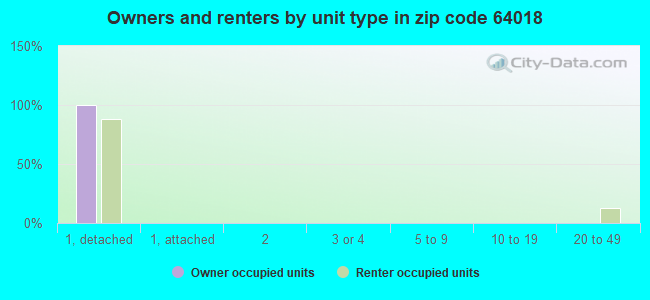
Houses and condos: 384 Renter-occupied apartments: 73
% of renters here:
23%
State:
32%
March 2022 cost of living index in zip code 64018: 77.8 (low, U.S. average is 100)
Land area: 23.4 sq. mi. Water area: 0.2 sq. mi.
Population density: 39 people per square mile
(very low).
OSM Map
General Map
Google Map
MSN Map
OSM Map
General Map
Google Map
MSN Map
OSM Map
General Map
Google Map
MSN Map
OSM Map
General Map
Google Map
MSN Map
Please wait while loading the map...
Real estate property taxes paid for housing units in 2022:
This zip code:
0.7% ($2,014)
Missouri:
0.8% ($1,810)
Median real estate property taxes paid for housing units with mortgages in 2022: $1,921 (0.7%) Median real estate property taxes paid for housing units with no mortgage in 2022: $2,214 (0.9%)
Business Search- 14 Million verified businesses
Males: 492
(53.2%)
Females: 432
(46.8%)
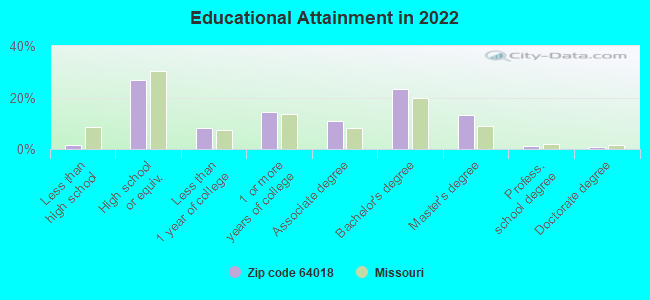
For population 25 years and over in 64018:
High school or higher: 98.4%
Bachelor's degree or higher: 38.5%
Graduate or professional degree: 15.3%
Unemployed: 3.3%
Mean travel time to work (commute): 29.3 minutes
For population 15 years and over in 64018:
Never married: 16.9%
Now married: 71.8%
Separated: 0.4%
Widowed: 5.6%
Divorced: 5.2%
Zip code 64018 compared to state average:
Median household income above state average.
Black race population percentage significantly below state average.
Hispanic race population percentage significantly below state average.
Median age below state average.
Foreign-born population percentage significantly below state average.
Length of stay since moving in significantly below state average.
Estimated median house/condo value in 2022: $279,883
64018:
$279,883
Missouri:
$221,200
According to our research of Missouri and other state lists, there was 1 registered sex offender living in 64018 zip code as of May 28, 2024. The ratio of all residents to sex offenders in zip code 64018 is 1,095 to 1. The ratio of registered sex offenders to all residents in this zip code is much lower than the state average.
Median resident age:
This zip code:
33.7 years
Missouri median age:
39.1 years
Average household size:
This zip code:
2.8 people
Missouri:
2.4 people
Averages for the 2020 tax year for zip code 64018, filed in 2021:
Average Adjusted Gross Income (AGI) in 2020: $75,383 (Individual Income Tax Returns)
Here:
$75,383
State:
$68,151
Salary/wage: $62,474 (reported on 83.3% of returns)
Here:
$62,474
State:
$56,131
(% of AGI for various income ranges: 1088.6% for AGIs below $25k, 4644.0% for AGIs $25k-50k, 6712.0% for AGIs $50k-75k, 10053.3% for AGIs $75k-100k, 20683.3% for AGIs $100k-200k)
Taxable interest for individuals: $694 (reported on 42.9% of returns)
This zip code:
$694
Missouri:
$1,586
(% of AGI for various income ranges: 17.1% for AGIs below $25k, 12.0% for AGIs $25k-50k, 92.0% for AGIs $50k-75k, 66.7% for AGIs $75k-100k, 68.3% for AGIs $100k-200k)
Ordinary dividends: $3,478 (reported on 21.4% of returns)
Here:
$3,478
State:
$10,947
(% of AGI for various income ranges: 30.0% for AGIs below $25k, 48.0% for AGIs $50k-75k, 446.7% for AGIs $100k-200k)
Net capital gain/loss in AGI: +$22,612 (reported on 19.0% of returns)
Here:
+$22,612
State:
+$18,453
(% of AGI for various income ranges: 32.0% for AGIs $50k-75k, 2988.3% for AGIs $100k-200k)
Profit/loss from business: +$5,925 (reported on 9.5% of returns)
Here:
+$5,925
State:
+$12,260
(% of AGI for various income ranges: 886.7% for AGIs $75k-100k)
Taxable individual retirement arrangement distribution: $18,840 (reported on 11.9% of returns)
64018:
$18,840
Missouri:
$19,719
(% of AGI for various income ranges: 357.1% for AGIs below $25k, 2306.7% for AGIs $75k-100k)
Earned income credit: $1,650 (reported on 9.5% of returns)
Here:
$1,650
State:
$2,315
(% of AGI for various income ranges: 47.1% for AGIs below $25k, 66.0% for AGIs $25k-50k)
Percentage of individuals using paid preparers for their 2020 taxes: 90.5%
Here:
90%
State:
93%
(% for various income ranges: 81.8% for AGIs below $25k, 87.5% for AGIs $25k-50k, 100.0% for AGIs $50k-75k, 100.0% for AGIs $75k-100k, 90.9% for AGIs $100k-200k)
Averages for the 2012 tax year for zip code 64018, filed in 2013:
Average Adjusted Gross Income (AGI) in 2012: $57,602 (Individual Income Tax Returns)
Here:
$57,602
State:
$55,896
Salary/wage: $51,637 (reported on 81.4% of returns)
Here:
$51,637
State:
$46,205
(% of AGI for various income ranges: 70.3% for AGIs below $25k, 71.1% for AGIs $25k-50k, 71.3% for AGIs $50k-75k, 85.4% for AGIs $75k-100k, 68.8% for AGIs $100k-200k)
Taxable interest for individuals: $575 (reported on 46.5% of returns)
This zip code:
$575
Missouri:
$1,559
(% of AGI for various income ranges: 1.9% for AGIs below $25k, 0.5% for AGIs $25k-50k, 0.2% for AGIs $50k-75k, 0.7% for AGIs $75k-100k, 0.2% for AGIs $100k-200k)
Ordinary dividends: $725 (reported on 18.6% of returns)
Here:
$725
State:
$7,410
(% of AGI for various income ranges: 1.2% for AGIs below $25k, 0.4% for AGIs $50k-75k, 0.2% for AGIs $100k-200k)
Net capital gain/loss in AGI: +$5,020 (reported on 11.6% of returns)
Here:
+$5,020
State:
+$11,579
Profit/loss from business: +$3,100 (reported on 11.6% of returns)
Here:
+$3,100
State:
+$11,688
Taxable individual retirement arrangement distribution: $9,250 (reported on 14.0% of returns)
64018:
$9,250
Missouri:
$14,773
Total itemized deductions: $16,769 (19% of AGI, reported on 37.2% of returns)
Here:
$16,769
State:
$22,730
Here:
18.6% of AGI
State:
19.2% of AGI
(% of AGI for various income ranges: 16.1% for AGIs $25k-50k, 9.5% for AGIs $50k-75k, 12.6% for AGIs $75k-100k, 10.4% for AGIs $100k-200k)
Charity contributions: $2,550 (reported on 27.9% of returns)
Here:
$2,550
State:
$4,745
(% of AGI for various income ranges: 3.1% for AGIs $25k-50k, 1.1% for AGIs $75k-100k, 1.3% for AGIs $100k-200k)
Taxes paid: $6,875 (reported on 37.2% of returns)
64018:
$6,875
State:
$8,399
(% of AGI for various income ranges: 3.4% for AGIs $25k-50k, 3.4% for AGIs $50k-75k, 4.7% for AGIs $75k-100k, 5.7% for AGIs $100k-200k)
Earned income credit: $1,760 (reported on 11.6% of returns)
Here:
$1,760
State:
$2,288
(% of AGI for various income ranges: 3.2% for AGIs below $25k, 1.1% for AGIs $25k-50k)
Percentage of individuals using paid preparers for their 2012 taxes: 58.1%
Here:
58%
State:
55%
(% for various income ranges: 50.0% for AGIs below $25k, 60.0% for AGIs $25k-50k, 66.7% for AGIs $50k-75k, 50.0% for AGIs $75k-100k, 71.4% for AGIs $100k-200k)
Averages for the 2004 tax year for zip code 64018, filed in 2005:
Average Adjusted Gross Income (AGI) in 2004: $47,782 (Individual Income Tax Returns)
Here:
$47,782
State:
$44,591
Salary/wage: $45,563 (reported on 87.6% of returns)
Here:
$45,563
State:
$38,941
(% of AGI for various income ranges: 86.6% for AGIs below $10k, 78.0% for AGIs $10k-25k, 85.7% for AGIs $25k-50k, 85.4% for AGIs $50k-75k, 97.3% for AGIs $75k-100k, 71.8% for AGIs over 100k)
Taxable interest for individuals: $1,038 (reported on 53.2% of returns)
This zip code:
$1,038
Missouri:
$1,801
(% of AGI for various income ranges: 9.8% for AGIs below $10k, 2.3% for AGIs $10k-25k, 1.1% for AGIs $25k-50k, 1.4% for AGIs $50k-75k, 0.8% for AGIs $75k-100k, 0.5% for AGIs over 100k)
Taxable dividends: $629 (reported on 20.0% of returns)
Here:
$629
State:
$3,677
(% of AGI for various income ranges: 0.9% for AGIs $10k-25k, 0.2% for AGIs $25k-50k, 0.2% for AGIs $50k-75k, 0.3% for AGIs $75k-100k, 0.3% for AGIs over 100k)
Net capital gain/loss: +$3,075 (reported on 15.1% of returns)
Here:
+$3,075
State:
+$8,915
(% of AGI for various income ranges: -1.5% for AGIs below $10k, 0.1% for AGIs $25k-50k, 0.7% for AGIs $50k-75k, 2.8% for AGIs over 100k)
Profit/loss from business: +$2,900 (reported on 13.5% of returns)
Here:
+$2,900
State:
+$9,793
(% of AGI for various income ranges: 2.1% for AGIs below $10k, 1.9% for AGIs $25k-50k, 1.1% for AGIs $50k-75k, 1.0% for AGIs $75k-100k)
Total itemized deductions: $15,388 (20% of AGI, reported on 40.1% of returns)
Here:
$15,388
State:
$18,261
Here:
19.6% of AGI
State:
20.5% of AGI
(% of AGI for various income ranges: 40.9% for AGIs below $10k, 9.8% for AGIs $25k-50k, 15.5% for AGIs $50k-75k, 15.6% for AGIs $75k-100k, 12.6% for AGIs over 100k)
Charity contributions deductions: $2,236 (3% of AGI, reported on 33.3% of returns)
Here:
$2,236
State:
$3,665
Here:
2.7% of AGI
State:
3.9% of AGI
(% of AGI for various income ranges: 1.0% for AGIs $25k-50k, 2.3% for AGIs $50k-75k, 1.7% for AGIs $75k-100k, 1.8% for AGIs over 100k)
Total tax: $5,893 (reported on 79.7% of returns)
64018:
$5,893
State:
$6,999
(% of AGI for various income ranges: 2.1% for AGIs below $10k, 3.9% for AGIs $10k-25k, 6.7% for AGIs $25k-50k, 7.7% for AGIs $50k-75k, 10.5% for AGIs $75k-100k, 14.7% for AGIs over 100k)
Earned income credit: $1,526 (reported on 8.6% of returns)
Here:
$1,526
State:
$1,728
Percentage of individuals using paid preparers for their 2004 taxes: 66.0%
Here:
66%
State:
62%
(% for various income ranges: 47.9% for AGIs below $10k, 72.2% for AGIs $10k-25k, 70.0% for AGIs $25k-50k, 71.2% for AGIs $50k-75k, 57.4% for AGIs $75k-100k, 73.9% for AGIs over 100k)
Household received Food Stamps/SNAP in the past 12 months: 8 Household did not receive Food Stamps/SNAP in the past 12 months: 316
Women who had a birth in the past 12 months: 5 (5 now married, 0 unmarried) Women who did not have a birth in the past 12 months: 182 (107 now married, 74 unmarried)
Housing units in zip code 64018 with a mortgage: 158 (18 second mortgage, 8 both second mortgage and home equity loan) Houses without a mortgage: 1
Median monthly owner costs for units with a mortgage: $1,623 Median monthly owner costs for units without a mortgage: $532
Residents with income below the poverty level in 2022:
This zip code:
4.9%
Whole state:
13.2%
Residents with income below 50% of the poverty level in 2022:
This zip code:
4.4%
Whole state:
6.8%
Median number of rooms in houses and condos:
Here:
7.1
State:
6.4
Median number of rooms in apartments:
Here:
5.3
State:
4.4
Notable locations in this zip code not listed on our city pages
Size of family households: 142 2-persons, 15 3-persons, 44 4-persons, 17 5-persons, 33 7-or-more-persons
Size of nonfamily households: 63 1-person, 4 2-persons
270 married couples with children.
21 single-parent households (12 men, 9 women).
96.7% of residents of 64018 zip code speak English at home.
0.5% of residents speak other Indo-European language at home (100% very well).
2.2% of residents speak Asian or Pacific Island language at home (100% very well).
Foreign born population: 6 (0.7%) (85.8% of them are naturalized citizens)
This zip code:
0.7%
Whole state:
4.1%
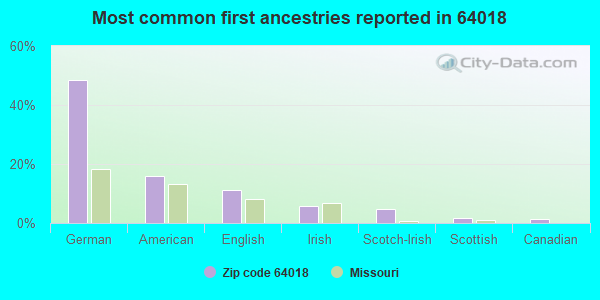
17%Austria
17%France
48%German
16%American
11%English
6%Irish
5%Scotch-Irish
2%Scottish
1%Canadian
Year of entry for the foreign-born population
12010 or later
02000 to 2009
21990 to 1999
6Before 1990
Facilities with environmental interests located in this zip code:
NORTH PLATTE ELEM. (300 SCOUT ST in CAMDEN POINT, MO)
(National Center for Education Statistics) - STATE ID-4020083001 Organizations: NORTH PLATTE CO. R-I (SCHOOL DISTRICT)
Housing units lacking complete plumbing facilities: 0.9%
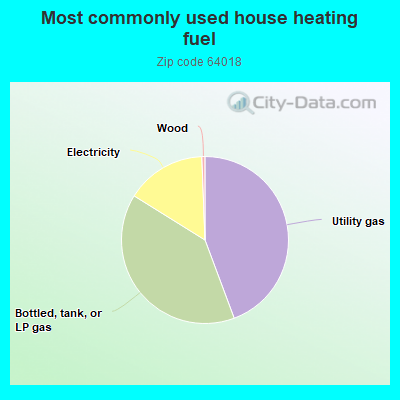
44.5%Utility gas
39.7%Bottled, tank, or LP gas
15.6%Electricity
0.6%Wood
Population in 1990: 678. Population change in the 1990s: +235 (+34.7%).
Place of birth for U.S.-born residents:
This state: 632
Northeast: 24
Midwest: 154
South: 81
West: 20
71% of the 64018 zip code residents lived in the same house 5 years ago. Out of people who lived in different houses, 56% lived in this county. Out of people who lived in different counties, 50% lived in Missouri.
92% of the 64018 zip code residents lived in the same house 1 year ago. Out of people who lived in different houses, 33% moved from this county. Out of people who lived in different houses, 58% moved from different county within same state. Out of people who lived in different houses, 8% moved from abroad.
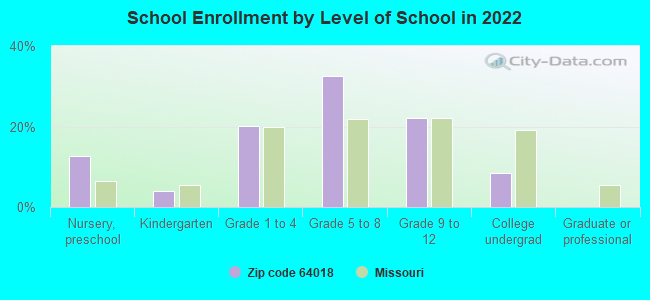
Private vs. public school enrollment:
Students in private schools in grades 1 to 8 (elementary and middle school): 3
Here:
2.5%
Missouri:
15.4%
Students in private schools in grades 9 to 12 (high school): 38
Here:
62.5%
Missouri:
13.9%
Students in private undergraduate colleges: 4
Here:
19.4%
Missouri:
22.6%
Occupation by median earnings in the past 12 months ($)
148,031Management occupations
101,852Installation, maintenance, and repair occupations
95,016Transportation occupations
93,488Construction and extraction occupations
89,374Fire fighting and prevention, and other protective service workers including supervisors
85,178Health diagnosing and treating practitioners and other technical occupations
Top industries in this zip code by the number of employees in 2005:
Other Services (except Public Administration): Religious Organizations (1-4 employees: 2 establishments)
Wholesale Trade: Wholesale Trade Agents and Brokers (1-4: 1)
Finance and Insurance: Commercial Banking (1-4: 1)
Construction: New Housing Operative Builders (1-4: 1)
Wholesale Trade: Other Grocery and Related Products Merchant Wholesalers (1-4: 1)
Construction: Site Preparation Contractors (1-4: 1)
Fatal accident statistics in 2011:
Fatal accident count: 1
Vehicles involved in fatal accidents: 1
Fatal accidents caused by drunken drivers: 0
Fatalities: 1
Persons involved in fatal accidents: 1
Pedestrians involved in fatal accidents: 0
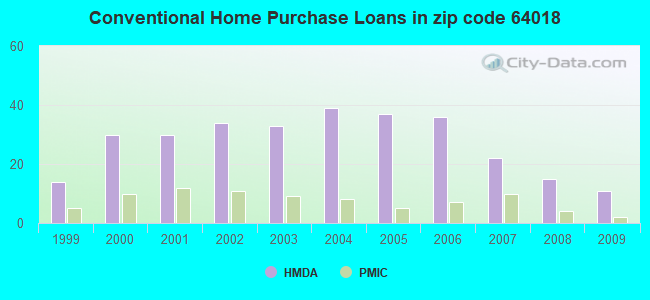
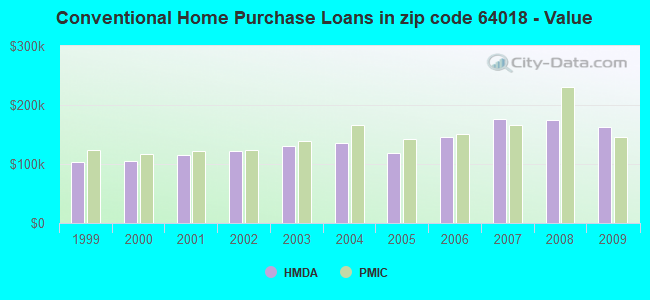
Home Mortgage Disclosure Act Aggregated Statistics For Year 2009 (Based on 2 partial tracts)
A) FHA, FSA/RHS & VA Home Purchase Loans
B) Conventional Home Purchase Loans
C) Refinancings
D) Home Improvement Loans
F) Non-occupant Loans on < 5 Family Dwellings (A B C & D)
G) Loans On Manufactured Home Dwelling (A B C & D)
Number
Average Value
Number
Average Value
Number
Average Value
Number
Average Value
Number
Average Value
Number
Average Value
LOANS ORIGINATED
12
$145,742
11
$162,545
81
$174,030
5
$58,628
4
$90,732
0
$0
APPLICATIONS APPROVED, NOT ACCEPTED
0
$0
0
$0
4
$204,578
0
$0
0
$0
0
$0
APPLICATIONS DENIED
2
$75,535
2
$141,915
27
$183,340
3
$37,637
1
$71,660
2
$38,775
APPLICATIONS WITHDRAWN
2
$115,550
2
$132,455
16
$199,381
1
$96,780
0
$0
0
$0
FILES CLOSED FOR INCOMPLETENESS
0
$0
1
$111,360
3
$221,173
0
$0
0
$0
0
$0
Aggregated Statistics For Year 2008 (Based on 2 partial tracts)
A) FHA, FSA/RHS & VA Home Purchase Loans
B) Conventional Home Purchase Loans
C) Refinancings
D) Home Improvement Loans
F) Non-occupant Loans on < 5 Family Dwellings (A B C & D)
G) Loans On Manufactured Home Dwelling (A B C & D)
Number
Average Value
Number
Average Value
Number
Average Value
Number
Average Value
Number
Average Value
Number
Average Value
LOANS ORIGINATED
9
$121,874
15
$175,035
45
$156,513
10
$31,764
7
$108,039
2
$68,710
APPLICATIONS APPROVED, NOT ACCEPTED
0
$0
2
$242,885
4
$170,998
1
$67,000
1
$142,380
0
$0
APPLICATIONS DENIED
1
$196,050
2
$100,040
25
$171,863
5
$36,790
1
$42,190
1
$39,400
APPLICATIONS WITHDRAWN
2
$102,055
3
$271,530
11
$178,591
1
$147,030
1
$256,230
0
$0
FILES CLOSED FOR INCOMPLETENESS
0
$0
0
$0
2
$104,535
0
$0
0
$0
0
$0
Aggregated Statistics For Year 2007 (Based on 2 partial tracts)
A) FHA, FSA/RHS & VA Home Purchase Loans
B) Conventional Home Purchase Loans
C) Refinancings
D) Home Improvement Loans
F) Non-occupant Loans on < 5 Family Dwellings (A B C & D)
G) Loans On Manufactured Home Dwelling (A B C & D)
Number
Average Value
Number
Average Value
Number
Average Value
Number
Average Value
Number
Average Value
Number
Average Value
LOANS ORIGINATED
4
$127,802
22
$176,320
55
$163,182
11
$38,718
10
$127,089
1
$62,350
APPLICATIONS APPROVED, NOT ACCEPTED
0
$0
3
$149,930
10
$148,338
2
$19,385
1
$144,860
0
$0
APPLICATIONS DENIED
1
$108,260
6
$134,523
36
$171,816
3
$36,913
3
$111,570
0
$0
APPLICATIONS WITHDRAWN
0
$0
2
$175,575
12
$165,104
1
$84,370
0
$0
0
$0
FILES CLOSED FOR INCOMPLETENESS
0
$0
1
$86,860
6
$177,693
0
$0
0
$0
0
$0
Aggregated Statistics For Year 2006 (Based on 2 partial tracts)
A) FHA, FSA/RHS & VA Home Purchase Loans
B) Conventional Home Purchase Loans
C) Refinancings
D) Home Improvement Loans
F) Non-occupant Loans on < 5 Family Dwellings (A B C & D)
G) Loans On Manufactured Home Dwelling (A B C & D)
Number
Average Value
Number
Average Value
Number
Average Value
Number
Average Value
Number
Average Value
Number
Average Value
LOANS ORIGINATED
2
$133,230
36
$145,458
70
$135,673
13
$51,064
13
$132,598
1
$79,720
APPLICATIONS APPROVED, NOT ACCEPTED
0
$0
3
$247,850
12
$149,723
2
$98,800
1
$90,270
0
$0
APPLICATIONS DENIED
0
$0
10
$205,818
47
$164,142
7
$102,720
9
$131,870
0
$0
APPLICATIONS WITHDRAWN
0
$0
8
$176,039
26
$150,805
2
$78,015
2
$100,040
0
$0
FILES CLOSED FOR INCOMPLETENESS
0
$0
2
$178,675
8
$152,075
0
$0
1
$49,320
0
$0
Aggregated Statistics For Year 2005 (Based on 2 partial tracts)
A) FHA, FSA/RHS & VA Home Purchase Loans
B) Conventional Home Purchase Loans
C) Refinancings
D) Home Improvement Loans
F) Non-occupant Loans on < 5 Family Dwellings (A B C & D)
G) Loans On Manufactured Home Dwelling (A B C & D)
Number
Average Value
Number
Average Value
Number
Average Value
Number
Average Value
Number
Average Value
Number
Average Value
LOANS ORIGINATED
4
$132,068
37
$118,522
73
$139,242
9
$55,904
7
$60,090
3
$50,977
APPLICATIONS APPROVED, NOT ACCEPTED
1
$93,060
6
$126,458
8
$166,384
2
$115,240
0
$0
0
$0
APPLICATIONS DENIED
0
$0
10
$216,023
35
$139,103
5
$33,564
3
$138,557
2
$35,985
APPLICATIONS WITHDRAWN
0
$0
7
$148,630
29
$136,691
3
$137,730
2
$162,545
2
$63,900
FILES CLOSED FOR INCOMPLETENESS
0
$0
0
$0
4
$186,818
0
$0
0
$0
0
$0
Aggregated Statistics For Year 2004 (Based on 2 partial tracts)
A) FHA, FSA/RHS & VA Home Purchase Loans
B) Conventional Home Purchase Loans
C) Refinancings
D) Home Improvement Loans
F) Non-occupant Loans on < 5 Family Dwellings (A B C & D)
G) Loans On Manufactured Home Dwelling (A B C & D)
Number
Average Value
Number
Average Value
Number
Average Value
Number
Average Value
Number
Average Value
Number
Average Value
LOANS ORIGINATED
5
$134,440
39
$136,353
85
$131,444
7
$59,691
3
$147,450
1
$73,830
APPLICATIONS APPROVED, NOT ACCEPTED
0
$0
6
$101,797
14
$149,472
1
$25,440
0
$0
1
$48,700
APPLICATIONS DENIED
0
$0
10
$127,244
45
$124,535
5
$20,038
3
$78,273
2
$44,050
APPLICATIONS WITHDRAWN
0
$0
4
$126,252
34
$131,981
2
$71,035
2
$49,165
0
$0
FILES CLOSED FOR INCOMPLETENESS
0
$0
1
$177,430
6
$137,987
0
$0
1
$41,880
0
$0
Aggregated Statistics For Year 2003 (Based on 2 partial tracts)
A) FHA, FSA/RHS & VA Home Purchase Loans
B) Conventional Home Purchase Loans
C) Refinancings
D) Home Improvement Loans
F) Non-occupant Loans on < 5 Family Dwellings (A B C & D)
Number
Average Value
Number
Average Value
Number
Average Value
Number
Average Value
Number
Average Value
LOANS ORIGINATED
6
$128,423
33
$131,233
155
$129,517
7
$19,410
6
$86,338
APPLICATIONS APPROVED, NOT ACCEPTED
0
$0
3
$101,540
19
$137,174
1
$12,410
2
$114,775
APPLICATIONS DENIED
1
$48,700
6
$123,822
44
$121,528
3
$29,367
2
$106,245
APPLICATIONS WITHDRAWN
0
$0
5
$132,828
29
$136,606
1
$8,690
0
$0
FILES CLOSED FOR INCOMPLETENESS
0
$0
1
$85,300
4
$144,088
0
$0
0
$0
Aggregated Statistics For Year 2002 (Based on 2 partial tracts)
A) FHA, FSA/RHS & VA Home Purchase Loans
B) Conventional Home Purchase Loans
C) Refinancings
D) Home Improvement Loans
F) Non-occupant Loans on < 5 Family Dwellings (A B C & D)
Number
Average Value
Number
Average Value
Number
Average Value
Number
Average Value
Number
Average Value
LOANS ORIGINATED
3
$119,737
34
$121,927
130
$128,471
5
$21,218
5
$71,718
APPLICATIONS APPROVED, NOT ACCEPTED
0
$0
4
$108,958
13
$119,522
0
$0
0
$0
APPLICATIONS DENIED
0
$0
7
$48,436
27
$122,966
4
$18,302
1
$118,190
APPLICATIONS WITHDRAWN
1
$64,210
5
$107,018
24
$120,500
1
$40,640
1
$58,940
FILES CLOSED FOR INCOMPLETENESS
0
$0
1
$55,840
8
$133,735
0
$0
0
$0
Aggregated Statistics For Year 2001 (Based on 2 partial tracts)
A) FHA, FSA/RHS & VA Home Purchase Loans
B) Conventional Home Purchase Loans
C) Refinancings
D) Home Improvement Loans
F) Non-occupant Loans on < 5 Family Dwellings (A B C & D)
Number
Average Value
Number
Average Value
Number
Average Value
Number
Average Value
Number
Average Value
LOANS ORIGINATED
5
$129,664
30
$114,774
95
$121,540
8
$19,930
4
$82,822
APPLICATIONS APPROVED, NOT ACCEPTED
0
$0
2
$98,645
11
$118,243
1
$15,820
1
$112,910
APPLICATIONS DENIED
0
$0
7
$91,686
28
$99,109
3
$10,547
0
$0
APPLICATIONS WITHDRAWN
0
$0
2
$118,030
19
$100,603
1
$22,330
0
$0
FILES CLOSED FOR INCOMPLETENESS
0
$0
2
$65,295
5
$112,540
0
$0
0
$0
Aggregated Statistics For Year 2000 (Based on 2 partial tracts)
A) FHA, FSA/RHS & VA Home Purchase Loans
B) Conventional Home Purchase Loans
C) Refinancings
D) Home Improvement Loans
F) Non-occupant Loans on < 5 Family Dwellings (A B C & D)
Number
Average Value
Number
Average Value
Number
Average Value
Number
Average Value
Number
Average Value
LOANS ORIGINATED
6
$114,360
30
$105,768
33
$97,882
8
$26,484
4
$59,868
APPLICATIONS APPROVED, NOT ACCEPTED
1
$71,970
2
$78,945
5
$65,204
3
$19,750
0
$0
APPLICATIONS DENIED
1
$45,600
8
$53,121
14
$81,184
5
$12,098
1
$62,040
APPLICATIONS WITHDRAWN
0
$0
2
$50,720
7
$99,751
2
$48,700
0
$0
FILES CLOSED FOR INCOMPLETENESS
0
$0
0
$0
4
$93,758
0
$0
0
$0
Aggregated Statistics For Year 1999 (Based on 1 partial tract)
A) FHA, FSA/RHS & VA Home Purchase Loans
B) Conventional Home Purchase Loans
C) Refinancings
D) Home Improvement Loans
F) Non-occupant Loans on < 5 Family Dwellings (A B C & D)


 Nearest zip codes: 64439, 64444, 64163, 64079, 64164, 64098.