Estimated zip code population in 2022: 4,478 Zip code population in 2010: 4,140 Zip code population in 2000: 4,006
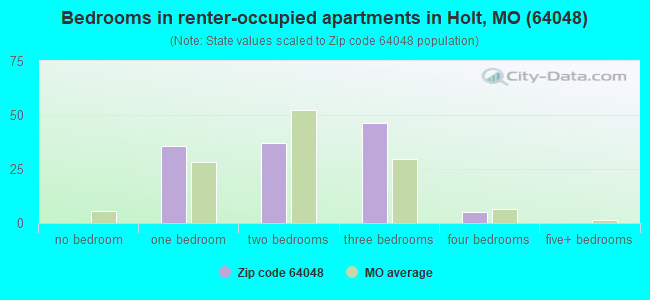
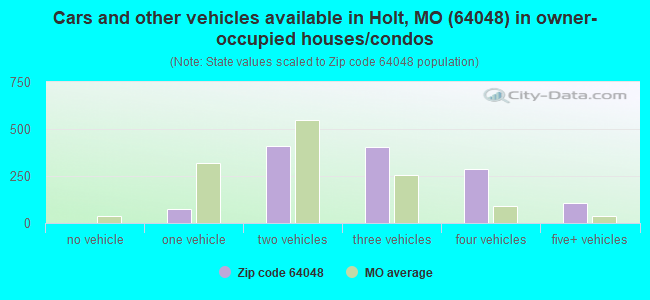
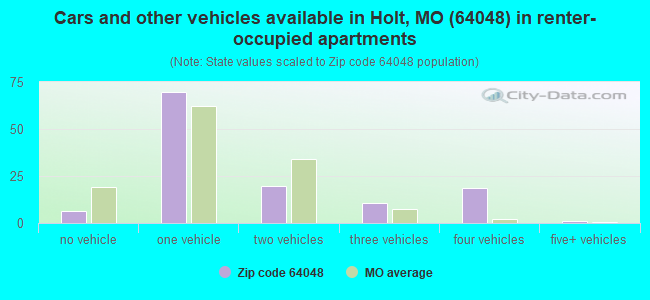
Houses and condos: 1,620 Renter-occupied apartments: 125
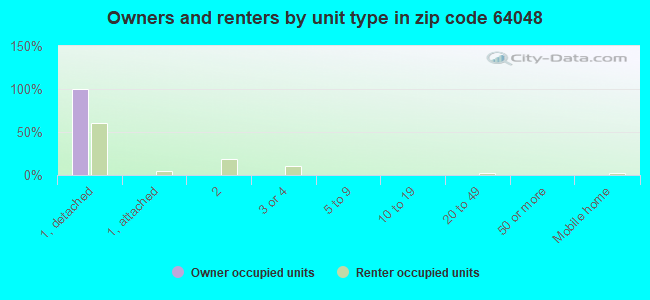
% of renters here:
9%
State:
32%
March 2022 cost of living index in zip code 64048: 77.7 (low, U.S. average is 100)
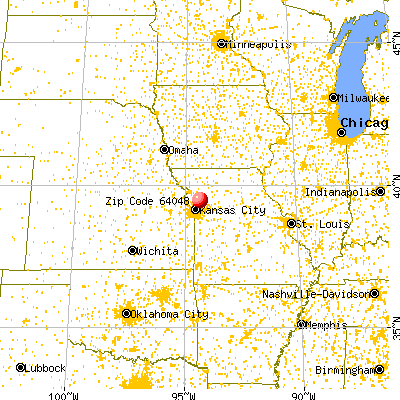
Land area: 46.8 sq. mi. Water area: 0.1 sq. mi.
Population density: 96 people per square mile
(very low).
OSM Map
General Map
Google Map
MSN Map
OSM Map
General Map
Google Map
MSN Map
OSM Map
General Map
Google Map
MSN Map
OSM Map
General Map
Google Map
MSN Map
Please wait while loading the map...
Real estate property taxes paid for housing units in 2022:
This zip code:
0.8% ($2,418)
Missouri:
0.8% ($1,810)
Median real estate property taxes paid for housing units with mortgages in 2022: $2,366 (0.8%) Median real estate property taxes paid for housing units with no mortgage in 2022: $2,511 (0.7%)
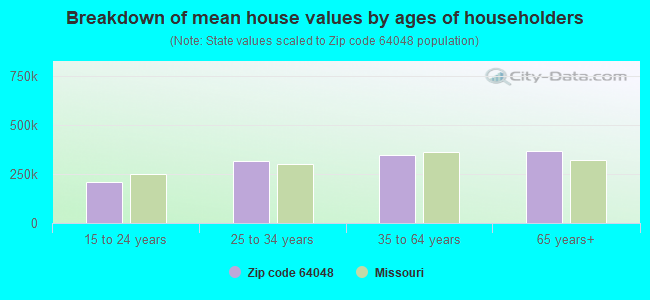
Estimated median house/condo value in 2022: $320,707
64048:
$320,707
Missouri:
$221,200
According to our research of Missouri and other state lists, there were 10 registered sex offenders living in 64048 zip code as of May 28, 2024. The ratio of all residents to sex offenders in zip code 64048 is 408 to 1. The ratio of registered sex offenders to all residents in this zip code is near the state average.
Median resident age:
This zip code:
37.6 years
Missouri median age:
39.1 years
Average household size:
This zip code:
3.2 people
Missouri:
2.4 people
Averages for the 2020 tax year for zip code 64048, filed in 2021:
Average Adjusted Gross Income (AGI) in 2020: $77,603 (Individual Income Tax Returns)
Here:
$77,603
State:
$68,151
Salary/wage: $68,440 (reported on 79.7% of returns)
Here:
$68,440
State:
$56,131
(% of AGI for various income ranges: 1107.2% for AGIs below $25k, 3173.1% for AGIs $25k-50k, 6302.6% for AGIs $50k-75k, 9292.8% for AGIs $75k-100k, 16794.7% for AGIs $100k-200k, 60436.7% for AGIs over 200k)
Taxable interest for individuals: $1,049 (reported on 44.4% of returns)
This zip code:
$1,049
Missouri:
$1,586
(% of AGI for various income ranges: 28.3% for AGIs below $25k, 49.0% for AGIs $25k-50k, 61.3% for AGIs $50k-75k, 35.6% for AGIs $75k-100k, 140.0% for AGIs $100k-200k, 320.0% for AGIs over 200k)
Ordinary dividends: $2,567 (reported on 20.8% of returns)
Here:
$2,567
State:
$10,947
(% of AGI for various income ranges: 41.1% for AGIs below $25k, 43.4% for AGIs $25k-50k, 92.2% for AGIs $50k-75k, 48.9% for AGIs $75k-100k, 118.0% for AGIs $100k-200k, 586.7% for AGIs over 200k)
Net capital gain/loss in AGI: +$7,891 (reported on 16.9% of returns)
Here:
+$7,891
State:
+$18,453
(% of AGI for various income ranges: 7.2% for AGIs below $25k, 21.7% for AGIs $25k-50k, 40.4% for AGIs $50k-75k, 115.0% for AGIs $75k-100k, 386.3% for AGIs $100k-200k, 4046.7% for AGIs over 200k)
Profit/loss from business: +$14,291 (reported on 15.9% of returns)
Here:
+$14,291
State:
+$12,260
(% of AGI for various income ranges: 103.6% for AGIs below $25k, 123.4% for AGIs $25k-50k, 268.7% for AGIs $50k-75k, 337.8% for AGIs $75k-100k, 456.3% for AGIs $100k-200k, 4633.3% for AGIs over 200k)
Taxable individual retirement arrangement distribution: $18,992 (reported on 12.6% of returns)
64048:
$18,992
Missouri:
$19,719
(% of AGI for various income ranges: 82.5% for AGIs below $25k, 231.4% for AGIs $25k-50k, 277.0% for AGIs $50k-75k, 396.7% for AGIs $75k-100k, 873.0% for AGIs $100k-200k)
Total itemized deductions: $27,306 (reported on 7.7% of returns)
Here:
$27,306
State:
$36,651
(% of AGI for various income ranges: 754.3% for AGIs $50k-75k, 569.3% for AGIs $100k-200k, 3086.7% for AGIs over 200k)
Charity contributions: $6,807 (reported on 6.8% of returns)
Here:
$6,807
State:
$15,671
(% of AGI for various income ranges: 128.3% for AGIs $50k-75k, 150.7% for AGIs $100k-200k, 686.7% for AGIs over 200k)
Taxes paid: $7,588 (reported on 7.7% of returns)
64048:
$7,588
State:
$7,608
(% of AGI for various income ranges: 157.4% for AGIs $50k-75k, 185.0% for AGIs $100k-200k, 990.0% for AGIs over 200k)
Earned income credit: $2,000 (reported on 7.7% of returns)
Here:
$2,000
State:
$2,315
(% of AGI for various income ranges: 46.1% for AGIs below $25k, 53.1% for AGIs $25k-50k)
Percentage of individuals using paid preparers for their 2020 taxes: 94.7%
Here:
95%
State:
93%
(% for various income ranges: 94.3% for AGIs below $25k, 94.7% for AGIs $25k-50k, 93.9% for AGIs $50k-75k, 92.6% for AGIs $75k-100k, 95.7% for AGIs $100k-200k, 100.0% for AGIs over 200k)
Averages for the 2012 tax year for zip code 64048, filed in 2013:
Average Adjusted Gross Income (AGI) in 2012: $62,724 (Individual Income Tax Returns)
Here:
$62,724
State:
$55,896
Salary/wage: $55,735 (reported on 85.8% of returns)
Here:
$55,735
State:
$46,205
(% of AGI for various income ranges: 66.7% for AGIs below $25k, 70.1% for AGIs $25k-50k, 73.5% for AGIs $50k-75k, 80.4% for AGIs $75k-100k, 83.7% for AGIs $100k-200k, 65.4% for AGIs over 200k)
Taxable interest for individuals: $772 (reported on 43.7% of returns)
This zip code:
$772
Missouri:
$1,559
(% of AGI for various income ranges: 1.8% for AGIs below $25k, 1.0% for AGIs $25k-50k, 0.5% for AGIs $50k-75k, 0.4% for AGIs $75k-100k, 0.4% for AGIs $100k-200k, 0.3% for AGIs over 200k)
Ordinary dividends: $1,530 (reported on 18.8% of returns)
Here:
$1,530
State:
$7,410
(% of AGI for various income ranges: 1.0% for AGIs below $25k, 0.8% for AGIs $25k-50k, 0.7% for AGIs $50k-75k, 0.1% for AGIs $75k-100k, 0.3% for AGIs $100k-200k, 0.6% for AGIs over 200k)
Net capital gain/loss in AGI: +$5,993 (reported on 14.2% of returns)
Here:
+$5,993
State:
+$11,579
(% of AGI for various income ranges: 0.3% for AGIs $25k-50k, 2.6% for AGIs $100k-200k, 3.4% for AGIs over 200k)
Profit/loss from business: +$9,896 (reported on 14.2% of returns)
Here:
+$9,896
State:
+$11,688
(% of AGI for various income ranges: 4.6% for AGIs below $25k, 5.8% for AGIs $25k-50k, 1.4% for AGIs $50k-75k, 1.6% for AGIs $75k-100k, 2.3% for AGIs $100k-200k)
Taxable individual retirement arrangement distribution: $15,452 (reported on 12.7% of returns)
64048:
$15,452
Missouri:
$14,773
(% of AGI for various income ranges: 4.9% for AGIs below $25k, 3.2% for AGIs $25k-50k, 4.0% for AGIs $50k-75k, 3.3% for AGIs $75k-100k, 3.5% for AGIs $100k-200k)
Total itemized deductions: $19,255 (19% of AGI, reported on 40.6% of returns)
Here:
$19,255
State:
$22,730
Here:
18.9% of AGI
State:
19.2% of AGI
(% of AGI for various income ranges: 10.6% for AGIs below $25k, 9.5% for AGIs $25k-50k, 11.8% for AGIs $50k-75k, 13.5% for AGIs $75k-100k, 14.3% for AGIs $100k-200k, 10.7% for AGIs over 200k)
Charity contributions: $3,351 (reported on 31.0% of returns)
Here:
$3,351
State:
$4,745
(% of AGI for various income ranges: 0.9% for AGIs below $25k, 1.0% for AGIs $25k-50k, 1.6% for AGIs $50k-75k, 1.6% for AGIs $75k-100k, 1.9% for AGIs $100k-200k, 2.2% for AGIs over 200k)
Taxes paid: $7,668 (reported on 40.1% of returns)
64048:
$7,668
State:
$8,399
(% of AGI for various income ranges: 2.0% for AGIs below $25k, 2.4% for AGIs $25k-50k, 4.0% for AGIs $50k-75k, 5.1% for AGIs $75k-100k, 6.2% for AGIs $100k-200k, 6.1% for AGIs over 200k)
Earned income credit: $1,932 (reported on 9.6% of returns)
Here:
$1,932
State:
$2,288
(% of AGI for various income ranges: 3.5% for AGIs below $25k, 0.7% for AGIs $25k-50k)
Percentage of individuals using paid preparers for their 2012 taxes: 59.4%
Here:
59%
State:
55%
(% for various income ranges: 52.4% for AGIs below $25k, 60.5% for AGIs $25k-50k, 62.5% for AGIs $50k-75k, 65.5% for AGIs $75k-100k, 61.3% for AGIs $100k-200k, 75.0% for AGIs over 200k)
Averages for the 2004 tax year for zip code 64048, filed in 2005:
Average Adjusted Gross Income (AGI) in 2004: $52,537 (Individual Income Tax Returns)
Here:
$52,537
State:
$44,591
Salary/wage: $48,592 (reported on 87.5% of returns)
Here:
$48,592
State:
$38,941
(% of AGI for various income ranges: 111.2% for AGIs below $10k, 69.3% for AGIs $10k-25k, 76.2% for AGIs $25k-50k, 83.6% for AGIs $50k-75k, 88.4% for AGIs $75k-100k, 76.1% for AGIs over 100k)
Taxable interest for individuals: $864 (reported on 54.8% of returns)
This zip code:
$864
Missouri:
$1,801
(% of AGI for various income ranges: 5.7% for AGIs below $10k, 3.3% for AGIs $10k-25k, 1.6% for AGIs $25k-50k, 0.5% for AGIs $50k-75k, 0.8% for AGIs $75k-100k, 0.4% for AGIs over 100k)
Taxable dividends: $1,364 (reported on 23.4% of returns)
Here:
$1,364
State:
$3,677
(% of AGI for various income ranges: 2.0% for AGIs below $10k, 1.1% for AGIs $10k-25k, 0.6% for AGIs $25k-50k, 0.3% for AGIs $50k-75k, 0.2% for AGIs $75k-100k, 1.1% for AGIs over 100k)
Net capital gain/loss: +$3,201 (reported on 16.2% of returns)
Here:
+$3,201
State:
+$8,915
(% of AGI for various income ranges: 2.3% for AGIs below $10k, 1.3% for AGIs $10k-25k, -0.1% for AGIs $25k-50k, 0.6% for AGIs $50k-75k, 0.4% for AGIs $75k-100k, 2.2% for AGIs over 100k)
Profit/loss from business: +$6,457 (reported on 16.6% of returns)
Here:
+$6,457
State:
+$9,793
(% of AGI for various income ranges: 9.5% for AGIs below $10k, 3.3% for AGIs $10k-25k, 4.1% for AGIs $25k-50k, 1.9% for AGIs $50k-75k, 1.4% for AGIs $75k-100k, 1.2% for AGIs over 100k)
IRA payment deduction: $2,917 (reported on 3.2% of returns)
64048:
$2,917
Missouri:
$2,972
(% of AGI for various income ranges: 0.3% for AGIs $25k-50k, 0.2% for AGIs $50k-75k, 0.1% for AGIs $75k-100k, 0.1% for AGIs over 100k)
Total itemized deductions: $16,482 (21% of AGI, reported on 46.8% of returns)
Here:
$16,482
State:
$18,261
Here:
21.2% of AGI
State:
20.5% of AGI
(% of AGI for various income ranges: 24.2% for AGIs below $10k, 14.0% for AGIs $10k-25k, 13.9% for AGIs $25k-50k, 14.9% for AGIs $50k-75k, 16.9% for AGIs $75k-100k, 12.9% for AGIs over 100k)
Charity contributions deductions: $2,553 (3% of AGI, reported on 38.9% of returns)
Here:
$2,553
State:
$3,665
Here:
3.2% of AGI
State:
3.9% of AGI
(% of AGI for various income ranges: 1.5% for AGIs $10k-25k, 1.3% for AGIs $25k-50k, 1.8% for AGIs $50k-75k, 2.3% for AGIs $75k-100k, 2.0% for AGIs over 100k)
Total tax: $6,703 (reported on 83.2% of returns)
64048:
$6,703
State:
$6,999
(% of AGI for various income ranges: 3.3% for AGIs below $10k, 4.7% for AGIs $10k-25k, 7.2% for AGIs $25k-50k, 8.6% for AGIs $50k-75k, 9.8% for AGIs $75k-100k, 15.9% for AGIs over 100k)
Earned income credit: $1,381 (reported on 7.1% of returns)
Here:
$1,381
State:
$1,728
Percentage of individuals using paid preparers for their 2004 taxes: 64.9%
Here:
65%
State:
62%
(% for various income ranges: 51.3% for AGIs below $10k, 67.3% for AGIs $10k-25k, 71.8% for AGIs $25k-50k, 64.6% for AGIs $50k-75k, 67.0% for AGIs $75k-100k, 66.7% for AGIs over 100k)
Household received Food Stamps/SNAP in the past 12 months: 46 Household did not receive Food Stamps/SNAP in the past 12 months: 1,366
Women who had a birth in the past 12 months: 56 (53 now married, 0 unmarried) Women who did not have a birth in the past 12 months: 941 (489 now married, 449 unmarried)
Housing units in zip code 64048 with a mortgage: 805 (53 second mortgage, 37 both second mortgage and home equity loan) Houses without a mortgage: 7
Median monthly owner costs for units with a mortgage: $1,754 Median monthly owner costs for units without a mortgage: $619
Residents with income below the poverty level in 2022:
This zip code:
1.5%
Whole state:
13.2%
Residents with income below 50% of the poverty level in 2022:
This zip code:
1.0%
Whole state:
6.8%
Median number of rooms in houses and condos:
Here:
6.7
State:
6.4
Median number of rooms in apartments:
Here:
4.8
State:
4.4
Notable locations in this zip code not listed on our city pages
Cemeteries: Eberts Cemetery (1), Mount Zion Cemetery (2), Muddy Fork Cemetery (3), Oakland Cemetery (4), Antioch Cemetery (5). Display/hide their locations on the map
Size of family households: 424 2-persons, 127 3-persons, 341 4-persons, 77 5-persons, 87 6-persons, 51 7-or-more-persons
Size of nonfamily households: 250 1-person, 34 2-persons, 2 3-persons
830 married couples with children.
27 single-parent households (5 men, 22 women).
97.4% of residents of 64048 zip code speak English at home.
0.4% of residents speak Spanish at home (100% very well).
1.5% of residents speak other Indo-European language at home (100% very well).
0.3% of residents speak other language at home (100% very well).
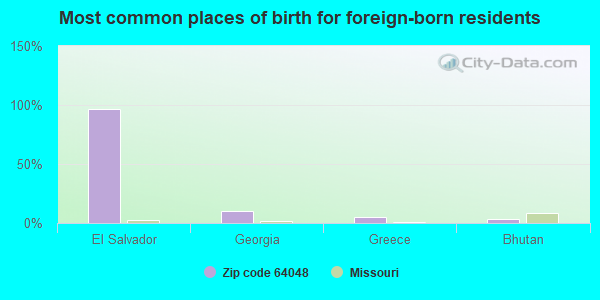
Foreign born population: 80 (1.8%) (95.2% of them are naturalized citizens)
This zip code:
1.8%
Whole state:
4.1%
96%El Salvador
10%Georgia
5%Greece
4%Bhutan
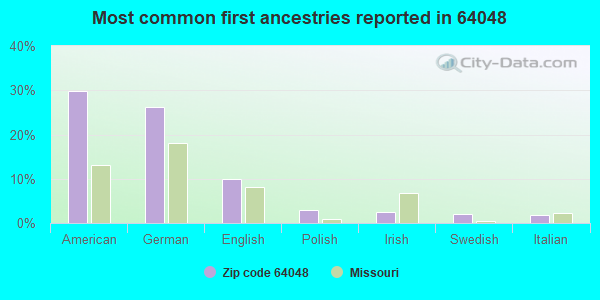
30%American
26%German
10%English
3%Polish
2%Irish
2%Swedish
2%Italian
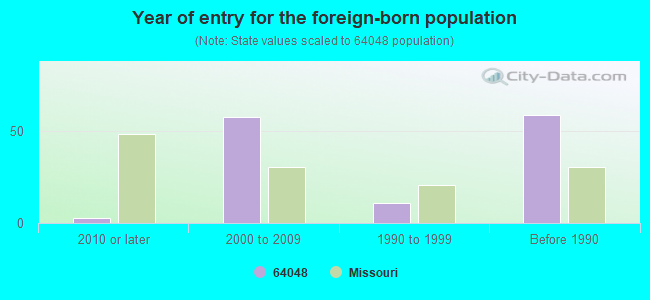
Year of entry for the foreign-born population
32010 or later
582000 to 2009
111990 to 1999
59Before 1990
Facilities with environmental interests located in this zip code:
HOLT WASTEWATER LAGOON (PO BOX 170 in HOLT, MO)
STATE MASTER (Missouri monitoring and compilance) - PCS-MO0109002, NPDES NON-MAJOR National Pollutant Discharge Elimination System NON-MAJOR (Tracking pollutant discharge elimination systems) - permit Business SIC classification: SEWERAGE SYSTEMS Organizations: HOLT, CITY OF (CONTACT/OWNER)
RIDGEWAY GROUP (200 MAIN ST in HOLT, MO)
AIR MINOR (AIRS/AFS) STATE MASTER (Missouri monitoring and compilance) - AIRS/AFS-MO0938712, AIR MINOR Business SIC classification: BUSINESS SERVICES
HOLT ELEM. (455 SCHOOL WAY in HOLT, MO)
(National Center for Education Statistics) - STATE ID-4020024086 Organizations: KEARNEY R-I (SCHOOL DISTRICT)
Housing units lacking complete plumbing facilities: 2.5% Housing units lacking complete kitchen facilities: 1.7%
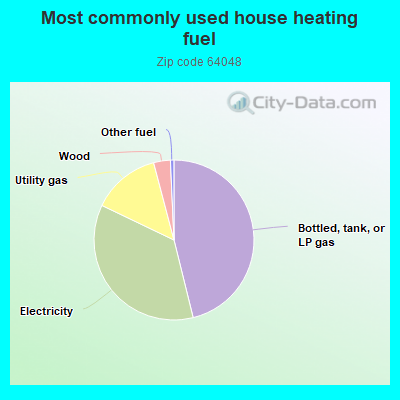
46.2%Bottled, tank, or LP gas
36.0%Electricity
13.8%Utility gas
3.4%Wood
0.7%Other fuel
Population in 1990: 1,712. Population change in the 1990s: +2,294 (+134.0%).
Place of birth for U.S.-born residents:
This state: 3,068
Northeast: 115
Midwest: 725
South: 258
West: 170
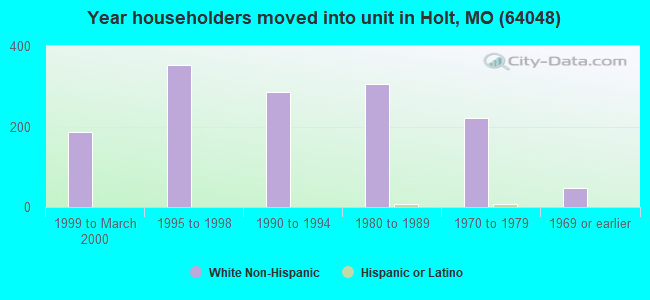
63% of the 64048 zip code residents lived in the same house 5 years ago. Out of people who lived in different houses, 28% lived in this county. Out of people who lived in different counties, 50% lived in Missouri.
94% of the 64048 zip code residents lived in the same house 1 year ago. Out of people who lived in different houses, 34% moved from this county. Out of people who lived in different houses, 21% moved from different county within same state. Out of people who lived in different houses, 52% moved from different state.
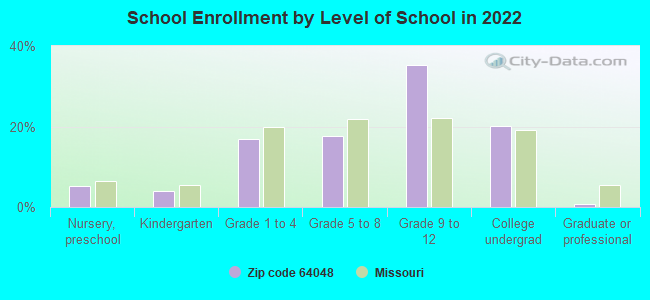
Private vs. public school enrollment:
Students in private schools in grades 1 to 8 (elementary and middle school):
Here:
0.2%
Missouri:
15.4%
Students in private schools in grades 9 to 12 (high school): 69
Here:
15.0%
Missouri:
13.9%
Students in private undergraduate colleges: 20
Here:
7.8%
Missouri:
22.6%
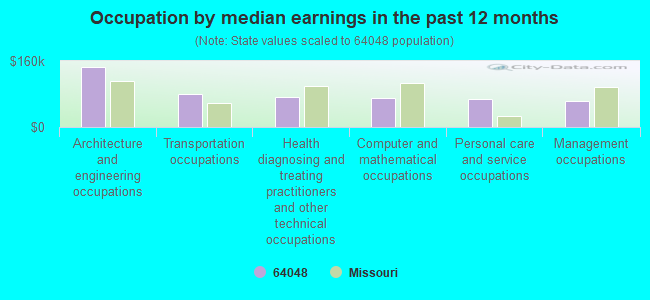
Occupation by median earnings in the past 12 months ($)
146,467Architecture and engineering occupations
79,651Transportation occupations
72,930Health diagnosing and treating practitioners and other technical occupations
69,763Computer and mathematical occupations
67,173Personal care and service occupations
63,033Management occupations
Companies with federal contracts located in this zip code:
KENAGA PROPERTIES LLC (21222 NE 172ND ST in HOLT, MO) : $92,740 in 6 contractsfrom 2005 to 2006
Contracts for Landscaping/Groundskeeping Services by Army, U.S. Army Corps of Engineers - civil program financing only Signed by year:2000: $0; 2001: $0; 2002: $0; 2003: $0; 2004: $0; 2005: $81,610; 2006: $11,130.
Biggest contracts:
$27,935 with Army for Landscaping/Groundskeeping Services. Taking place in NE. Signed on 2005-07-19. Completion date: 2005-09-30.
$27,935 with U.S. Army Corps of Engineers - civil program financing only for Landscaping/Groundskeeping Services. Taking place in NE. Signed on 2005-07-19. Completion date: 2005-09-30.
$12,870 with U.S. Army Corps of Engineers - civil program financing only for Landscaping/Groundskeeping Services. Taking place in KS. Signed on 2005-07-08. Completion date: 2005-09-30.
$12,870 with Army for Landscaping/Groundskeeping Services. Taking place in KS. Signed on 2005-07-08. Completion date: 2005-09-30.
CLINTON COUNTY TRAILER SALES (7762 SE HAYNESVILLE RD in HOLT, MO; small business)
$4,524 with Army for Trailers. Signed on 2002-09-28. Completion date: 2002-11-02.
Top industries in this zip code by the number of employees in 2005:
Administrative and Support and Waste Management and Remediation Services: Temporary Help Services (20-49 employees: 1 establishment, 10-19 employees: 1 establishment)
Other Services (except Public Administration): Religious Organizations (10-19: 1, 5-9: 1, 1-4: 2)
Construction: Plumbing, Heating, and Air-Conditioning Contractors (10-19: 1, 5-9: 1)
Construction: Poured Concrete Foundation and Structure Contractors (10-19: 1, 1-4: 2)
Accommodation and Food Services: Full-Service Restaurants (10-19: 1, 1-4: 1)
Construction: New Single-Family Housing Construction (except Operative Builders) (5-9: 2)
Construction: Framing Contractors (5-9: 2)
Fatal accident statistics in 2014:
Fatal accident count: 2
Vehicles involved in fatal accidents: 2
Fatal accidents caused by drunken drivers: 0
Fatalities: 2
Persons involved in fatal accidents: 4
Pedestrians involved in fatal accidents: 0
Fatal accident statistics in 2013:
Fatal accident count: 2
Vehicles involved in fatal accidents: 3
Fatal accidents caused by drunken drivers: 0
Fatalities: 2
Persons involved in fatal accidents: 2
Pedestrians involved in fatal accidents: 1
Home Mortgage Disclosure Act Aggregated Statistics For Year 2009 (Based on 4 partial tracts)
A) FHA, FSA/RHS & VA Home Purchase Loans
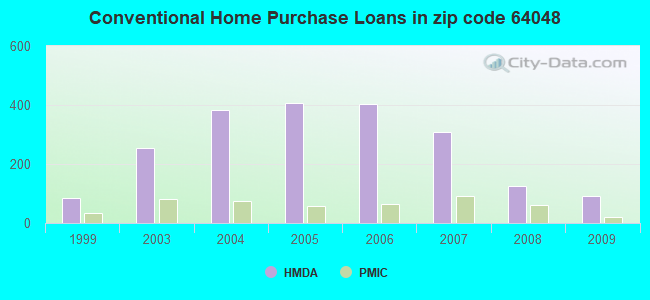
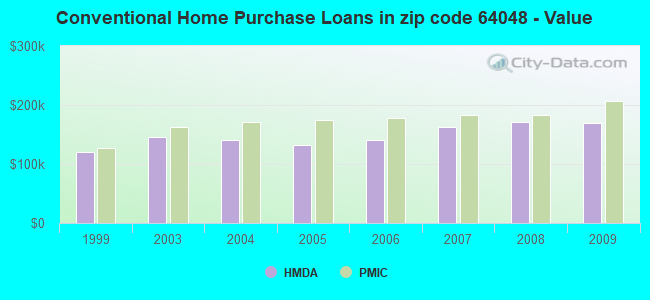
B) Conventional Home Purchase Loans
C) Refinancings
D) Home Improvement Loans
F) Non-occupant Loans on < 5 Family Dwellings (A B C & D)
Number
Average Value
Number
Average Value
Number
Average Value
Number
Average Value
Number
Average Value
LOANS ORIGINATED
117
$161,808
93
$168,773
473
$177,218
22
$56,396
16
$121,838
APPLICATIONS APPROVED, NOT ACCEPTED
4
$185,208
7
$173,969
45
$180,760
4
$14,425
2
$139,175
APPLICATIONS DENIED
9
$157,289
8
$159,562
120
$200,356
6
$62,332
1
$264,760
APPLICATIONS WITHDRAWN
9
$178,107
10
$193,380
103
$185,733
4
$59,935
2
$80,355
FILES CLOSED FOR INCOMPLETENESS
0
$0
0
$0
19
$201,305
1
$59,780
0
$0
Aggregated Statistics For Year 2008 (Based on 4 partial tracts)
A) FHA, FSA/RHS & VA Home Purchase Loans
B) Conventional Home Purchase Loans
C) Refinancings
D) Home Improvement Loans
E) Loans on Dwellings For 5+ Families
F) Non-occupant Loans on < 5 Family Dwellings (A B C & D)
G) Loans On Manufactured Home Dwelling (A B C & D)
Number
Average Value
Number
Average Value
Number
Average Value
Number
Average Value
Number
Average Value
Number
Average Value
Number
Average Value
LOANS ORIGINATED
71
$163,916
124
$171,952
245
$178,210
25
$48,794
1
$217,110
30
$136,249
1
$28,280
APPLICATIONS APPROVED, NOT ACCEPTED
5
$147,856
12
$198,442
32
$173,742
3
$28,460
0
$0
1
$71,630
0
$0
APPLICATIONS DENIED
6
$156,667
8
$184,062
115
$184,910
18
$60,519
0
$0
5
$221,872
1
$46,310
APPLICATIONS WITHDRAWN
3
$209,067
15
$180,956
57
$170,978
2
$143,680
0
$0
3
$95,323
0
$0
FILES CLOSED FOR INCOMPLETENESS
1
$225,430
1
$247,230
11
$166,621
2
$155,630
0
$0
0
$0
0
$0
Aggregated Statistics For Year 2007 (Based on 4 partial tracts)
A) FHA, FSA/RHS & VA Home Purchase Loans
B) Conventional Home Purchase Loans
C) Refinancings
D) Home Improvement Loans
F) Non-occupant Loans on < 5 Family Dwellings (A B C & D)
Number
Average Value
Number
Average Value
Number
Average Value
Number
Average Value
Number
Average Value
LOANS ORIGINATED
24
$162,158
310
$163,259
244
$167,440
43
$48,211
33
$151,354
APPLICATIONS APPROVED, NOT ACCEPTED
1
$92,380
36
$172,963
58
$157,981
8
$97,282
4
$93,378
APPLICATIONS DENIED
2
$185,230
33
$213,279
141
$169,088
29
$48,837
9
$153,172
APPLICATIONS WITHDRAWN
2
$169,420
23
$173,159
78
$161,112
8
$138,614
4
$143,315
FILES CLOSED FOR INCOMPLETENESS
2
$139,530
9
$183,308
19
$220,004
3
$73,620
3
$139,163
Aggregated Statistics For Year 2006 (Based on 4 partial tracts)
A) FHA, FSA/RHS & VA Home Purchase Loans
B) Conventional Home Purchase Loans
C) Refinancings
D) Home Improvement Loans
F) Non-occupant Loans on < 5 Family Dwellings (A B C & D)
G) Loans On Manufactured Home Dwelling (A B C & D)
Number
Average Value
Number
Average Value
Number
Average Value
Number
Average Value
Number
Average Value
Number
Average Value
LOANS ORIGINATED
24
$165,342
402
$141,445
270
$149,915
51
$60,971
47
$118,713
1
$34,420
APPLICATIONS APPROVED, NOT ACCEPTED
1
$205,900
40
$144,090
63
$161,726
11
$45,693
7
$111,514
1
$95,400
APPLICATIONS DENIED
3
$244,257
58
$132,837
165
$152,612
21
$54,254
7
$150,236
0
$0
APPLICATIONS WITHDRAWN
6
$176,712
44
$137,298
116
$164,316
12
$73,004
9
$107,924
0
$0
FILES CLOSED FOR INCOMPLETENESS
1
$190,800
9
$128,179
27
$134,485
0
$0
1
$176,590
0
$0
Aggregated Statistics For Year 2005 (Based on 4 partial tracts)
A) FHA, FSA/RHS & VA Home Purchase Loans
B) Conventional Home Purchase Loans
C) Refinancings
D) Home Improvement Loans
F) Non-occupant Loans on < 5 Family Dwellings (A B C & D)
G) Loans On Manufactured Home Dwelling (A B C & D)
Number
Average Value
Number
Average Value
Number
Average Value
Number
Average Value
Number
Average Value
Number
Average Value
LOANS ORIGINATED
33
$165,028
407
$131,874
339
$148,493
40
$58,472
43
$124,668
0
$0
APPLICATIONS APPROVED, NOT ACCEPTED
1
$145,930
51
$130,318
48
$154,622
3
$134,100
3
$162,133
0
$0
APPLICATIONS DENIED
3
$161,423
45
$126,635
144
$157,929
26
$40,542
8
$91,988
2
$53,555
APPLICATIONS WITHDRAWN
1
$221,250
36
$149,690
126
$153,429
9
$131,922
9
$121,503
0
$0
FILES CLOSED FOR INCOMPLETENESS
1
$71,850
11
$153,401
25
$164,615
2
$51,105
1
$79,740
0
$0
Aggregated Statistics For Year 2004 (Based on 4 partial tracts)
A) FHA, FSA/RHS & VA Home Purchase Loans
B) Conventional Home Purchase Loans
C) Refinancings
D) Home Improvement Loans
F) Non-occupant Loans on < 5 Family Dwellings (A B C & D)
G) Loans On Manufactured Home Dwelling (A B C & D)
Number
Average Value
Number
Average Value
Number
Average Value
Number
Average Value
Number
Average Value
Number
Average Value
LOANS ORIGINATED
42
$148,564
382
$140,059
391
$149,744
23
$51,547
21
$120,195
0
$0
APPLICATIONS APPROVED, NOT ACCEPTED
1
$111,100
33
$158,811
44
$149,531
5
$81,218
2
$142,360
1
$66,320
APPLICATIONS DENIED
4
$148,840
38
$140,546
122
$147,343
22
$54,388
3
$245,103
1
$56,900
APPLICATIONS WITHDRAWN
3
$140,833
35
$143,138
98
$151,719
6
$73,555
3
$128,717
0
$0
FILES CLOSED FOR INCOMPLETENESS
0
$0
13
$149,455
29
$160,372
2
$21,600
1
$292,240
0
$0
Aggregated Statistics For Year 2003 (Based on 4 partial tracts)
A) FHA, FSA/RHS & VA Home Purchase Loans
B) Conventional Home Purchase Loans
C) Refinancings
D) Home Improvement Loans
E) Loans on Dwellings For 5+ Families
F) Non-occupant Loans on < 5 Family Dwellings (A B C & D)
Number
Average Value
Number
Average Value
Number
Average Value
Number
Average Value
Number
Average Value
Number
Average Value
LOANS ORIGINATED
44
$138,955
254
$146,168
812
$145,122
20
$23,165
1
$782,860
25
$114,034
APPLICATIONS APPROVED, NOT ACCEPTED
1
$204,880
23
$133,736
79
$144,666
2
$23,450
0
$0
3
$128,140
APPLICATIONS DENIED
5
$157,442
24
$144,745
147
$145,901
11
$25,202
0
$0
3
$139,103
APPLICATIONS WITHDRAWN
3
$117,177
29
$167,186
127
$152,708
4
$28,728
0
$0
1
$155,100
FILES CLOSED FOR INCOMPLETENESS
0
$0
10
$172,681
29
$137,824
1
$65,690
0
$0
2
$171,225
Aggregated Statistics For Year 1999 (Based on 1 partial tract)
A) FHA, FSA/RHS & VA Home Purchase Loans
B) Conventional Home Purchase Loans
C) Refinancings
D) Home Improvement Loans
F) Non-occupant Loans on < 5 Family Dwellings (A B C & D)
Detailed PMIC statistics for the following Tracts:0218.01
, 0218.02
2002 - 2018 National Fire Incident Reporting System (NFIRS) incidents
Based on the data from the years 2002 - 2018 the average number of fires per year is 35. The highest number of fire incidents - 61 took place in 2009, and the least - 1 in 2005. The data has a rising trend.
When looking into fire subcategories, the most reports belonged to: Outside Fires (60.0%), and Structure Fires (23.8%).
Fire incident types reported to NFIRS in Zip Code 64048


 Nearest zip codes: 64060, 64465, 64477, 64167, 64492, 64024.
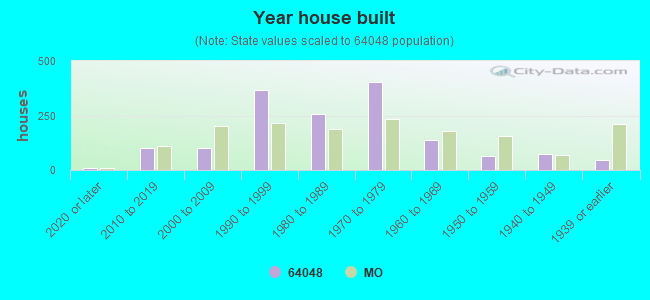


 Based on the data from the years 2002 - 2018 the average number of fires per year is 35. The highest number of fire incidents - 61 took place in 2009, and the least - 1 in 2005. The data has a rising trend.
 When looking into fire subcategories, the most reports belonged to: Outside Fires (60.0%), and Structure Fires (23.8%).