Estimated zip code population in 2022: 772 Zip code population in 2010: 828 Zip code population in 2000: 745
Houses and condos: 320 Renter-occupied apartments: 42
% of renters here:
17%
State:
32%
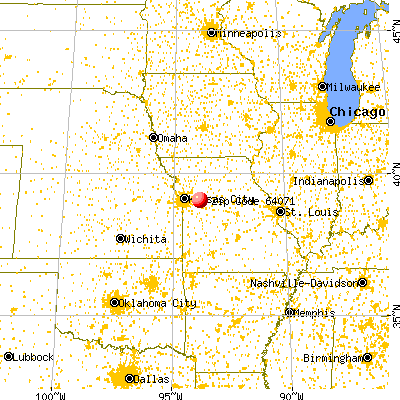
March 2022 cost of living index in zip code 64071: 76.7 (low, U.S. average is 100)
Land area: 36.6 sq. mi. Water area: 0.3 sq. mi.
Population density: 21 people per square mile
(very low).
OSM Map
General Map
Google Map
MSN Map
OSM Map
General Map
Google Map
MSN Map
OSM Map
General Map
Google Map
MSN Map
OSM Map
General Map
Google Map
MSN Map
Please wait while loading the map...
Real estate property taxes paid for housing units in 2022:
This zip code:
0.7% ($1,289)
Missouri:
0.8% ($1,810)
Median real estate property taxes paid for housing units with mortgages in 2022: $1,401 (0.4%) Median real estate property taxes paid for housing units with no mortgage in 2022: $1,254 (1.0%)
Business Search- 14 Million verified businesses
Males: 392
(50.8%)
Females: 379
(49.2%)
For population 25 years and over in 64071:
High school or higher: 94.8%
Bachelor's degree or higher: 18.6%
Graduate or professional degree: 5.0%
Unemployed: 0.7%
Mean travel time to work (commute): 26.9 minutes
For population 15 years and over in 64071:
Never married: 30.1%
Now married: 42.4%
Separated: 0.7%
Widowed: 7.7%
Divorced: 19.2%
Zip code 64071 compared to state average:
Unemployed percentage significantly below state average.
Black race population percentage below state average.
Hispanic race population percentage significantly below state average.
Median age above state average.
Renting percentage below state average.
Length of stay since moving in significantly above state average.
Number of rooms per house above state average.
Number of college students significantly below state average.
Percentage of population with a bachelor's degree or higher below state average.
Estimated median house/condo value in 2022: $175,828
64071:
$175,828
Missouri:
$221,200
According to our research of Missouri and other state lists, there was 1 registered sex offender living in 64071 zip code as of May 28, 2024. The ratio of all residents to sex offenders in zip code 64071 is 784 to 1. The ratio of registered sex offenders to all residents in this zip code is lower than the state average.
Median resident age:
This zip code:
46.0 years
Missouri median age:
39.1 years
Average household size:
This zip code:
3.1 people
Missouri:
2.4 people
Averages for the 2020 tax year for zip code 64071, filed in 2021:
Average Adjusted Gross Income (AGI) in 2020: $52,941 (Individual Income Tax Returns)
Here:
$52,941
State:
$68,151
Salary/wage: $49,183 (reported on 76.9% of returns)
Here:
$49,183
State:
$56,131
(% of AGI for various income ranges: 1286.7% for AGIs below $25k, 3568.6% for AGIs $25k-50k, 7555.0% for AGIs $50k-75k, 11960.0% for AGIs $75k-100k, 18950.0% for AGIs $100k-200k)
Taxable interest for individuals: $733 (reported on 30.8% of returns)
This zip code:
$733
Missouri:
$1,586
(% of AGI for various income ranges: 37.8% for AGIs below $25k, 10.0% for AGIs $25k-50k, 80.0% for AGIs $50k-75k, 50.0% for AGIs $100k-200k)
Ordinary dividends: $1,317 (reported on 15.4% of returns)
Here:
$1,317
State:
$10,947
(% of AGI for various income ranges: 50.0% for AGIs $25k-50k, 220.0% for AGIs $75k-100k)
Net capital gain/loss in AGI: +$7,329 (reported on 17.9% of returns)
Here:
+$7,329
State:
+$18,453
(% of AGI for various income ranges: 68.6% for AGIs $25k-50k, 2325.0% for AGIs $75k-100k)
Profit/loss from business: +$4,517 (reported on 15.4% of returns)
Here:
+$4,517
State:
+$12,260
(% of AGI for various income ranges: 143.3% for AGIs below $25k, 355.0% for AGIs $50k-75k)
Taxable individual retirement arrangement distribution: $10,950 (reported on 10.3% of returns)
64071:
$10,950
Missouri:
$19,719
(% of AGI for various income ranges: 625.7% for AGIs $25k-50k)
Earned income credit: $2,700 (reported on 12.8% of returns)
Here:
$2,700
State:
$2,315
(% of AGI for various income ranges: 150.0% for AGIs below $25k)
Percentage of individuals using paid preparers for their 2020 taxes: 89.7%
Here:
90%
State:
93%
(% for various income ranges: 92.3% for AGIs below $25k, 88.9% for AGIs $25k-50k, 85.7% for AGIs $50k-75k, 75.0% for AGIs $75k-100k, 100.0% for AGIs $100k-200k)
Averages for the 2012 tax year for zip code 64071, filed in 2013:
Average Adjusted Gross Income (AGI) in 2012: $42,397 (Individual Income Tax Returns)
Here:
$42,397
State:
$55,896
Salary/wage: $39,924 (reported on 80.6% of returns)
Here:
$39,924
State:
$46,205
(% of AGI for various income ranges: 64.2% for AGIs below $25k, 86.7% for AGIs $25k-50k, 67.8% for AGIs $50k-75k, 87.2% for AGIs $75k-100k, 72.3% for AGIs $100k-200k)
Taxable interest for individuals: $977 (reported on 36.1% of returns)
This zip code:
$977
Missouri:
$1,559
(% of AGI for various income ranges: 2.5% for AGIs below $25k, 1.5% for AGIs $25k-50k, 0.3% for AGIs $50k-75k, 0.9% for AGIs $75k-100k)
Ordinary dividends: $1,617 (reported on 16.7% of returns)
Here:
$1,617
State:
$7,410
Net capital gain/loss in AGI: +$25 (reported on 11.1% of returns)
Here:
+$25
State:
+$11,579
Profit/loss from business: +$3,650 (reported on 11.1% of returns)
Here:
+$3,650
State:
+$11,688
Taxable individual retirement arrangement distribution: $11,125 (reported on 11.1% of returns)
64071:
$11,125
Missouri:
$14,773
Total itemized deductions: $17,171 (22% of AGI, reported on 19.4% of returns)
Here:
$17,171
State:
$22,730
Here:
21.9% of AGI
State:
19.2% of AGI
Charity contributions: $2,167 (reported on 16.7% of returns)
Here:
$2,167
State:
$4,745
Taxes paid: $5,386 (reported on 19.4% of returns)
64071:
$5,386
State:
$8,399
Earned income credit: $1,814 (reported on 19.4% of returns)
Here:
$1,814
State:
$2,288
(% of AGI for various income ranges: 6.0% for AGIs below $25k, 1.0% for AGIs $25k-50k)
Percentage of individuals using paid preparers for their 2012 taxes: 63.9%
Here:
64%
State:
55%
(% for various income ranges: 57.1% for AGIs below $25k, 62.5% for AGIs $25k-50k, 71.4% for AGIs $50k-75k, 75.0% for AGIs $75k-100k, 66.7% for AGIs $100k-200k)
Averages for the 2004 tax year for zip code 64071, filed in 2005:
Average Adjusted Gross Income (AGI) in 2004: $34,541 (Individual Income Tax Returns)
Here:
$34,541
State:
$44,591
Salary/wage: $33,202 (reported on 83.2% of returns)
Here:
$33,202
State:
$38,941
(% of AGI for various income ranges: 135.9% for AGIs below $10k, 65.9% for AGIs $10k-25k, 80.5% for AGIs $25k-50k, 83.3% for AGIs $50k-75k, 79.3% for AGIs $75k-100k)
Taxable interest for individuals: $1,274 (reported on 49.6% of returns)
This zip code:
$1,274
Missouri:
$1,801
(% of AGI for various income ranges: 5.6% for AGIs below $10k, 4.6% for AGIs $10k-25k, 2.0% for AGIs $25k-50k, 1.1% for AGIs $50k-75k, 0.7% for AGIs $75k-100k)
Taxable dividends: $915 (reported on 15.7% of returns)
Here:
$915
State:
$3,677
Net capital gain/loss: +$3,869 (reported on 16.3% of returns)
Here:
+$3,869
State:
+$8,915
Profit/loss from business: +$2,240 (reported on 13.3% of returns)
Here:
+$2,240
State:
+$9,793
IRA payment deduction: $3,100 (reported on 2.7% of returns)
64071:
$3,100
Missouri:
$2,972
Total itemized deductions: $13,662 (26% of AGI, reported on 21.3% of returns)
Here:
$13,662
State:
$18,261
Here:
26.0% of AGI
State:
20.5% of AGI
(% of AGI for various income ranges: 10.2% for AGIs $10k-25k, 8.6% for AGIs $25k-50k, 8.9% for AGIs $50k-75k, 7.1% for AGIs $75k-100k)
Charity contributions deductions: $1,789 (3% of AGI, reported on 15.2% of returns)
Here:
$1,789
State:
$3,665
Here:
3.3% of AGI
State:
3.9% of AGI
Total tax: $3,410 (reported on 76.8% of returns)
64071:
$3,410
State:
$6,999
(% of AGI for various income ranges: 3.0% for AGIs below $10k, 3.4% for AGIs $10k-25k, 6.3% for AGIs $25k-50k, 8.4% for AGIs $50k-75k, 11.0% for AGIs $75k-100k)
Earned income credit: $1,828 (reported on 15.5% of returns)
Here:
$1,828
State:
$1,728
Percentage of individuals using paid preparers for their 2004 taxes: 72.5%
Here:
73%
State:
62%
(% for various income ranges: 65.6% for AGIs below $10k, 70.6% for AGIs $10k-25k, 75.2% for AGIs $25k-50k, 69.7% for AGIs $50k-75k, 88.2% for AGIs $75k-100k)
Household received Food Stamps/SNAP in the past 12 months: 54 Household did not receive Food Stamps/SNAP in the past 12 months: 195
Women who had a birth in the past 12 months: 7 (0 now married, 8 unmarried) Women who did not have a birth in the past 12 months: 183 (55 now married, 129 unmarried)
Housing units in zip code 64071 with a mortgage: 79 Houses without a mortgage: 5
Residents with income below the poverty level in 2022:
This zip code:
18.8%
Whole state:
13.2%
Residents with income below 50% of the poverty level in 2022:
This zip code:
15.0%
Whole state:
6.8%
Median number of rooms in houses and condos:
Here:
7.1
State:
6.4
Median number of rooms in apartments:
Here:
4.6
State:
4.4
Notable locations in this zip code not listed on our city pages
In group quarters: 3 (-1 institutionalized population)
Size of family households: 112 2-persons, 24 3-persons, 30 4-persons, 22 5-persons, 11 6-persons, 8 7-or-more-persons
Size of nonfamily households: 21 1-person, 5 2-persons, 11 3-persons
40 married couples with children.
18 single-parent households (5 men, 13 women).
90.3% of residents of 64071 zip code speak English at home.
9.1% of residents speak Asian or Pacific Island language at home (81% very well, 19% well).
Foreign born population: 33 (4.3%) (38.5% of them are naturalized citizens)
This zip code:
4.3%
Whole state:
4.1%
27%English
20%American
11%German
6%Irish
2%Italian
2%Scandinavian
0%European
Year of entry for the foreign-born population
232010 or later
122000 to 2009
01990 to 1999
3Before 1990
Facilities with environmental interests located in this zip code:
RAY CARROLL COUNTY GRAIN GROWERS INCORPORATED MAYVIEW (110 NORTH RAILROAD in MAYVIEW, MO)
AIR MINOR (AIRS/AFS) STATE MASTER (Missouri monitoring and compilance) - NCDB-I07#199601170MO03 1, COMPLIANCE ACTIVITY, NCDB-I07#19960117F2964 1, AIRS/AFS-MO0933795, AIR MINOR, PCS-MOR240201, NPDES NON-MAJOR COMPLIANCE ACTIVITY (Tracking inspections of insecticide, fungicide, and rodenticide, and toxic substances) CRITERIA AND HAZARDOUS AIR POLLUTANT INVENTORY (Inventory of air pollution sources) National Pollutant Discharge Elimination System NON-MAJOR (Tracking pollutant discharge elimination systems) - permit Business SIC classification: FARM SUPPLIES Organizations: RAY-CARROLL CO GRAIN GROW (CONTACT/OWNER)
Alternative names: RAY-CARROLL CO GRAIN, RAY-CARROLL CO GRAIN GROW, RAY-CARROLL COUNTY GRAIN CO
Housing units lacking complete plumbing facilities: 3.1% Housing units lacking complete kitchen facilities: 0.8%
44.3%Electricity
42.6%Bottled, tank, or LP gas
7.4%Wood
4.6%Utility gas
1.7%Other fuel
Population in 1990: 746.
Place of birth for U.S.-born residents:
This state: 548
Northeast: 1
Midwest: 123
South: 54
West: 6
63% of the 64071 zip code residents lived in the same house 5 years ago. Out of people who lived in different houses, 45% lived in this county. Out of people who lived in different counties, 50% lived in Missouri.
84% of the 64071 zip code residents lived in the same house 1 year ago. Out of people who lived in different houses, 66% moved from this county. Out of people who lived in different houses, 2% moved from different county within same state. Out of people who lived in different houses, 29% moved from different state.
Private vs. public school enrollment:
Students in private schools in grades 1 to 8 (elementary and middle school): 1
Here:
1.9%
Missouri:
15.4%
Students in private schools in grades 9 to 12 (high school): 31
Here:
46.0%
Missouri:
13.9%
Students in private undergraduate colleges:
Here:
0.0%
Missouri:
22.6%
Occupation by median earnings in the past 12 months ($)
64,021Installation, maintenance, and repair occupations
55,381Production occupations
44,174Material moving occupations
39,395Management occupations
33,373Construction and extraction occupations
31,808Building and grounds cleaning and maintenance occupations
Companies with federal contracts located in this zip code:
BRAMLETT, JERRY, JR (15783 ZION CEMETERY RD in MAYVIEW, MO) : $25,626 in 6 contractsfrom 2004 to 2005
Contracts for Maintenance, Repair or Alteration of Real Property -- Museums and Exhibition Buildings, Recreation Site Maintenance Services (non-construction) by Army, U.S. Army Corps of Engineers - civil program financing only Signed by year:2000: $0; 2001: $0; 2002: $0; 2003: $0; 2004: $13,366; 2005: $12,260; 2006: $0.
Biggest contracts:
$11,950 with Army for Maintenance, Repair or Alteration of Real Property -- Museums and Exhibition Buildings. Signed on 2004-08-31. Completion date: 2004-09-30.
$3,230 with Army for Recreation Site Maintenance Services (non-construction). Signed on 2005-02-24. Completion date: 2005-04-01.
$3,230 with U.S. Army Corps of Engineers - civil program financing only for Recreation Site Maintenance Services (non-construction). Signed on 2005-02-24. Completion date: 2005-04-01.
$2,900 with Army for Recreation Site Maintenance Services (non-construction). Signed on 2005-03-08. Completion date: 2005-04-01.
Top industries in this zip code by the number of employees in 2005:
Construction: Poured Concrete Foundation and Structure Contractors (10-19 employees: 1 establishment)
Finance and Insurance: Commercial Banking (10-19: 1)
Construction: Framing Contractors (1-4: 1)
Other Services (except Public Administration): Religious Organizations (1-4: 1)
Construction: Site Preparation Contractors (1-4: 1)
People in group quarters in 2010:
8 people in group homes for juveniles (non-correctional)
2 people in workers' group living quarters and job corps centers
People in group quarters in 2000:
17 people in schools, hospitals, or wards for the intellectually disabled
5 people in other noninstitutional group quarters
Fatal accident statistics in 2010:
Fatal accident count: 1
Vehicles involved in fatal accidents: 2
Fatal accidents caused by drunken drivers: 0
Fatalities: 1
Persons involved in fatal accidents: 3
Pedestrians involved in fatal accidents: 0
Home Mortgage Disclosure Act Aggregated Statistics For Year 2009 (Based on 4 partial tracts)
A) FHA, FSA/RHS & VA Home Purchase Loans
B) Conventional Home Purchase Loans
C) Refinancings
D) Home Improvement Loans
F) Non-occupant Loans on < 5 Family Dwellings (A B C & D)
G) Loans On Manufactured Home Dwelling (A B C & D)
Number
Average Value
Number
Average Value
Number
Average Value
Number
Average Value
Number
Average Value
Number
Average Value
LOANS ORIGINATED
14
$92,367
14
$64,508
48
$115,305
7
$38,134
11
$42,385
2
$28,715
APPLICATIONS APPROVED, NOT ACCEPTED
1
$78,050
0
$0
3
$147,127
0
$0
0
$0
0
$0
APPLICATIONS DENIED
3
$98,330
2
$249,900
15
$140,306
2
$12,165
0
$0
1
$74,200
APPLICATIONS WITHDRAWN
1
$47,010
0
$0
10
$129,167
0
$0
0
$0
0
$0
FILES CLOSED FOR INCOMPLETENESS
0
$0
0
$0
2
$161,385
0
$0
0
$0
0
$0
Aggregated Statistics For Year 2008 (Based on 4 partial tracts)
A) FHA, FSA/RHS & VA Home Purchase Loans
B) Conventional Home Purchase Loans
C) Refinancings
D) Home Improvement Loans
F) Non-occupant Loans on < 5 Family Dwellings (A B C & D)
G) Loans On Manufactured Home Dwelling (A B C & D)
Number
Average Value
Number
Average Value
Number
Average Value
Number
Average Value
Number
Average Value
Number
Average Value
LOANS ORIGINATED
12
$96,138
14
$65,799
36
$114,596
12
$42,292
10
$64,187
5
$61,428
APPLICATIONS APPROVED, NOT ACCEPTED
0
$0
0
$0
3
$137,427
1
$7,080
0
$0
0
$0
APPLICATIONS DENIED
2
$86,495
2
$84,820
20
$115,182
6
$26,652
1
$98,250
1
$124,110
APPLICATIONS WITHDRAWN
0
$0
1
$69,990
7
$117,327
1
$33,730
1
$115,310
1
$60,390
FILES CLOSED FOR INCOMPLETENESS
0
$0
0
$0
2
$108,335
0
$0
0
$0
0
$0
Aggregated Statistics For Year 2007 (Based on 4 partial tracts)
A) FHA, FSA/RHS & VA Home Purchase Loans
B) Conventional Home Purchase Loans
C) Refinancings
D) Home Improvement Loans
F) Non-occupant Loans on < 5 Family Dwellings (A B C & D)
G) Loans On Manufactured Home Dwelling (A B C & D)
Number
Average Value
Number
Average Value
Number
Average Value
Number
Average Value
Number
Average Value
Number
Average Value
LOANS ORIGINATED
9
$101,188
26
$84,314
42
$98,699
12
$26,576
14
$67,589
2
$48,825
APPLICATIONS APPROVED, NOT ACCEPTED
0
$0
2
$115,010
7
$97,141
1
$43,130
0
$0
0
$0
APPLICATIONS DENIED
2
$71,635
6
$52,550
29
$98,275
9
$61,496
2
$79,950
2
$114,790
APPLICATIONS WITHDRAWN
0
$0
2
$123,300
11
$102,821
3
$92,687
1
$38,890
1
$58,140
FILES CLOSED FOR INCOMPLETENESS
0
$0
1
$66,650
4
$137,382
0
$0
0
$0
0
$0
Aggregated Statistics For Year 2006 (Based on 4 partial tracts)
A) FHA, FSA/RHS & VA Home Purchase Loans
B) Conventional Home Purchase Loans
C) Refinancings
D) Home Improvement Loans
F) Non-occupant Loans on < 5 Family Dwellings (A B C & D)
G) Loans On Manufactured Home Dwelling (A B C & D)
Number
Average Value
Number
Average Value
Number
Average Value
Number
Average Value
Number
Average Value
Number
Average Value
LOANS ORIGINATED
14
$97,099
30
$75,558
54
$78,814
14
$27,695
19
$55,168
4
$55,178
APPLICATIONS APPROVED, NOT ACCEPTED
0
$0
5
$84,942
6
$111,450
1
$15,760
1
$104,390
1
$38,890
APPLICATIONS DENIED
2
$79,815
9
$64,677
26
$97,331
13
$48,520
1
$149,930
2
$41,665
APPLICATIONS WITHDRAWN
1
$70,590
3
$102,227
20
$96,962
3
$57,253
2
$39,345
1
$74,500
FILES CLOSED FOR INCOMPLETENESS
0
$0
1
$148,310
4
$135,075
0
$0
0
$0
0
$0
Aggregated Statistics For Year 2005 (Based on 4 partial tracts)
A) FHA, FSA/RHS & VA Home Purchase Loans
B) Conventional Home Purchase Loans
C) Refinancings
D) Home Improvement Loans
F) Non-occupant Loans on < 5 Family Dwellings (A B C & D)
G) Loans On Manufactured Home Dwelling (A B C & D)
Number
Average Value
Number
Average Value
Number
Average Value
Number
Average Value
Number
Average Value
Number
Average Value
LOANS ORIGINATED
11
$93,082
29
$79,651
54
$91,185
19
$28,056
13
$49,359
4
$58,798
APPLICATIONS APPROVED, NOT ACCEPTED
0
$0
3
$74,310
5
$111,938
1
$28,120
1
$43,480
0
$0
APPLICATIONS DENIED
1
$73,230
12
$81,664
32
$87,102
9
$39,483
2
$55,270
1
$35,380
APPLICATIONS WITHDRAWN
0
$0
3
$98,773
24
$97,900
4
$84,485
1
$44,330
1
$56,370
FILES CLOSED FOR INCOMPLETENESS
1
$116,920
2
$124,930
5
$95,572
0
$0
0
$0
0
$0
Aggregated Statistics For Year 2004 (Based on 4 partial tracts)
A) FHA, FSA/RHS & VA Home Purchase Loans
B) Conventional Home Purchase Loans
C) Refinancings
D) Home Improvement Loans
E) Loans on Dwellings For 5+ Families
F) Non-occupant Loans on < 5 Family Dwellings (A B C & D)
G) Loans On Manufactured Home Dwelling (A B C & D)
Number
Average Value
Number
Average Value
Number
Average Value
Number
Average Value
Number
Average Value
Number
Average Value
Number
Average Value
LOANS ORIGINATED
11
$95,653
38
$73,579
57
$83,553
12
$24,878
1
$67,130
20
$50,332
2
$51,875
APPLICATIONS APPROVED, NOT ACCEPTED
0
$0
3
$67,197
7
$87,497
1
$47,890
0
$0
0
$0
0
$0
APPLICATIONS DENIED
1
$78,690
5
$66,012
30
$83,744
5
$29,204
0
$0
1
$81,300
2
$73,260
APPLICATIONS WITHDRAWN
1
$34,050
5
$65,276
20
$94,017
1
$48,180
0
$0
1
$45,240
1
$152,520
FILES CLOSED FOR INCOMPLETENESS
1
$60,710
1
$160,070
6
$107,143
0
$0
0
$0
1
$78,370
0
$0
Aggregated Statistics For Year 2003 (Based on 4 partial tracts)
A) FHA, FSA/RHS & VA Home Purchase Loans
B) Conventional Home Purchase Loans
C) Refinancings
D) Home Improvement Loans
E) Loans on Dwellings For 5+ Families
F) Non-occupant Loans on < 5 Family Dwellings (A B C & D)
Number
Average Value
Number
Average Value
Number
Average Value
Number
Average Value
Number
Average Value
Number
Average Value
LOANS ORIGINATED
9
$75,764
26
$82,279
102
$87,397
10
$18,205
1
$74,200
15
$65,740
APPLICATIONS APPROVED, NOT ACCEPTED
0
$0
1
$28,390
7
$85,987
1
$8,350
0
$0
0
$0
APPLICATIONS DENIED
1
$95,710
4
$65,942
33
$87,912
7
$16,183
0
$0
1
$84,590
APPLICATIONS WITHDRAWN
0
$0
5
$75,614
18
$91,361
1
$29,870
0
$0
1
$71,310
FILES CLOSED FOR INCOMPLETENESS
0
$0
2
$45,325
3
$82,333
0
$0
0
$0
0
$0
Aggregated Statistics For Year 2002 (Based on 4 partial tracts)
A) FHA, FSA/RHS & VA Home Purchase Loans
B) Conventional Home Purchase Loans
C) Refinancings
D) Home Improvement Loans
F) Non-occupant Loans on < 5 Family Dwellings (A B C & D)
Number
Average Value
Number
Average Value
Number
Average Value
Number
Average Value
Number
Average Value
LOANS ORIGINATED
10
$82,283
27
$66,385
67
$84,383
7
$38,321
11
$58,674
APPLICATIONS APPROVED, NOT ACCEPTED
0
$0
2
$72,515
10
$89,276
1
$14,450
0
$0
APPLICATIONS DENIED
1
$40,100
5
$51,076
27
$92,888
4
$13,890
1
$50,110
APPLICATIONS WITHDRAWN
1
$69,060
2
$62,195
20
$81,387
0
$0
0
$0
FILES CLOSED FOR INCOMPLETENESS
0
$0
2
$85,470
5
$98,626
0
$0
0
$0
Aggregated Statistics For Year 2001 (Based on 4 partial tracts)
A) FHA, FSA/RHS & VA Home Purchase Loans
B) Conventional Home Purchase Loans
C) Refinancings
D) Home Improvement Loans
F) Non-occupant Loans on < 5 Family Dwellings (A B C & D)
Number
Average Value
Number
Average Value
Number
Average Value
Number
Average Value
Number
Average Value
LOANS ORIGINATED
8
$69,281
21
$65,196
48
$83,366
9
$21,700
7
$40,184
APPLICATIONS APPROVED, NOT ACCEPTED
0
$0
3
$99,587
6
$66,045
0
$0
1
$26,660
APPLICATIONS DENIED
1
$77,820
6
$70,130
25
$70,564
3
$25,697
0
$0
APPLICATIONS WITHDRAWN
0
$0
1
$70,710
16
$69,970
2
$25,820
0
$0
FILES CLOSED FOR INCOMPLETENESS
0
$0
1
$28,310
3
$106,580
0
$0
0
$0
Aggregated Statistics For Year 2000 (Based on 4 partial tracts)
A) FHA, FSA/RHS & VA Home Purchase Loans
B) Conventional Home Purchase Loans
C) Refinancings
D) Home Improvement Loans
F) Non-occupant Loans on < 5 Family Dwellings (A B C & D)
Number
Average Value
Number
Average Value
Number
Average Value
Number
Average Value
Number
Average Value
LOANS ORIGINATED
7
$68,217
21
$59,133
22
$57,294
10
$16,469
4
$25,378
APPLICATIONS APPROVED, NOT ACCEPTED
0
$0
2
$57,870
3
$58,977
2
$23,890
0
$0
APPLICATIONS DENIED
0
$0
10
$37,866
10
$50,235
4
$12,990
0
$0
APPLICATIONS WITHDRAWN
1
$37,580
2
$91,275
8
$71,979
0
$0
0
$0
FILES CLOSED FOR INCOMPLETENESS
0
$0
0
$0
3
$74,343
0
$0
0
$0
Aggregated Statistics For Year 1999 (Based on 2 partial tracts)
A) FHA, FSA/RHS & VA Home Purchase Loans
B) Conventional Home Purchase Loans
C) Refinancings
D) Home Improvement Loans
F) Non-occupant Loans on < 5 Family Dwellings (A B C & D)
Detailed PMIC statistics for the following Tracts:0904.00
, 0905.00
2002 - 2018 National Fire Incident Reporting System (NFIRS) incidents
Based on the data from the years 2002 - 2018 the average number of fires per year is 7. The highest number of reported fire incidents - 18 took place in 2012, and the least - 1 in 2005. The data has a constant trend.
When looking into fire subcategories, the most reports belonged to: Outside Fires (50.0%), and Structure Fires (26.7%).
Fire incident types reported to NFIRS in Zip Code 64071


 Nearest zip codes: 64037, 64076, 64067, 64097, 64036, 64021.


 Based on the data from the years 2002 - 2018 the average number of fires per year is 7. The highest number of reported fire incidents - 18 took place in 2012, and the least - 1 in 2005. The data has a constant trend.
 When looking into fire subcategories, the most reports belonged to: Outside Fires (50.0%), and Structure Fires (26.7%).