Estimated zip code population in 2022: 1,330 Zip code population in 2010: 1,378 Zip code population in 2000: 1,443
Houses and condos: 474 Renter-occupied apartments: 44
% of renters here:
9%
State:
32%
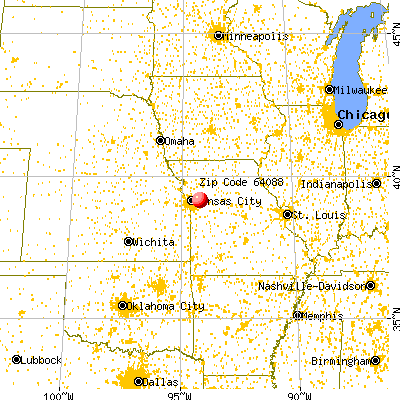
March 2022 cost of living index in zip code 64088: 79.2 (low, U.S. average is 100)
Land area: 27.8 sq. mi. Water area: 0.6 sq. mi.
Population density: 48 people per square mile
(very low).
OSM Map
General Map
Google Map
MSN Map
OSM Map
General Map
Google Map
MSN Map
OSM Map
General Map
Google Map
MSN Map
OSM Map
General Map
Google Map
MSN Map
Please wait while loading the map...
Real estate property taxes paid for housing units in 2022:
This zip code:
0.8% ($2,678)
Missouri:
0.8% ($1,810)
Median real estate property taxes paid for housing units with mortgages in 2022: $2,659 (0.7%) Median real estate property taxes paid for housing units with no mortgage in 2022: $2,715 (0.8%)
Business Search- 14 Million verified businesses
Males: 712
(53.6%)
Females: 617
(46.4%)
For population 25 years and over in 64088:
High school or higher: 92.6%
Bachelor's degree or higher: 16.7%
Graduate or professional degree: 3.1%
Unemployed: 1.2%
Mean travel time to work (commute): 28.2 minutes
For population 15 years and over in 64088:
Never married: 31.0%
Now married: 55.2%
Separated: 0.9%
Widowed: 2.9%
Divorced: 10.0%
Zip code 64088 compared to state average:
Median house value above state average.
Unemployed percentage significantly below state average.
Black race population percentage significantly below state average.
Hispanic race population percentage below state average.
Foreign-born population percentage significantly below state average.
Renting percentage significantly below state average.
Length of stay since moving in above state average.
Number of rooms per house above state average.
Number of college students below state average.
Percentage of population with a bachelor's degree or higher below state average.
Averages for the 2020 tax year for zip code 64088, filed in 2021:
Average Adjusted Gross Income (AGI) in 2020: $65,190 (Individual Income Tax Returns)
Here:
$65,190
State:
$68,151
Salary/wage: $60,731 (reported on 79.0% of returns)
Here:
$60,731
State:
$56,131
(% of AGI for various income ranges: 1042.5% for AGIs below $25k, 3467.3% for AGIs $25k-50k, 6574.3% for AGIs $50k-75k, 9305.0% for AGIs $75k-100k, 16871.7% for AGIs $100k-200k)
Taxable interest for individuals: $673 (reported on 35.5% of returns)
This zip code:
$673
Missouri:
$1,586
(% of AGI for various income ranges: 5.8% for AGIs below $25k, 31.8% for AGIs $25k-50k, 31.4% for AGIs $50k-75k, 21.7% for AGIs $75k-100k, 118.3% for AGIs $100k-200k)
Ordinary dividends: $2,333 (reported on 14.5% of returns)
Here:
$2,333
State:
$10,947
(% of AGI for various income ranges: 29.2% for AGIs below $25k, 107.1% for AGIs $50k-75k, 166.7% for AGIs $100k-200k)
Net capital gain/loss in AGI: +$4,744 (reported on 14.5% of returns)
Here:
+$4,744
State:
+$18,453
(% of AGI for various income ranges: 32.5% for AGIs below $25k, 198.6% for AGIs $50k-75k, 415.0% for AGIs $100k-200k)
Profit/loss from business: +$10,662 (reported on 12.9% of returns)
Here:
+$10,662
State:
+$12,260
(% of AGI for various income ranges: 190.8% for AGIs below $25k, 380.0% for AGIs $25k-50k, 343.3% for AGIs $75k-100k)
Taxable individual retirement arrangement distribution: $13,720 (reported on 8.1% of returns)
64088:
$13,720
Missouri:
$19,719
(% of AGI for various income ranges: 980.0% for AGIs $50k-75k)
Total itemized deductions: $29,767 (reported on 4.8% of returns)
Here:
$29,767
State:
$36,651
(% of AGI for various income ranges: 1488.3% for AGIs $75k-100k)
Charity contributions: $5,750 (reported on 3.2% of returns)
Here:
$5,750
State:
$15,671
(% of AGI for various income ranges: 164.3% for AGIs $50k-75k)
Taxes paid: $8,000 (reported on 4.8% of returns)
64088:
$8,000
State:
$7,608
(% of AGI for various income ranges: 400.0% for AGIs $75k-100k)
Earned income credit: $2,250 (reported on 9.7% of returns)
Here:
$2,250
State:
$2,315
(% of AGI for various income ranges: 70.0% for AGIs below $25k, 46.4% for AGIs $25k-50k)
Percentage of individuals using paid preparers for their 2020 taxes: 93.5%
Here:
94%
State:
93%
(% for various income ranges: 88.9% for AGIs below $25k, 92.9% for AGIs $25k-50k, 100.0% for AGIs $50k-75k, 100.0% for AGIs $75k-100k, 90.0% for AGIs $100k-200k, 100.0% for AGIs over 200k)
Averages for the 2012 tax year for zip code 64088, filed in 2013:
Average Adjusted Gross Income (AGI) in 2012: $51,057 (Individual Income Tax Returns)
Here:
$51,057
State:
$55,896
Salary/wage: $45,169 (reported on 82.8% of returns)
Here:
$45,169
State:
$46,205
(% of AGI for various income ranges: 66.1% for AGIs below $25k, 69.1% for AGIs $25k-50k, 78.7% for AGIs $50k-75k, 83.2% for AGIs $75k-100k, 68.8% for AGIs $100k-200k)
Taxable interest for individuals: $435 (reported on 39.7% of returns)
This zip code:
$435
Missouri:
$1,559
(% of AGI for various income ranges: 1.7% for AGIs below $25k, 0.4% for AGIs $25k-50k, 0.2% for AGIs $50k-75k, 0.1% for AGIs $75k-100k, 0.2% for AGIs $100k-200k)
Ordinary dividends: $1,075 (reported on 13.8% of returns)
Here:
$1,075
State:
$7,410
Net capital gain/loss in AGI: +$900 (reported on 6.9% of returns)
Here:
+$900
State:
+$11,579
Profit/loss from business: +$4,367 (reported on 15.5% of returns)
Here:
+$4,367
State:
+$11,688
(% of AGI for various income ranges: 3.6% for AGIs below $25k, 5.0% for AGIs $25k-50k, 0.8% for AGIs $75k-100k)
Taxable individual retirement arrangement distribution: $11,160 (reported on 8.6% of returns)
64088:
$11,160
Missouri:
$14,773
Total itemized deductions: $18,533 (21% of AGI, reported on 31.0% of returns)
Here:
$18,533
State:
$22,730
Here:
21.1% of AGI
State:
19.2% of AGI
(% of AGI for various income ranges: 12.9% for AGIs $25k-50k, 8.7% for AGIs $50k-75k, 14.2% for AGIs $75k-100k, 12.7% for AGIs $100k-200k)
Charity contributions: $3,069 (reported on 22.4% of returns)
Here:
$3,069
State:
$4,745
(% of AGI for various income ranges: 1.6% for AGIs $25k-50k, 0.9% for AGIs $50k-75k, 1.6% for AGIs $75k-100k, 1.6% for AGIs $100k-200k)
Taxes paid: $7,161 (reported on 31.0% of returns)
64088:
$7,161
State:
$8,399
(% of AGI for various income ranges: 3.6% for AGIs $25k-50k, 3.1% for AGIs $50k-75k, 5.4% for AGIs $75k-100k, 5.8% for AGIs $100k-200k)
Earned income credit: $1,962 (reported on 13.8% of returns)
Here:
$1,962
State:
$2,288
(% of AGI for various income ranges: 5.3% for AGIs below $25k, 0.7% for AGIs $25k-50k)
Percentage of individuals using paid preparers for their 2012 taxes: 63.8%
Here:
64%
State:
55%
(% for various income ranges: 57.9% for AGIs below $25k, 66.7% for AGIs $25k-50k, 60.0% for AGIs $50k-75k, 66.7% for AGIs $75k-100k, 75.0% for AGIs $100k-200k)
Averages for the 2004 tax year for zip code 64088, filed in 2005:
Average Adjusted Gross Income (AGI) in 2004: $39,511 (Individual Income Tax Returns)
Here:
$39,511
State:
$44,591
Salary/wage: $37,836 (reported on 84.5% of returns)
Here:
$37,836
State:
$38,941
(% of AGI for various income ranges: 113.8% for AGIs below $10k, 62.9% for AGIs $10k-25k, 80.7% for AGIs $25k-50k, 81.9% for AGIs $50k-75k, 93.9% for AGIs $75k-100k, 72.6% for AGIs over 100k)
Taxable interest for individuals: $841 (reported on 49.2% of returns)
This zip code:
$841
Missouri:
$1,801
(% of AGI for various income ranges: 6.8% for AGIs below $10k, 3.0% for AGIs $10k-25k, 1.3% for AGIs $25k-50k, 0.4% for AGIs $50k-75k, 0.2% for AGIs $75k-100k, 1.0% for AGIs over 100k)
Taxable dividends: $828 (reported on 14.5% of returns)
Here:
$828
State:
$3,677
(% of AGI for various income ranges: 0.4% for AGIs $10k-25k, 0.7% for AGIs $25k-50k, 0.3% for AGIs $50k-75k, 0.0% for AGIs $75k-100k, 0.1% for AGIs over 100k)
Net capital gain/loss: +$1,875 (reported on 8.0% of returns)
Here:
+$1,875
State:
+$8,915
(% of AGI for various income ranges: 0.2% for AGIs below $10k, -0.2% for AGIs $25k-50k, 1.0% for AGIs $50k-75k, 0.7% for AGIs $75k-100k)
Profit/loss from business: +$5,474 (reported on 16.2% of returns)
Here:
+$5,474
State:
+$9,793
(% of AGI for various income ranges: 2.3% for AGIs $10k-25k, 3.3% for AGIs $25k-50k, 2.3% for AGIs $50k-75k, 3.1% for AGIs $75k-100k)
Total itemized deductions: $14,723 (22% of AGI, reported on 30.7% of returns)
Here:
$14,723
State:
$18,261
Here:
22.1% of AGI
State:
20.5% of AGI
(% of AGI for various income ranges: 8.0% for AGIs $10k-25k, 11.8% for AGIs $25k-50k, 12.3% for AGIs $50k-75k, 11.3% for AGIs $75k-100k, 12.6% for AGIs over 100k)
Charity contributions deductions: $2,065 (3% of AGI, reported on 25.9% of returns)
Here:
$2,065
State:
$3,665
Here:
3.0% of AGI
State:
3.9% of AGI
(% of AGI for various income ranges: 0.4% for AGIs $10k-25k, 1.6% for AGIs $25k-50k, 1.7% for AGIs $50k-75k, 0.7% for AGIs $75k-100k, 1.6% for AGIs over 100k)
Total tax: $4,691 (reported on 77.3% of returns)
64088:
$4,691
State:
$6,999
(% of AGI for various income ranges: 3.1% for AGIs below $10k, 4.7% for AGIs $10k-25k, 6.7% for AGIs $25k-50k, 8.4% for AGIs $50k-75k, 10.0% for AGIs $75k-100k, 16.5% for AGIs over 100k)
Earned income credit: $1,311 (reported on 10.2% of returns)
Here:
$1,311
State:
$1,728
Percentage of individuals using paid preparers for their 2004 taxes: 68.3%
Here:
68%
State:
62%
(% for various income ranges: 50.8% for AGIs below $10k, 65.3% for AGIs $10k-25k, 72.4% for AGIs $25k-50k, 81.0% for AGIs $50k-75k, 67.4% for AGIs $75k-100k, 80.0% for AGIs over 100k)
Household received Food Stamps/SNAP in the past 12 months: 15 Household did not receive Food Stamps/SNAP in the past 12 months: 454
Women who had a birth in the past 12 months: 37 (21 now married, 16 unmarried) Women who did not have a birth in the past 12 months: 280 (105 now married, 174 unmarried)
Housing units in zip code 64088 with a mortgage: 228 (12 second mortgage, 13 both second mortgage and home equity loan) Houses without a mortgage: 2
Median monthly owner costs for units with a mortgage: $1,400 Median monthly owner costs for units without a mortgage: $644
Residents with income below the poverty level in 2022:
This zip code:
3.6%
Whole state:
13.2%
Residents with income below 50% of the poverty level in 2022:
This zip code:
2.2%
Whole state:
6.8%
Median number of rooms in houses and condos:
Here:
6.9
State:
6.4
Median number of rooms in apartments:
Here:
5.3
State:
4.4
Notable locations in this zip code not listed on our city pages
Size of family households: 140 2-persons, 76 3-persons, 119 4-persons, 14 5-persons, 7 6-persons, 18 7-or-more-persons
Size of nonfamily households: 77 1-person, 7 2-persons
141 married couples with children.
117 single-parent households (71 men, 46 women).
97.4% of residents of 64088 zip code speak English at home.
0.9% of residents speak Spanish at home (100% very well).
1.2% of residents speak other Indo-European language at home (94% very well, 6% well).
0.1% of residents speak Asian or Pacific Island language at home (100% well).
Foreign born population: 15 (1.2%) (81.4% of them are naturalized citizens)
This zip code:
1.2%
Whole state:
4.1%
93%France
7%Singapore
37%European
31%German
14%English
10%American
3%Irish
1%Scottish
1%Hungarian
Year of entry for the foreign-born population
22010 or later
02000 to 2009
01990 to 1999
13Before 1990
Facilities with environmental interests located in this zip code:
JACKSON CO PKS & REC DEPT (105 OSAGE STREET in SIBLEY, MO)
STATE MASTER (Missouri monitoring and compilance) - PCS-MO0122726, NPDES NON-MAJOR National Pollutant Discharge Elimination System NON-MAJOR (Tracking pollutant discharge elimination systems) - permit Business SIC classification: AMUSEMENT PARKS Alternative names: FORT OSAGE PARK
FORT OSAGE EDUCATION CENT (107 OSAGE STREET in SIBLEY, MO)
National Pollutant Discharge Elimination System NON-MAJOR (Tracking pollutant discharge elimination systems) - permit Business SIC classification: HEAVY CONSTRUCTION Organizations: JACKSON COUNTY, MISSOURI (CONTACT/OWNER)
Alternative names: JACKSON COUNTY, MISSOURI
Housing units lacking complete plumbing facilities: 1.7% Housing units lacking complete kitchen facilities: 1.3%
39.9%Electricity
37.7%Bottled, tank, or LP gas
9.9%Wood
9.2%Other fuel
3.3%Utility gas
Population in 1990: 1,527.
Place of birth for U.S.-born residents:
This state: 1,091
Northeast: 18
Midwest: 120
South: 49
West: 31
77% of the 64088 zip code residents lived in the same house 5 years ago. Out of people who lived in different houses, 76% lived in this county. Out of people who lived in different counties, 50% lived in Missouri.
99% of the 64088 zip code residents lived in the same house 1 year ago. Out of people who lived in different houses, 138% moved from this county.
Private vs. public school enrollment:
Students in private schools in grades 1 to 8 (elementary and middle school): 37
Here:
31.2%
Missouri:
15.4%
Students in private schools in grades 9 to 12 (high school): 38
Here:
36.6%
Missouri:
13.9%
Students in private undergraduate colleges:
Here:
0.0%
Missouri:
22.6%
Occupation by median earnings in the past 12 months ($)
109,381Installation, maintenance, and repair occupations
81,131Education, training, and library occupations
67,140Health diagnosing and treating practitioners and other technical occupations
57,776Construction and extraction occupations
52,551Business and financial operations occupations
41,459Production occupations
Top industries in this zip code by the number of employees in 2005:
Utilities: Electric Power Distribution (100-249 employees: 1 establishment)
Construction: Poured Concrete Foundation and Structure Contractors (5-9: 1)
Construction: New Single-Family Housing Construction (except Operative Builders) (5-9: 1)
Construction: Residential Remodelers (1-4: 2)
Construction: Land Subdivision (1-4: 1)
Arts, Entertainment, and Recreation: All Other Amusement and Recreation Industries (1-4: 1)
Other Services (except Public Administration): Religious Organizations (1-4: 1)
Fatal accident statistics in 2014:
Fatal accident count: 1
Vehicles involved in fatal accidents: 1
Fatal accidents caused by drunken drivers: 1
Fatalities: 1
Persons involved in fatal accidents: 1
Pedestrians involved in fatal accidents: 0
Fatal accident statistics in 2012:
Fatal accident count: 1
Vehicles involved in fatal accidents: 1
Fatal accidents caused by drunken drivers: 0
Fatalities: 1
Persons involved in fatal accidents: 1
Pedestrians involved in fatal accidents: 1
Home Mortgage Disclosure Act Aggregated Statistics For Year 2009 (Based on 4 partial tracts)
A) FHA, FSA/RHS & VA Home Purchase Loans
B) Conventional Home Purchase Loans
C) Refinancings
D) Home Improvement Loans
F) Non-occupant Loans on < 5 Family Dwellings (A B C & D)
G) Loans On Manufactured Home Dwelling (A B C & D)
Number
Average Value
Number
Average Value
Number
Average Value
Number
Average Value
Number
Average Value
Number
Average Value
LOANS ORIGINATED
22
$138,020
28
$150,539
125
$168,481
7
$58,853
8
$106,285
2
$121,860
APPLICATIONS APPROVED, NOT ACCEPTED
1
$128,390
4
$198,780
12
$152,962
2
$19,395
0
$0
0
$0
APPLICATIONS DENIED
5
$81,742
2
$184,460
48
$184,621
4
$10,945
0
$0
0
$0
APPLICATIONS WITHDRAWN
8
$136,149
2
$227,200
27
$147,554
0
$0
0
$0
0
$0
FILES CLOSED FOR INCOMPLETENESS
0
$0
0
$0
10
$149,091
0
$0
0
$0
0
$0
Aggregated Statistics For Year 2008 (Based on 4 partial tracts)
A) FHA, FSA/RHS & VA Home Purchase Loans
B) Conventional Home Purchase Loans
C) Refinancings
D) Home Improvement Loans
F) Non-occupant Loans on < 5 Family Dwellings (A B C & D)
G) Loans On Manufactured Home Dwelling (A B C & D)
Number
Average Value
Number
Average Value
Number
Average Value
Number
Average Value
Number
Average Value
Number
Average Value
LOANS ORIGINATED
18
$138,179
23
$138,057
77
$183,081
12
$58,958
5
$99,688
3
$156,593
APPLICATIONS APPROVED, NOT ACCEPTED
1
$155,010
0
$0
10
$194,946
2
$97,545
0
$0
0
$0
APPLICATIONS DENIED
4
$113,260
7
$133,889
57
$173,075
12
$29,175
2
$60,725
2
$161,105
APPLICATIONS WITHDRAWN
1
$183,480
2
$234,635
20
$144,897
3
$41,300
1
$41,870
0
$0
FILES CLOSED FOR INCOMPLETENESS
0
$0
1
$88,200
7
$150,203
1
$102,110
1
$88,200
0
$0
Aggregated Statistics For Year 2007 (Based on 4 partial tracts)
A) FHA, FSA/RHS & VA Home Purchase Loans
B) Conventional Home Purchase Loans
C) Refinancings
D) Home Improvement Loans
F) Non-occupant Loans on < 5 Family Dwellings (A B C & D)
G) Loans On Manufactured Home Dwelling (A B C & D)
Number
Average Value
Number
Average Value
Number
Average Value
Number
Average Value
Number
Average Value
Number
Average Value
LOANS ORIGINATED
11
$117,202
49
$153,246
100
$146,937
19
$56,677
8
$101,312
5
$94,750
APPLICATIONS APPROVED, NOT ACCEPTED
0
$0
10
$137,875
28
$136,539
6
$45,527
2
$121,370
3
$97,463
APPLICATIONS DENIED
2
$142,775
9
$159,428
59
$152,421
14
$101,939
4
$175,508
2
$69,675
APPLICATIONS WITHDRAWN
0
$0
5
$142,786
27
$139,674
10
$76,228
1
$210,100
1
$43,540
FILES CLOSED FOR INCOMPLETENESS
0
$0
3
$149,980
14
$138,772
2
$85,200
1
$70,340
0
$0
Aggregated Statistics For Year 2006 (Based on 4 partial tracts)
A) FHA, FSA/RHS & VA Home Purchase Loans
B) Conventional Home Purchase Loans
C) Refinancings
D) Home Improvement Loans
F) Non-occupant Loans on < 5 Family Dwellings (A B C & D)
G) Loans On Manufactured Home Dwelling (A B C & D)
Number
Average Value
Number
Average Value
Number
Average Value
Number
Average Value
Number
Average Value
Number
Average Value
LOANS ORIGINATED
10
$118,756
98
$125,995
114
$135,723
19
$40,699
14
$118,001
4
$95,422
APPLICATIONS APPROVED, NOT ACCEPTED
0
$0
19
$105,563
27
$165,255
5
$52,838
4
$89,212
1
$92,950
APPLICATIONS DENIED
0
$0
27
$140,323
81
$151,716
23
$49,131
1
$118,670
3
$71,457
APPLICATIONS WITHDRAWN
0
$0
8
$152,995
48
$146,307
6
$91,063
1
$152,240
0
$0
FILES CLOSED FOR INCOMPLETENESS
1
$164,130
4
$141,225
9
$150,981
0
$0
1
$92,950
1
$164,130
Aggregated Statistics For Year 2005 (Based on 4 partial tracts)
A) FHA, FSA/RHS & VA Home Purchase Loans
B) Conventional Home Purchase Loans
C) Refinancings
D) Home Improvement Loans
F) Non-occupant Loans on < 5 Family Dwellings (A B C & D)
G) Loans On Manufactured Home Dwelling (A B C & D)
Number
Average Value
Number
Average Value
Number
Average Value
Number
Average Value
Number
Average Value
Number
Average Value
LOANS ORIGINATED
6
$110,202
89
$124,632
136
$145,303
14
$42,541
9
$94,522
3
$67,900
APPLICATIONS APPROVED, NOT ACCEPTED
2
$118,910
18
$97,026
25
$163,651
2
$125,795
1
$217,560
0
$0
APPLICATIONS DENIED
0
$0
21
$117,520
80
$167,666
17
$66,781
3
$86,130
2
$80,115
APPLICATIONS WITHDRAWN
0
$0
13
$152,128
57
$161,445
7
$189,476
1
$66,390
0
$0
FILES CLOSED FOR INCOMPLETENESS
0
$0
3
$109,123
9
$153,211
1
$87,090
0
$0
1
$71,180
Aggregated Statistics For Year 2004 (Based on 4 partial tracts)
A) FHA, FSA/RHS & VA Home Purchase Loans
B) Conventional Home Purchase Loans
C) Refinancings
D) Home Improvement Loans
F) Non-occupant Loans on < 5 Family Dwellings (A B C & D)
G) Loans On Manufactured Home Dwelling (A B C & D)
Number
Average Value
Number
Average Value
Number
Average Value
Number
Average Value
Number
Average Value
Number
Average Value
LOANS ORIGINATED
8
$117,951
80
$128,816
152
$146,245
22
$52,293
11
$116,510
6
$91,387
APPLICATIONS APPROVED, NOT ACCEPTED
1
$53,590
18
$97,046
35
$123,559
3
$38,683
2
$77,460
3
$97,697
APPLICATIONS DENIED
2
$90,595
31
$88,004
64
$136,208
13
$41,058
2
$57,465
6
$49,418
APPLICATIONS WITHDRAWN
1
$182,420
10
$110,994
45
$135,612
4
$85,685
3
$88,763
0
$0
FILES CLOSED FOR INCOMPLETENESS
0
$0
4
$80,148
27
$123,554
1
$20,780
0
$0
0
$0
Aggregated Statistics For Year 2003 (Based on 4 partial tracts)
A) FHA, FSA/RHS & VA Home Purchase Loans
B) Conventional Home Purchase Loans
C) Refinancings
D) Home Improvement Loans
F) Non-occupant Loans on < 5 Family Dwellings (A B C & D)
Number
Average Value
Number
Average Value
Number
Average Value
Number
Average Value
Number
Average Value
LOANS ORIGINATED
13
$109,365
68
$130,274
275
$119,163
15
$32,904
6
$86,732
APPLICATIONS APPROVED, NOT ACCEPTED
0
$0
8
$146,255
31
$119,675
0
$0
0
$0
APPLICATIONS DENIED
0
$0
13
$118,304
64
$112,908
8
$18,004
3
$89,693
APPLICATIONS WITHDRAWN
3
$72,017
7
$99,551
60
$109,656
1
$18,980
4
$115,205
FILES CLOSED FOR INCOMPLETENESS
0
$0
2
$149,515
15
$161,121
0
$0
0
$0
Aggregated Statistics For Year 2002 (Based on 2 partial tracts)
A) FHA, FSA/RHS & VA Home Purchase Loans
B) Conventional Home Purchase Loans
C) Refinancings
D) Home Improvement Loans
F) Non-occupant Loans on < 5 Family Dwellings (A B C & D)
Number
Average Value
Number
Average Value
Number
Average Value
Number
Average Value
Number
Average Value
LOANS ORIGINATED
9
$95,278
31
$93,330
127
$117,599
13
$21,128
4
$73,482
APPLICATIONS APPROVED, NOT ACCEPTED
0
$0
6
$98,953
14
$94,746
1
$6,700
1
$34,330
APPLICATIONS DENIED
2
$61,130
5
$76,370
38
$75,741
7
$7,297
1
$44,380
APPLICATIONS WITHDRAWN
0
$0
2
$66,990
30
$105,484
1
$12,560
1
$20,930
FILES CLOSED FOR INCOMPLETENESS
0
$0
1
$100,490
12
$89,532
0
$0
1
$100,490
Aggregated Statistics For Year 2001 (Based on 2 partial tracts)
A) FHA, FSA/RHS & VA Home Purchase Loans
B) Conventional Home Purchase Loans
C) Refinancings
D) Home Improvement Loans
E) Loans on Dwellings For 5+ Families
F) Non-occupant Loans on < 5 Family Dwellings (A B C & D)
Number
Average Value
Number
Average Value
Number
Average Value
Number
Average Value
Number
Average Value
Number
Average Value
LOANS ORIGINATED
12
$76,971
28
$100,578
93
$98,993
15
$14,013
1
$170,830
8
$42,289
APPLICATIONS APPROVED, NOT ACCEPTED
0
$0
4
$29,518
8
$50,244
1
$5,020
0
$0
1
$41,870
APPLICATIONS DENIED
1
$63,640
4
$76,622
47
$84,328
7
$18,183
0
$0
1
$37,680
APPLICATIONS WITHDRAWN
2
$61,970
4
$64,060
22
$94,855
0
$0
0
$0
2
$36,425
FILES CLOSED FOR INCOMPLETENESS
0
$0
1
$152,410
11
$86,328
0
$0
0
$0
0
$0
Aggregated Statistics For Year 2000 (Based on 2 partial tracts)
A) FHA, FSA/RHS & VA Home Purchase Loans
B) Conventional Home Purchase Loans
C) Refinancings
D) Home Improvement Loans
F) Non-occupant Loans on < 5 Family Dwellings (A B C & D)
Number
Average Value
Number
Average Value
Number
Average Value
Number
Average Value
Number
Average Value
LOANS ORIGINATED
11
$73,691
28
$77,400
28
$71,807
13
$18,294
4
$46,685
APPLICATIONS APPROVED, NOT ACCEPTED
1
$62,800
6
$75,925
6
$69,643
5
$8,374
1
$186,740
APPLICATIONS DENIED
0
$0
7
$83,141
29
$82,527
11
$27,635
0
$0
APPLICATIONS WITHDRAWN
3
$72,017
3
$72,573
14
$65,078
1
$84,580
1
$104,680
FILES CLOSED FOR INCOMPLETENESS
0
$0
2
$44,380
3
$88,207
0
$0
1
$121,420
Aggregated Statistics For Year 1999 (Based on 1 partial tract)
A) FHA, FSA/RHS & VA Home Purchase Loans
B) Conventional Home Purchase Loans
C) Refinancings
D) Home Improvement Loans
F) Non-occupant Loans on < 5 Family Dwellings (A B C & D)
Detailed PMIC statistics for the following Tracts:0149.03
, 0150.00
2002 - 2016 National Fire Incident Reporting System (NFIRS) incidents
Based on the data from the years 2002 - 2016 the average number of fire incidents per year is 9. The highest number of fires - 16 took place in 2002, and the least - 5 in 2004. The data has a declining trend.
When looking into fire subcategories, the most incidents belonged to: Outside Fires (50.4%), and Structure Fires (34.6%).
Fire incident types reported to NFIRS in Zip Code 64088


 Nearest zip codes: 64016, 64066, 64077, 64074, 64058, 64056.


 Based on the data from the years 2002 - 2016 the average number of fire incidents per year is 9. The highest number of fires - 16 took place in 2002, and the least - 5 in 2004. The data has a declining trend.
 When looking into fire subcategories, the most incidents belonged to: Outside Fires (50.4%), and Structure Fires (34.6%).