Estimated zip code population in 2022: 1,237 Zip code population in 2010: 1,171 Zip code population in 2000: 1,155
Houses and condos: 495 Renter-occupied apartments: 142
% of renters here:
33%
State:
32%
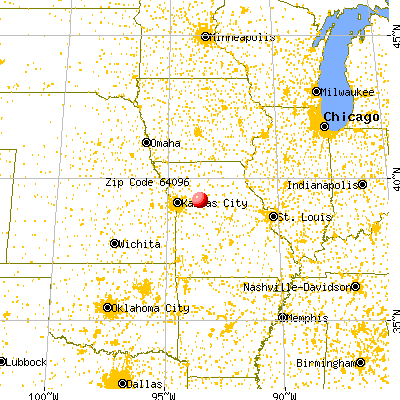
March 2022 cost of living index in zip code 64096: 76.1 (low, U.S. average is 100)
Land area: 42.5 sq. mi. Water area: 1.9 sq. mi.
Population density: 29 people per square mile
(very low).
OSM Map
General Map
Google Map
MSN Map
OSM Map
General Map
Google Map
MSN Map
OSM Map
General Map
Google Map
MSN Map
OSM Map
General Map
Google Map
MSN Map
Please wait while loading the map...
Real estate property taxes paid for housing units in 2022:
This zip code:
1.0% ($1,170)
Missouri:
0.8% ($1,810)
Median real estate property taxes paid for housing units with mortgages in 2022: $1,273 (1.2%) Median real estate property taxes paid for housing units with no mortgage in 2022: $984 (0.9%)
Business Search- 14 Million verified businesses
Males: 676
(54.7%)
Females: 560
(45.3%)
For population 25 years and over in 64096:
High school or higher: 92.1%
Bachelor's degree or higher: 23.3%
Graduate or professional degree: 6.5%
Unemployed: 1.2%
Mean travel time to work (commute): 26.0 minutes
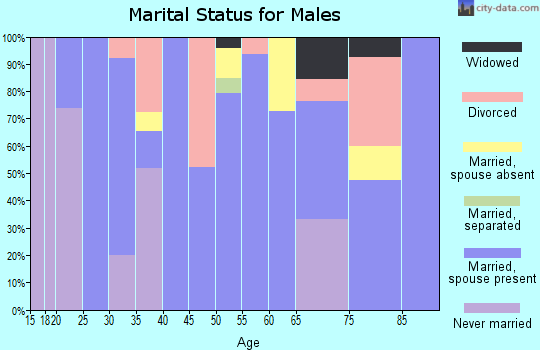
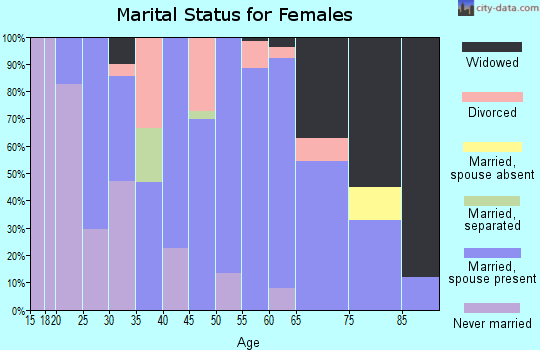
For population 15 years and over in 64096:
Never married: 25.1%
Now married: 54.3%
Separated: 0.5%
Widowed: 6.6%
Divorced: 13.5%
Zip code 64096 compared to state average:
Median house value below state average.
Unemployed percentage significantly below state average.
Black race population percentage significantly below state average.
Hispanic race population percentage above state average.
Foreign-born population percentage below state average.
Length of stay since moving in significantly above state average.
Averages for the 2020 tax year for zip code 64096, filed in 2021:
Average Adjusted Gross Income (AGI) in 2020: $56,160 (Individual Income Tax Returns)
Here:
$56,160
State:
$68,151
Salary/wage: $43,428 (reported on 83.0% of returns)
Here:
$43,428
State:
$56,131
(% of AGI for various income ranges: 1292.0% for AGIs below $25k, 3968.8% for AGIs $25k-50k, 8422.5% for AGIs $50k-75k, 8706.7% for AGIs $75k-100k, 21630.0% for AGIs $100k-200k)
Taxable interest for individuals: $921 (reported on 40.4% of returns)
This zip code:
$921
Missouri:
$1,586
(% of AGI for various income ranges: 36.0% for AGIs below $25k, 51.2% for AGIs $25k-50k, 37.5% for AGIs $50k-75k, 106.7% for AGIs $75k-100k, 170.0% for AGIs $100k-200k)
Ordinary dividends: $2,367 (reported on 19.1% of returns)
Here:
$2,367
State:
$10,947
(% of AGI for various income ranges: 44.0% for AGIs below $25k, 110.0% for AGIs $50k-75k, 416.7% for AGIs $100k-200k)
Net capital gain/loss in AGI: +$5,888 (reported on 17.0% of returns)
Here:
+$5,888
State:
+$18,453
(% of AGI for various income ranges: 40.0% for AGIs below $25k, 302.5% for AGIs $50k-75k, 1033.3% for AGIs $100k-200k)
Profit/loss from business: +$6,100 (reported on 17.0% of returns)
Here:
+$6,100
State:
+$12,260
(% of AGI for various income ranges: 108.0% for AGIs below $25k, 196.2% for AGIs $25k-50k, 743.3% for AGIs $75k-100k)
Taxable individual retirement arrangement distribution: $15,600 (reported on 8.5% of returns)
64096:
$15,600
Missouri:
$19,719
(% of AGI for various income ranges: 780.0% for AGIs $25k-50k)
Earned income credit: $2,013 (reported on 17.0% of returns)
Here:
$2,013
State:
$2,315
(% of AGI for various income ranges: 90.0% for AGIs below $25k, 88.8% for AGIs $25k-50k)
Percentage of individuals using paid preparers for their 2020 taxes: 93.6%
Here:
94%
State:
93%
(% for various income ranges: 88.2% for AGIs below $25k, 91.7% for AGIs $25k-50k, 100.0% for AGIs $50k-75k, 100.0% for AGIs $75k-100k, 100.0% for AGIs $100k-200k)
Averages for the 2012 tax year for zip code 64096, filed in 2013:
Average Adjusted Gross Income (AGI) in 2012: $50,233 (Individual Income Tax Returns)
Here:
$50,233
State:
$55,896
Salary/wage: $37,951 (reported on 83.7% of returns)
Here:
$37,951
State:
$46,205
(% of AGI for various income ranges: 73.8% for AGIs below $25k, 77.6% for AGIs $25k-50k, 75.9% for AGIs $50k-75k, 79.0% for AGIs $75k-100k, 43.0% for AGIs $100k-200k)
Taxable interest for individuals: $760 (reported on 30.6% of returns)
This zip code:
$760
Missouri:
$1,559
(% of AGI for various income ranges: 1.1% for AGIs below $25k, 0.5% for AGIs $25k-50k, 0.3% for AGIs $50k-75k, 0.5% for AGIs $100k-200k)
Ordinary dividends: $980 (reported on 20.4% of returns)
Here:
$980
State:
$7,410
(% of AGI for various income ranges: 1.0% for AGIs below $25k, 0.1% for AGIs $50k-75k, 0.7% for AGIs $100k-200k)
Net capital gain/loss in AGI: +$2,057 (reported on 14.3% of returns)
Here:
+$2,057
State:
+$11,579
(% of AGI for various income ranges: 0.9% for AGIs below $25k, 0.3% for AGIs $50k-75k, 1.1% for AGIs $100k-200k)
Profit/loss from business: +$6,325 (reported on 16.3% of returns)
Here:
+$6,325
State:
+$11,688
(% of AGI for various income ranges: 4.7% for AGIs below $25k, 7.0% for AGIs $25k-50k, 1.5% for AGIs $50k-75k)
Taxable individual retirement arrangement distribution: $8,450 (reported on 8.2% of returns)
64096:
$8,450
Missouri:
$14,773
Total itemized deductions: $20,927 (19% of AGI, reported on 22.4% of returns)
Here:
$20,927
State:
$22,730
Here:
18.9% of AGI
State:
19.2% of AGI
(% of AGI for various income ranges: 12.2% for AGIs below $25k, 8.7% for AGIs $50k-75k, 14.9% for AGIs $75k-100k, 11.8% for AGIs $100k-200k)
Charity contributions: $5,071 (reported on 14.3% of returns)
Here:
$5,071
State:
$4,745
Taxes paid: $6,173 (reported on 22.4% of returns)
64096:
$6,173
State:
$8,399
(% of AGI for various income ranges: 1.8% for AGIs below $25k, 1.8% for AGIs $50k-75k, 4.3% for AGIs $75k-100k, 4.3% for AGIs $100k-200k)
Earned income credit: $2,130 (reported on 20.4% of returns)
Here:
$2,130
State:
$2,288
(% of AGI for various income ranges: 6.3% for AGIs below $25k, 1.4% for AGIs $25k-50k)
Percentage of individuals using paid preparers for their 2012 taxes: 69.4%
Here:
69%
State:
55%
(% for various income ranges: 55.0% for AGIs below $25k, 69.2% for AGIs $25k-50k, 87.5% for AGIs $50k-75k, 100.0% for AGIs $75k-100k, 80.0% for AGIs $100k-200k)
Averages for the 2004 tax year for zip code 64096, filed in 2005:
Average Adjusted Gross Income (AGI) in 2004: $38,628 (Individual Income Tax Returns)
Here:
$38,628
State:
$44,591
Salary/wage: $30,180 (reported on 85.3% of returns)
Here:
$30,180
State:
$38,941
(% of AGI for various income ranges: 77.8% for AGIs below $10k, 81.8% for AGIs $10k-25k, 76.9% for AGIs $25k-50k, 84.0% for AGIs $50k-75k, 76.3% for AGIs $75k-100k, 28.0% for AGIs over 100k)
Taxable interest for individuals: $1,365 (reported on 45.4% of returns)
This zip code:
$1,365
Missouri:
$1,801
(% of AGI for various income ranges: 17.9% for AGIs below $10k, 2.2% for AGIs $10k-25k, 1.6% for AGIs $25k-50k, 0.5% for AGIs $50k-75k, 0.4% for AGIs $75k-100k, 1.4% for AGIs over 100k)
Taxable dividends: $1,587 (reported on 18.8% of returns)
Here:
$1,587
State:
$3,677
(% of AGI for various income ranges: 0.7% for AGIs below $10k, 0.1% for AGIs $10k-25k, 0.1% for AGIs $25k-50k, 0.2% for AGIs $50k-75k, 2.7% for AGIs over 100k)
Net capital gain/loss: +$10,986 (reported on 14.1% of returns)
Here:
+$10,986
State:
+$8,915
(% of AGI for various income ranges: -1.2% for AGIs below $10k, -0.2% for AGIs $10k-25k, 1.0% for AGIs $25k-50k, -0.1% for AGIs $50k-75k, 1.0% for AGIs $75k-100k, 14.6% for AGIs over 100k)
Profit/loss from business: +$3,478 (reported on 13.7% of returns)
Here:
+$3,478
State:
+$9,793
Total itemized deductions: $15,372 (20% of AGI, reported on 16.0% of returns)
Here:
$15,372
State:
$18,261
Here:
19.7% of AGI
State:
20.5% of AGI
(% of AGI for various income ranges: 6.1% for AGIs $10k-25k, 3.3% for AGIs $25k-50k, 9.4% for AGIs $50k-75k, 10.3% for AGIs $75k-100k, 5.8% for AGIs over 100k)
Charity contributions deductions: $3,033 (3% of AGI, reported on 12.5% of returns)
Here:
$3,033
State:
$3,665
Here:
2.9% of AGI
State:
3.9% of AGI
(% of AGI for various income ranges: 1.9% for AGIs $10k-25k, 1.2% for AGIs $50k-75k, 1.9% for AGIs over 100k)
Total tax: $5,224 (reported on 72.2% of returns)
64096:
$5,224
State:
$6,999
(% of AGI for various income ranges: 1.7% for AGIs below $10k, 3.5% for AGIs $10k-25k, 7.5% for AGIs $25k-50k, 7.0% for AGIs $50k-75k, 11.1% for AGIs $75k-100k, 17.9% for AGIs over 100k)
Earned income credit: $1,674 (reported on 17.6% of returns)
Here:
$1,674
State:
$1,728
Percentage of individuals using paid preparers for their 2004 taxes: 76.5%
Here:
76%
State:
62%
(% for various income ranges: 70.5% for AGIs below $10k, 81.3% for AGIs $10k-25k, 77.0% for AGIs $25k-50k, 70.3% for AGIs $50k-75k, 84.6% for AGIs $75k-100k, 73.7% for AGIs over 100k)
Household received Food Stamps/SNAP in the past 12 months: 49 Household did not receive Food Stamps/SNAP in the past 12 months: 384
Women who had a birth in the past 12 months: 9 (9 now married, 0 unmarried) Women who did not have a birth in the past 12 months: 207 (110 now married, 96 unmarried)
Housing units in zip code 64096 with a mortgage: 182 (3 second mortgage, 2 both second mortgage and home equity loan) Houses without a mortgage: 10
Median monthly owner costs for units with a mortgage: $898 Median monthly owner costs for units without a mortgage: $509
Residents with income below the poverty level in 2022:
This zip code:
7.6%
Whole state:
13.2%
Residents with income below 50% of the poverty level in 2022:
This zip code:
5.3%
Whole state:
6.8%
Median number of rooms in houses and condos:
Here:
6.6
State:
6.4
Median number of rooms in apartments:
Here:
5.7
State:
4.4
Notable locations in this zip code not listed on our city pages
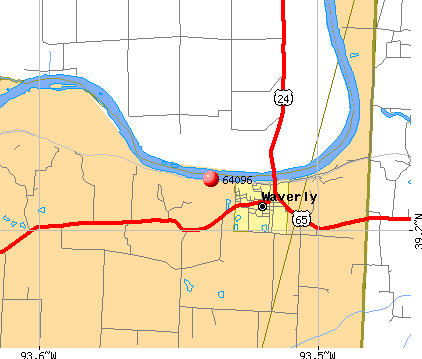
Notable locations in zip code 64096: City of Waverly Volunteer Fire Department (A), Waverly Rural Fire Association (B). Display/hide their locations on the map
In group quarters: 63 (-1 institutionalized population)
Size of family households: 134 2-persons, 106 3-persons, 36 4-persons, 32 5-persons, 6 6-persons
Size of nonfamily households: 96 1-person, 20 2-persons
224 married couples with children.
48 single-parent households (48 women).
97.3% of residents of 64096 zip code speak English at home.
2.7% of residents speak Spanish at home (100% very well).
Foreign born population: 30 (2.5%) (100.0% of them are naturalized citizens)
This zip code:
2.5%
Whole state:
4.1%
93%Honduras
34%German
28%American
15%English
7%Irish
2%European
2%Italian
2%Scottish
Year of entry for the foreign-born population
02010 or later
02000 to 2009
261990 to 1999
0Before 1990
Facilities with environmental interests located in this zip code:
BARTLETT GRAIN COMPANY, L.P. (31697 THOMAS DRIVE in WAVERLY, MO)
AIR SYNTHETIC MINOR (AIRS/AFS) STATE MASTER (Missouri monitoring and compilance) - NEI-291070050, AIR PROGRAM, NCDB-I07#19871201MO-01 1, COMPLIANCE ACTIVITY, NCDB-I07#19990202F2964 1, PCS-MO0121266, NPDES NON-MAJOR, AIRS/AFS-MO0933803, AIR SYNTHETIC MINOR, PCS-MOR240460, NPDES NON-MAJOR COMPLIANCE ACTIVITY (Tracking inspections of insecticide, fungicide, and rodenticide, and toxic substances) CRITERIA AND HAZARDOUS AIR POLLUTANT INVENTORY (Inventory of air pollution sources) National Pollutant Discharge Elimination System NON-MAJOR (Tracking pollutant discharge elimination systems) - permit National Pollutant Discharge Elimination System NON-MAJOR (Tracking pollutant discharge elimination systems) - permit Business SIC classification: GRAIN AND FIELD BEANS Organizations: BARTLETT-WAVERLY (CONTACT/OWNER)
, BARTLETT COUNTRY ELEVATOR (CONTACT/OWNER)
Alternative names: BARTLETT & CO, BARTLETT & COMPANY, BARTLETT AND COMPANY WAVERLY MO, BARTLETT-WAVERLY
ALMA FARMERS COOP ASSOCIATION (215 THOMAS DRIVE in WAVERLY, MO)
AIR MINOR (AIRS/AFS) STATE MASTER (Missouri monitoring and compilance) - NCDB-C07#04150399999091, COMPLIANCE ACTIVITY, NCDB-C07#0415039999901, AIRS/AFS-MO0933802, AIR MINOR, PCS-MOR240495, NPDES NON-MAJOR, NCDB-C07#061092F257301*, COMPLIANCE ACTIVITY, NCDB-I07#19920610F2573 1, COMPLIANCE ACTIVITY (Tracking inspections of insecticide, fungicide, and rodenticide, and toxic substances) National Pollutant Discharge Elimination System NON-MAJOR (Tracking pollutant discharge elimination systems) - permit Business SIC classification: GRAIN AND FIELD BEANS; FARM SUPPLIES Organizations: CENTRAL MO AGRI SERVICE (CONTACT/OWNER)
Alternative names: ALMA FARMERS COOP ASSN, ALMA FARMERS COOP ASSOC - WAVERLY, MFA,CENTRAL MISSOURI AGRI, MID MISSOURI COOPERATIVE
RIVERVIEW HEIGHTS INC (N EDGE OF TOWN NR RIVER in WAVERLY, MO)
STATE MASTER (Missouri monitoring and compilance) - RCRAINFO-MOD067948943, NOT IN A UNIVERSE (Resource Conservation and Recovery Act (tracking hazardous waste))
Housing units lacking complete kitchen facilities: 1.9%
61.0%Utility gas
29.0%Electricity
5.9%Wood
4.5%Bottled, tank, or LP gas
Population in 1990: 1,036. Population change in the 1990s: +119 (+11.5%).
Place of birth for U.S.-born residents:
This state: 1,038
Northeast: 12
Midwest: 94
South: 30
West: 27
58% of the 64096 zip code residents lived in the same house 5 years ago. Out of people who lived in different houses, 49% lived in this county. Out of people who lived in different counties, 50% lived in Missouri.
90% of the 64096 zip code residents lived in the same house 1 year ago. Out of people who lived in different houses, 32% moved from this county. Out of people who lived in different houses, 45% moved from different county within same state. Out of people who lived in different houses, 23% moved from different state.
Private vs. public school enrollment:
Students in private schools in grades 1 to 8 (elementary and middle school): 10
Here:
6.4%
Missouri:
15.4%
Students in private schools in grades 9 to 12 (high school): 10
Here:
11.7%
Missouri:
13.9%
Students in private undergraduate colleges: 2
Here:
8.5%
Missouri:
22.6%
Occupation by median earnings in the past 12 months ($)
80,085Transportation occupations
70,410Health diagnosing and treating practitioners and other technical occupations
65,196Construction and extraction occupations
63,241Management occupations
57,627Sales and related occupations
52,249Education, training, and library occupations
Top industries in this zip code by the number of employees in 2005:
Wholesale Trade: Grain and Field Bean Merchant Wholesalers (20-49 employees: 1 establishment, 5-9 employees: 1 establishment)
Construction: Highway, Street, and Bridge Construction (20-49: 1)
Health Care and Social Assistance: Nursing Care Facilities (20-49: 1)
Other Services (except Public Administration): Religious Organizations (10-19: 1, 5-9: 1, 1-4: 2)
Construction: New Single-Family Housing Construction (except Operative Builders) (10-19: 1)
Accommodation and Food Services: Full-Service Restaurants (5-9: 1)
Construction: Masonry Contractors (5-9: 1)
Accommodation and Food Services: Drinking Places (Alcoholic Beverages) (5-9: 1)
People in group quarters in 2010:
45 people in residential treatment centers for juveniles (non-correctional)
31 people in nursing facilities/skilled-nursing facilities
People in group quarters in 2000:
38 people in short-term care, detention or diagnostic centers for delinquent children
36 people in nursing homes
Home Mortgage Disclosure Act Aggregated Statistics For Year 2009 (Based on 4 partial tracts)
A) FHA, FSA/RHS & VA Home Purchase Loans
B) Conventional Home Purchase Loans
C) Refinancings
D) Home Improvement Loans
F) Non-occupant Loans on < 5 Family Dwellings (A B C & D)
G) Loans On Manufactured Home Dwelling (A B C & D)
Number
Average Value
Number
Average Value
Number
Average Value
Number
Average Value
Number
Average Value
Number
Average Value
LOANS ORIGINATED
2
$61,525
4
$78,170
15
$104,001
4
$69,742
4
$41,718
1
$17,700
APPLICATIONS APPROVED, NOT ACCEPTED
0
$0
0
$0
3
$217,723
0
$0
0
$0
0
$0
APPLICATIONS DENIED
2
$65,740
0
$0
9
$103,290
0
$0
1
$303,410
2
$45,935
APPLICATIONS WITHDRAWN
1
$50,570
0
$0
4
$166,662
0
$0
0
$0
0
$0
FILES CLOSED FOR INCOMPLETENESS
0
$0
0
$0
1
$48,880
0
$0
0
$0
0
$0
Aggregated Statistics For Year 2008 (Based on 4 partial tracts)
A) FHA, FSA/RHS & VA Home Purchase Loans
B) Conventional Home Purchase Loans
C) Refinancings
D) Home Improvement Loans
F) Non-occupant Loans on < 5 Family Dwellings (A B C & D)
G) Loans On Manufactured Home Dwelling (A B C & D)
Number
Average Value
Number
Average Value
Number
Average Value
Number
Average Value
Number
Average Value
Number
Average Value
LOANS ORIGINATED
5
$95,068
9
$65,177
12
$73,534
3
$33,713
4
$72,480
3
$33,993
APPLICATIONS APPROVED, NOT ACCEPTED
0
$0
1
$12,640
0
$0
1
$67,420
0
$0
1
$12,640
APPLICATIONS DENIED
3
$78,943
1
$34,550
8
$101,031
2
$48,040
1
$66,580
1
$9,270
APPLICATIONS WITHDRAWN
0
$0
0
$0
4
$115,252
0
$0
0
$0
0
$0
FILES CLOSED FOR INCOMPLETENESS
0
$0
0
$0
3
$223,343
0
$0
0
$0
0
$0
Aggregated Statistics For Year 2007 (Based on 4 partial tracts)
A) FHA, FSA/RHS & VA Home Purchase Loans
B) Conventional Home Purchase Loans
C) Refinancings
D) Home Improvement Loans
E) Loans on Dwellings For 5+ Families
F) Non-occupant Loans on < 5 Family Dwellings (A B C & D)
G) Loans On Manufactured Home Dwelling (A B C & D)
Number
Average Value
Number
Average Value
Number
Average Value
Number
Average Value
Number
Average Value
Number
Average Value
Number
Average Value
LOANS ORIGINATED
2
$75,430
9
$90,554
27
$73,979
7
$38,649
1
$153,390
2
$113,780
3
$28,373
APPLICATIONS APPROVED, NOT ACCEPTED
0
$0
0
$0
7
$112,936
3
$33,993
0
$0
1
$35,400
0
$0
APPLICATIONS DENIED
1
$66,580
4
$54,992
10
$103,074
6
$12,782
0
$0
1
$35,400
0
$0
APPLICATIONS WITHDRAWN
0
$0
1
$107,040
12
$96,571
0
$0
0
$0
2
$12,640
1
$116,310
FILES CLOSED FOR INCOMPLETENESS
0
$0
1
$63,210
0
$0
0
$0
0
$0
0
$0
0
$0
Aggregated Statistics For Year 2006 (Based on 4 partial tracts)
A) FHA, FSA/RHS & VA Home Purchase Loans
B) Conventional Home Purchase Loans
C) Refinancings
D) Home Improvement Loans
F) Non-occupant Loans on < 5 Family Dwellings (A B C & D)
G) Loans On Manufactured Home Dwelling (A B C & D)
Number
Average Value
Number
Average Value
Number
Average Value
Number
Average Value
Number
Average Value
Number
Average Value
LOANS ORIGINATED
1
$78,380
4
$88,282
27
$84,811
8
$21,491
3
$52,817
1
$103,660
APPLICATIONS APPROVED, NOT ACCEPTED
0
$0
1
$49,730
3
$89,617
1
$8,430
0
$0
0
$0
APPLICATIONS DENIED
0
$0
1
$79,220
13
$78,834
2
$8,430
0
$0
1
$96,920
APPLICATIONS WITHDRAWN
0
$0
0
$0
8
$123,786
1
$13,480
0
$0
1
$102,820
FILES CLOSED FOR INCOMPLETENESS
0
$0
0
$0
3
$100,013
2
$42,985
1
$29,500
0
$0
Aggregated Statistics For Year 2005 (Based on 4 partial tracts)
A) FHA, FSA/RHS & VA Home Purchase Loans
B) Conventional Home Purchase Loans
C) Refinancings
D) Home Improvement Loans
F) Non-occupant Loans on < 5 Family Dwellings (A B C & D)
G) Loans On Manufactured Home Dwelling (A B C & D)
Number
Average Value
Number
Average Value
Number
Average Value
Number
Average Value
Number
Average Value
Number
Average Value
LOANS ORIGINATED
3
$66,580
7
$74,527
23
$81,825
3
$14,890
3
$56,750
0
$0
APPLICATIONS APPROVED, NOT ACCEPTED
0
$0
1
$101,140
4
$104,928
0
$0
0
$0
1
$94,390
APPLICATIONS DENIED
1
$48,040
3
$42,420
20
$87,862
6
$39,472
2
$25,285
3
$43,827
APPLICATIONS WITHDRAWN
0
$0
0
$0
10
$88,494
1
$12,640
0
$0
1
$88,490
FILES CLOSED FOR INCOMPLETENESS
0
$0
1
$106,190
0
$0
0
$0
0
$0
0
$0
Aggregated Statistics For Year 2004 (Based on 4 partial tracts)
A) FHA, FSA/RHS & VA Home Purchase Loans
B) Conventional Home Purchase Loans
C) Refinancings
D) Home Improvement Loans
F) Non-occupant Loans on < 5 Family Dwellings (A B C & D)
Number
Average Value
Number
Average Value
Number
Average Value
Number
Average Value
Number
Average Value
LOANS ORIGINATED
2
$78,800
13
$99,385
19
$88,627
4
$39,822
3
$17,980
APPLICATIONS APPROVED, NOT ACCEPTED
0
$0
1
$57,310
3
$83,437
0
$0
1
$57,310
APPLICATIONS DENIED
1
$102,820
3
$119,397
11
$96,692
4
$17,278
0
$0
APPLICATIONS WITHDRAWN
0
$0
0
$0
8
$93,340
0
$0
0
$0
FILES CLOSED FOR INCOMPLETENESS
0
$0
1
$105,350
3
$131,477
0
$0
0
$0
Aggregated Statistics For Year 2003 (Based on 4 partial tracts)
B) Conventional Home Purchase Loans
C) Refinancings
D) Home Improvement Loans
F) Non-occupant Loans on < 5 Family Dwellings (A B C & D)
Number
Average Value
Number
Average Value
Number
Average Value
Number
Average Value
LOANS ORIGINATED
8
$46,144
30
$88,775
3
$16,577
5
$32,194
APPLICATIONS APPROVED, NOT ACCEPTED
0
$0
4
$86,598
0
$0
0
$0
APPLICATIONS DENIED
3
$75,010
19
$70,662
2
$10,535
1
$19,380
APPLICATIONS WITHDRAWN
2
$133,585
6
$111,812
0
$0
2
$156,760
FILES CLOSED FOR INCOMPLETENESS
0
$0
2
$56,890
0
$0
0
$0
Aggregated Statistics For Year 2002 (Based on 4 partial tracts)
A) FHA, FSA/RHS & VA Home Purchase Loans
B) Conventional Home Purchase Loans
C) Refinancings
D) Home Improvement Loans
F) Non-occupant Loans on < 5 Family Dwellings (A B C & D)
Number
Average Value
Number
Average Value
Number
Average Value
Number
Average Value
Number
Average Value
LOANS ORIGINATED
2
$35,820
9
$42,047
14
$76,514
3
$14,047
4
$24,230
APPLICATIONS APPROVED, NOT ACCEPTED
0
$0
0
$0
5
$110,912
3
$18,260
0
$0
APPLICATIONS DENIED
0
$0
3
$25,847
9
$74,072
3
$22,193
0
$0
APPLICATIONS WITHDRAWN
0
$0
0
$0
10
$99,282
0
$0
0
$0
FILES CLOSED FOR INCOMPLETENESS
0
$0
0
$0
0
$0
0
$0
0
$0
Aggregated Statistics For Year 2001 (Based on 4 partial tracts)
A) FHA, FSA/RHS & VA Home Purchase Loans
B) Conventional Home Purchase Loans
C) Refinancings
D) Home Improvement Loans
F) Non-occupant Loans on < 5 Family Dwellings (A B C & D)
Number
Average Value
Number
Average Value
Number
Average Value
Number
Average Value
Number
Average Value
LOANS ORIGINATED
3
$50,007
9
$44,481
19
$68,223
2
$25,285
2
$26,970
APPLICATIONS APPROVED, NOT ACCEPTED
0
$0
3
$41,297
6
$69,812
2
$17,700
0
$0
APPLICATIONS DENIED
0
$0
2
$37,085
8
$66,686
5
$41,634
2
$1,265
APPLICATIONS WITHDRAWN
0
$0
2
$74,590
11
$70,795
1
$21,910
0
$0
FILES CLOSED FOR INCOMPLETENESS
0
$0
0
$0
1
$75,010
0
$0
0
$0
Aggregated Statistics For Year 2000 (Based on 4 partial tracts)
A) FHA, FSA/RHS & VA Home Purchase Loans
B) Conventional Home Purchase Loans
C) Refinancings
D) Home Improvement Loans
F) Non-occupant Loans on < 5 Family Dwellings (A B C & D)
Number
Average Value
Number
Average Value
Number
Average Value
Number
Average Value
Number
Average Value
LOANS ORIGINATED
3
$69,110
3
$47,197
6
$76,835
4
$29,498
3
$41,577
APPLICATIONS APPROVED, NOT ACCEPTED
0
$0
0
$0
3
$28,373
2
$6,740
0
$0
APPLICATIONS DENIED
2
$45,510
8
$44,141
7
$42,863
1
$12,640
2
$14,330
APPLICATIONS WITHDRAWN
2
$33,290
0
$0
3
$26,690
0
$0
0
$0
FILES CLOSED FOR INCOMPLETENESS
0
$0
0
$0
0
$0
0
$0
0
$0
Aggregated Statistics For Year 1999 (Based on 2 partial tracts)


 Nearest zip codes: 64001, 64022, 64021, 65321, 64633, 65339.