Estimated zip code population in 2022: 1,303 Zip code population in 2010: 1,417 Zip code population in 2000: 1,426
Houses and condos: 546 Renter-occupied apartments: 10
% of renters here:
2%
State:
32%
March 2022 cost of living index in zip code 64401: 76.2 (low, U.S. average is 100)
Land area: 37.6 sq. mi. Water area: 0.5 sq. mi.
Population density: 35 people per square mile
(very low).
OSM Map
General Map
Google Map
MSN Map
OSM Map
General Map
Google Map
MSN Map
OSM Map
General Map
Google Map
MSN Map
OSM Map
General Map
Google Map
MSN Map
Please wait while loading the map...
Real estate property taxes paid for housing units in 2022:
This zip code:
0.7% ($1,605)
Missouri:
0.8% ($1,810)
Median real estate property taxes paid for housing units with mortgages in 2022: $1,673 (0.7%) Median real estate property taxes paid for housing units with no mortgage in 2022: $1,371 (0.7%)
Estimated median house/condo value in 2022: $240,280
64401:
$240,280
Missouri:
$221,200
According to our research of Missouri and other state lists, there were 3 registered sex offenders living in 64401 zip code as of May 28, 2024. The ratio of all residents to sex offenders in zip code 64401 is 589 to 1. The ratio of registered sex offenders to all residents in this zip code is lower than the state average.
Median resident age:
This zip code:
44.6 years
Missouri median age:
39.1 years
Average household size:
This zip code:
2.6 people
Missouri:
2.4 people
Averages for the 2020 tax year for zip code 64401, filed in 2021:
Average Adjusted Gross Income (AGI) in 2020: $74,445 (Individual Income Tax Returns)
Here:
$74,445
State:
$68,151
Salary/wage: $63,495 (reported on 84.1% of returns)
Here:
$63,495
State:
$56,131
(% of AGI for various income ranges: 1272.3% for AGIs below $25k, 3470.0% for AGIs $25k-50k, 6666.7% for AGIs $50k-75k, 9111.7% for AGIs $75k-100k, 12817.5% for AGIs $100k-200k)
Taxable interest for individuals: $522 (reported on 33.3% of returns)
This zip code:
$522
Missouri:
$1,586
(% of AGI for various income ranges: 6.9% for AGIs below $25k, 13.3% for AGIs $25k-50k, 16.7% for AGIs $50k-75k, 50.0% for AGIs $75k-100k, 41.7% for AGIs $100k-200k)
Ordinary dividends: $3,256 (reported on 13.0% of returns)
Here:
$3,256
State:
$10,947
(% of AGI for various income ranges: 190.0% for AGIs $50k-75k, 101.7% for AGIs $100k-200k)
Net capital gain/loss in AGI: +$5,922 (reported on 13.0% of returns)
Here:
+$5,922
State:
+$18,453
(% of AGI for various income ranges: 90.0% for AGIs $25k-50k, 133.3% for AGIs $75k-100k, 287.5% for AGIs $100k-200k)
Profit/loss from business: +$4,391 (reported on 15.9% of returns)
Here:
+$4,391
State:
+$12,260
(% of AGI for various income ranges: 106.2% for AGIs below $25k, 274.2% for AGIs $25k-50k, 44.4% for AGIs $50k-75k)
Taxable individual retirement arrangement distribution: $17,500 (reported on 8.7% of returns)
64401:
$17,500
Missouri:
$19,719
(% of AGI for various income ranges: 304.2% for AGIs $25k-50k, 570.8% for AGIs $100k-200k)
Total itemized deductions: $36,100 (reported on 4.3% of returns)
Here:
$36,100
State:
$36,651
(% of AGI for various income ranges: 902.5% for AGIs $100k-200k)
Charity contributions: $10,350 (reported on 2.9% of returns)
Here:
$10,350
State:
$15,671
(% of AGI for various income ranges: 230.0% for AGIs $50k-75k)
Taxes paid: $7,700 (reported on 4.3% of returns)
64401:
$7,700
State:
$7,608
(% of AGI for various income ranges: 192.5% for AGIs $100k-200k)
Earned income credit: $2,100 (reported on 10.1% of returns)
Here:
$2,100
State:
$2,315
(% of AGI for various income ranges: 63.1% for AGIs below $25k, 54.2% for AGIs $25k-50k)
Percentage of individuals using paid preparers for their 2020 taxes: 97.1%
Here:
97%
State:
93%
(% for various income ranges: 94.1% for AGIs below $25k, 93.3% for AGIs $25k-50k, 100.0% for AGIs $50k-75k, 100.0% for AGIs $75k-100k, 100.0% for AGIs $100k-200k, 100.0% for AGIs over 200k)
Averages for the 2012 tax year for zip code 64401, filed in 2013:
Average Adjusted Gross Income (AGI) in 2012: $62,577 (Individual Income Tax Returns)
Here:
$62,577
State:
$55,896
Salary/wage: $51,043 (reported on 87.0% of returns)
Here:
$51,043
State:
$46,205
(% of AGI for various income ranges: 68.1% for AGIs below $25k, 80.2% for AGIs $25k-50k, 79.4% for AGIs $50k-75k, 83.8% for AGIs $75k-100k, 59.4% for AGIs $100k-200k)
Taxable interest for individuals: $788 (reported on 37.7% of returns)
This zip code:
$788
Missouri:
$1,559
(% of AGI for various income ranges: 0.8% for AGIs below $25k, 0.6% for AGIs $25k-50k, 0.4% for AGIs $50k-75k, 0.1% for AGIs $75k-100k, 0.6% for AGIs $100k-200k)
Ordinary dividends: $2,942 (reported on 17.4% of returns)
Here:
$2,942
State:
$7,410
(% of AGI for various income ranges: 2.3% for AGIs $25k-50k, 0.2% for AGIs $75k-100k, 1.2% for AGIs $100k-200k)
Net capital gain/loss in AGI: +$1,856 (reported on 13.0% of returns)
Here:
+$1,856
State:
+$11,579
(% of AGI for various income ranges: 1.6% for AGIs $25k-50k, 0.4% for AGIs $100k-200k)
Profit/loss from business: +$4,410 (reported on 14.5% of returns)
Here:
+$4,410
State:
+$11,688
(% of AGI for various income ranges: 5.6% for AGIs $25k-50k, 1.3% for AGIs $50k-75k, 0.3% for AGIs $100k-200k)
Taxable individual retirement arrangement distribution: $9,380 (reported on 7.2% of returns)
64401:
$9,380
Missouri:
$14,773
Total itemized deductions: $20,100 (18% of AGI, reported on 33.3% of returns)
Here:
$20,100
State:
$22,730
Here:
18.2% of AGI
State:
19.2% of AGI
(% of AGI for various income ranges: 10.9% for AGIs $25k-50k, 11.3% for AGIs $50k-75k, 9.5% for AGIs $75k-100k, 12.5% for AGIs $100k-200k)
Charity contributions: $3,706 (reported on 23.2% of returns)
Here:
$3,706
State:
$4,745
(% of AGI for various income ranges: 1.8% for AGIs below $25k, 1.4% for AGIs $50k-75k, 1.1% for AGIs $75k-100k, 1.8% for AGIs $100k-200k)
Taxes paid: $6,909 (reported on 33.3% of returns)
64401:
$6,909
State:
$8,399
(% of AGI for various income ranges: 2.0% for AGIs $25k-50k, 2.7% for AGIs $50k-75k, 3.3% for AGIs $75k-100k, 5.2% for AGIs $100k-200k)
Earned income credit: $2,014 (reported on 10.1% of returns)
Here:
$2,014
State:
$2,288
(% of AGI for various income ranges: 3.7% for AGIs below $25k, 1.0% for AGIs $25k-50k)
Percentage of individuals using paid preparers for their 2012 taxes: 62.3%
Here:
62%
State:
55%
(% for various income ranges: 52.2% for AGIs below $25k, 69.2% for AGIs $25k-50k, 66.7% for AGIs $50k-75k, 70.0% for AGIs $75k-100k, 63.6% for AGIs $100k-200k)
Averages for the 2004 tax year for zip code 64401, filed in 2005:
Average Adjusted Gross Income (AGI) in 2004: $40,553 (Individual Income Tax Returns)
Here:
$40,553
State:
$44,591
Salary/wage: $39,747 (reported on 86.3% of returns)
Here:
$39,747
State:
$38,941
(% of AGI for various income ranges: 96.6% for AGIs below $10k, 72.8% for AGIs $10k-25k, 86.3% for AGIs $25k-50k, 87.0% for AGIs $50k-75k, 85.5% for AGIs $75k-100k, 81.6% for AGIs over 100k)
Taxable interest for individuals: $803 (reported on 45.0% of returns)
This zip code:
$803
Missouri:
$1,801
(% of AGI for various income ranges: 10.7% for AGIs below $10k, 2.4% for AGIs $10k-25k, 0.7% for AGIs $25k-50k, 0.5% for AGIs $50k-75k, 0.4% for AGIs $75k-100k, 0.4% for AGIs over 100k)
Taxable dividends: $456 (reported on 17.4% of returns)
Here:
$456
State:
$3,677
(% of AGI for various income ranges: 0.7% for AGIs below $10k, 0.1% for AGIs $10k-25k, 0.1% for AGIs $25k-50k, 0.2% for AGIs $50k-75k, 0.3% for AGIs $75k-100k, 0.1% for AGIs over 100k)
Net capital gain/loss: +$969 (reported on 14.8% of returns)
Here:
+$969
State:
+$8,915
(% of AGI for various income ranges: -1.6% for AGIs below $10k, -0.1% for AGIs $10k-25k, 0.9% for AGIs $25k-50k, 0.2% for AGIs $50k-75k, 0.2% for AGIs $75k-100k, 0.5% for AGIs over 100k)
Profit/loss from business: +$4,782 (reported on 13.3% of returns)
Here:
+$4,782
State:
+$9,793
(% of AGI for various income ranges: 15.1% for AGIs below $10k, 4.1% for AGIs $10k-25k, 2.8% for AGIs $25k-50k, 1.3% for AGIs $50k-75k, -0.2% for AGIs $75k-100k)
Total itemized deductions: $14,644 (21% of AGI, reported on 30.8% of returns)
Here:
$14,644
State:
$18,261
Here:
21.2% of AGI
State:
20.5% of AGI
(% of AGI for various income ranges: 7.8% for AGIs $10k-25k, 8.5% for AGIs $25k-50k, 11.8% for AGIs $50k-75k, 12.9% for AGIs $75k-100k, 13.8% for AGIs over 100k)
Charity contributions deductions: $2,147 (3% of AGI, reported on 23.8% of returns)
Here:
$2,147
State:
$3,665
Here:
2.9% of AGI
State:
3.9% of AGI
(% of AGI for various income ranges: 2.5% for AGIs below $10k, 0.7% for AGIs $25k-50k, 1.6% for AGIs $50k-75k, 1.4% for AGIs $75k-100k, 1.8% for AGIs over 100k)
Total tax: $4,548 (reported on 79.6% of returns)
64401:
$4,548
State:
$6,999
(% of AGI for various income ranges: 4.5% for AGIs below $10k, 4.4% for AGIs $10k-25k, 6.5% for AGIs $25k-50k, 8.4% for AGIs $50k-75k, 10.1% for AGIs $75k-100k, 14.1% for AGIs over 100k)
Earned income credit: $1,439 (reported on 10.1% of returns)
Here:
$1,439
State:
$1,728
Percentage of individuals using paid preparers for their 2004 taxes: 69.4%
Here:
69%
State:
62%
(% for various income ranges: 63.8% for AGIs below $10k, 74.1% for AGIs $10k-25k, 68.4% for AGIs $25k-50k, 70.4% for AGIs $50k-75k, 67.5% for AGIs $75k-100k, 77.8% for AGIs over 100k)
Likely homosexual households (counted as self-reported same-sex unmarried-partner households)
Lesbian couples: 0.0% of all households
Gay men: 0.4% of all households
Household received Food Stamps/SNAP in the past 12 months: 16 Household did not receive Food Stamps/SNAP in the past 12 months: 477
Women who had a birth in the past 12 months: 2 (2 now married, 0 unmarried) Women who did not have a birth in the past 12 months: 300 (180 now married, 117 unmarried)
Housing units in zip code 64401 with a mortgage: 330 (10 second mortgage, 4 both second mortgage and home equity loan) Median monthly owner costs for units with a mortgage: $1,388 Median monthly owner costs for units without a mortgage: $529
Residents with income below the poverty level in 2022:
This zip code:
1.3%
Whole state:
13.2%
Residents with income below 50% of the poverty level in 2022:
This zip code:
0.8%
Whole state:
6.8%
Median number of rooms in houses and condos:
Here:
6.6
State:
6.4
Median number of rooms in apartments:
Here:
2.0
State:
4.4
Notable locations in this zip code not listed on our city pages
Reservoirs: Grant Lake (A), Little Ozark Fishing Lake (B), Cantrell Lake (C), McPheeters Lake (D), Ussary Lake (E), Komer Lake (F), Lake Flamingo (G), Clarence Jones East Lake (H). Display/hide their locations on the map
Size of family households: 184 2-persons, 111 3-persons, 37 4-persons, 61 5-persons, 2 6-persons, 5 7-or-more-persons
Size of nonfamily households: 63 1-person, 28 2-persons
238 married couples with children.
24 single-parent households (10 men, 14 women).
99.0% of residents of 64401 zip code speak English at home.
0.7% of residents speak Spanish at home (22% very well, 78% well).
Foreign born population: 9 (0.8%) (100.0% of them are naturalized citizens)
This zip code:
0.8%
Whole state:
4.1%
67%Honduras
22%Azores Islands
21%American
18%German
11%English
9%Irish
3%Polish
3%European
3%Eastern European
Year of entry for the foreign-born population
02010 or later
02000 to 2009
01990 to 1999
11Before 1990
Facilities with environmental interests located in this zip code:
EVERETT QUARRIES #54 (9020 SE LOUTHERMILCH RD in AGENCY, MO)
AIR MINOR (AIRS/AFS) STATE MASTER (Missouri monitoring and compilance) - NET-290210072, AIR PROGRAM, AIRS/AFS-MO0058740, AIR MINOR, PCS-MOG490001, NPDES NON-MAJOR National Pollutant Discharge Elimination System NON-MAJOR (Tracking pollutant discharge elimination systems) - permit Business SIC classification: CRUSHED AND BROKEN LIMESTONE Organizations: EVERETT QUARRIES CO INC (CONTACT/OWNER)
, EVERETT QUARRIES CO (CONTACT/OWNER)
Alternative names: EVERETT QUARRIES CO INC, OAK KNOLL APARTMENTS
RALPH & MARY GREER (4550 SE STATE ROAD H in AGENCY, MO)
STATE MASTER (Missouri monitoring and compilance) - PCS-MO0118991, NPDES NON-MAJOR National Pollutant Discharge Elimination System NON-MAJOR (Tracking pollutant discharge elimination systems) - permit Business SIC classification: OPERATORS OF RESIDENTIAL MOBILE HOME SITES Alternative names: KEITH & MELISSA MORAN, WHISPERING PINE MHP
Housing units lacking complete plumbing facilities: 4.2%
72.3%Electricity
21.1%Bottled, tank, or LP gas
5.2%Wood
1.9%Utility gas
Population in 1990: 1,773.
Place of birth for U.S.-born residents:
This state: 1,078
Northeast: 3
Midwest: 117
South: 61
West: 28
68% of the 64401 zip code residents lived in the same house 5 years ago. Out of people who lived in different houses, 64% lived in this county. Out of people who lived in different counties, 50% lived in Missouri.
97% of the 64401 zip code residents lived in the same house 1 year ago. Out of people who lived in different houses, 57% moved from this county. Out of people who lived in different houses, 53% moved from different county within same state.
Private vs. public school enrollment:
Students in private schools in grades 1 to 8 (elementary and middle school): 1
Here:
0.7%
Missouri:
15.4%
Students in private schools in grades 9 to 12 (high school):
Here:
0.0%
Missouri:
13.9%
Students in private undergraduate colleges:
Here:
0.0%
Missouri:
22.6%
Occupation by median earnings in the past 12 months ($)
97,505Computer and mathematical occupations
80,423Business and financial operations occupations
78,545Architecture and engineering occupations
73,024Production occupations
70,305Construction and extraction occupations
51,986Management occupations
Companies with federal contracts located in this zip code:
DELORES W HODGSON (6800 PRESCHER ROAD in AGENCY, MO; small business) : $76,316 in 13 contractsfrom 2002 to 2006
Contracts for Custodial Janitorial Services, Facilities Operations Support Services, Landscaping/Groundskeeping Services by Army, U.S. Army Corps of Engineers - civil program financing only Signed by year:2000: $0; 2001: $0; 2002: $26,448; 2003: $25,245; 2004: $0; 2005: $0; 2006: $24,623.
Biggest contracts:
$10,282 with Army for Custodial Janitorial Services. Taking place in WI. Signed on 2006-03-14. Completion date: 2006-01-18.
$9,968 with U.S. Army Corps of Engineers - civil program financing only for Custodial Janitorial Services. Taking place in WI. Signed on 2003-01-08. Completion date: 2003-03-31.
$9,968, same as above.Signed on 2002-03-11. Completion date: 2003-03-31.
$9,565 with U.S. Army Corps of Engineers - civil program financing only for Facilities Operations Support Services. Taking place in WI. Signed on 2003-01-08. Completion date: 2003-03-31.
Top industries in this zip code by the number of employees in 2005:
Accommodation and Food Services: Limited-Service Restaurants (10-19 employees: 1 establishment)
Health Care and Social Assistance: Residential Mental Health and Substance Abuse Facilities (10-19: 1)
Construction: Site Preparation Contractors (5-9: 1, 1-4: 2)
Construction: New Single-Family Housing Construction (except Operative Builders) (1-4: 2)
Construction: Other Heavy and Civil Engineering Construction (1-4: 1)
Construction: All Other Specialty Trade Contractors (1-4: 1)
Other Services (except Public Administration): General Automotive Repair (1-4: 1)
Administrative and Support and Waste Management and Remediation Services: Exterminating and Pest Control Services (1-4: 1)
Fatal accident statistics in 2014:
Fatal accident count: 1
Vehicles involved in fatal accidents: 2
Fatal accidents caused by drunken drivers: 0
Fatalities: 1
Persons involved in fatal accidents: 2
Pedestrians involved in fatal accidents: 0
Home Mortgage Disclosure Act Aggregated Statistics For Year 2009 (Based on 4 partial tracts)
A) FHA, FSA/RHS & VA Home Purchase Loans
B) Conventional Home Purchase Loans
C) Refinancings
D) Home Improvement Loans
F) Non-occupant Loans on < 5 Family Dwellings (A B C & D)
G) Loans On Manufactured Home Dwelling (A B C & D)
Number
Average Value
Number
Average Value
Number
Average Value
Number
Average Value
Number
Average Value
Number
Average Value
LOANS ORIGINATED
6
$162,588
12
$147,274
65
$163,050
5
$49,500
4
$121,322
1
$59,500
APPLICATIONS APPROVED, NOT ACCEPTED
1
$116,360
2
$105,525
5
$175,206
1
$35,660
0
$0
1
$40,660
APPLICATIONS DENIED
3
$88,970
1
$134,830
19
$136,124
3
$18,040
0
$0
1
$57,780
APPLICATIONS WITHDRAWN
1
$105,410
1
$88,610
17
$172,803
1
$66,000
1
$65,060
1
$52,550
FILES CLOSED FOR INCOMPLETENESS
0
$0
0
$0
2
$152,585
0
$0
0
$0
0
$0
Aggregated Statistics For Year 2008 (Based on 4 partial tracts)
A) FHA, FSA/RHS & VA Home Purchase Loans
B) Conventional Home Purchase Loans
C) Refinancings
D) Home Improvement Loans
F) Non-occupant Loans on < 5 Family Dwellings (A B C & D)
G) Loans On Manufactured Home Dwelling (A B C & D)
Number
Average Value
Number
Average Value
Number
Average Value
Number
Average Value
Number
Average Value
Number
Average Value
LOANS ORIGINATED
4
$150,122
12
$171,493
47
$136,826
8
$70,294
3
$118,433
2
$71,610
APPLICATIONS APPROVED, NOT ACCEPTED
0
$0
1
$101,660
7
$199,796
1
$21,320
0
$0
0
$0
APPLICATIONS DENIED
1
$116,360
3
$157,140
26
$164,140
7
$32,667
1
$27,670
4
$73,250
APPLICATIONS WITHDRAWN
1
$102,910
1
$279,020
7
$203,407
1
$38,400
0
$0
0
$0
FILES CLOSED FOR INCOMPLETENESS
0
$0
1
$169,920
5
$128,596
1
$58,490
0
$0
0
$0
Aggregated Statistics For Year 2007 (Based on 4 partial tracts)
A) FHA, FSA/RHS & VA Home Purchase Loans
B) Conventional Home Purchase Loans
C) Refinancings
D) Home Improvement Loans
F) Non-occupant Loans on < 5 Family Dwellings (A B C & D)
G) Loans On Manufactured Home Dwelling (A B C & D)
Number
Average Value
Number
Average Value
Number
Average Value
Number
Average Value
Number
Average Value
Number
Average Value
LOANS ORIGINATED
2
$115,425
24
$132,765
44
$137,293
12
$34,808
7
$124,020
5
$67,692
APPLICATIONS APPROVED, NOT ACCEPTED
0
$0
3
$124,247
12
$130,295
0
$0
0
$0
1
$22,210
APPLICATIONS DENIED
1
$93,210
6
$151,543
29
$136,999
4
$79,398
1
$201,760
3
$78,410
APPLICATIONS WITHDRAWN
0
$0
2
$119,020
12
$127,802
1
$157,650
1
$123,870
1
$59,430
FILES CLOSED FOR INCOMPLETENESS
0
$0
1
$91,650
6
$160,118
0
$0
0
$0
0
$0
Aggregated Statistics For Year 2006 (Based on 4 partial tracts)
A) FHA, FSA/RHS & VA Home Purchase Loans
B) Conventional Home Purchase Loans
C) Refinancings
D) Home Improvement Loans
F) Non-occupant Loans on < 5 Family Dwellings (A B C & D)
G) Loans On Manufactured Home Dwelling (A B C & D)
Number
Average Value
Number
Average Value
Number
Average Value
Number
Average Value
Number
Average Value
Number
Average Value
LOANS ORIGINATED
2
$118,230
26
$138,449
45
$142,042
9
$64,883
3
$121,430
5
$65,532
APPLICATIONS APPROVED, NOT ACCEPTED
1
$70,690
4
$118,750
8
$157,769
2
$22,050
0
$0
2
$75,580
APPLICATIONS DENIED
2
$88,825
10
$93,336
27
$148,552
8
$73,562
2
$123,555
4
$74,658
APPLICATIONS WITHDRAWN
1
$51,610
4
$144,172
16
$146,860
2
$142,480
0
$0
1
$87,910
FILES CLOSED FOR INCOMPLETENESS
0
$0
2
$78,535
4
$130,360
0
$0
0
$0
0
$0
Aggregated Statistics For Year 2005 (Based on 4 partial tracts)
A) FHA, FSA/RHS & VA Home Purchase Loans
B) Conventional Home Purchase Loans
C) Refinancings
D) Home Improvement Loans
F) Non-occupant Loans on < 5 Family Dwellings (A B C & D)
G) Loans On Manufactured Home Dwelling (A B C & D)
Number
Average Value
Number
Average Value
Number
Average Value
Number
Average Value
Number
Average Value
Number
Average Value
LOANS ORIGINATED
1
$95,400
31
$130,186
65
$123,852
10
$36,670
4
$99,965
4
$70,545
APPLICATIONS APPROVED, NOT ACCEPTED
0
$0
6
$92,368
8
$98,224
1
$30,030
1
$78,200
1
$86,920
APPLICATIONS DENIED
1
$88,520
8
$97,868
38
$108,088
7
$30,046
1
$61,310
6
$67,958
APPLICATIONS WITHDRAWN
0
$0
3
$122,927
29
$119,281
3
$83,680
1
$78,830
2
$60,370
FILES CLOSED FOR INCOMPLETENESS
0
$0
0
$0
4
$147,340
0
$0
0
$0
0
$0
Aggregated Statistics For Year 2004 (Based on 4 partial tracts)
A) FHA, FSA/RHS & VA Home Purchase Loans
B) Conventional Home Purchase Loans
C) Refinancings
D) Home Improvement Loans
F) Non-occupant Loans on < 5 Family Dwellings (A B C & D)
G) Loans On Manufactured Home Dwelling (A B C & D)
Number
Average Value
Number
Average Value
Number
Average Value
Number
Average Value
Number
Average Value
Number
Average Value
LOANS ORIGINATED
3
$147,650
20
$126,176
65
$117,372
8
$52,492
5
$78,278
7
$51,490
APPLICATIONS APPROVED, NOT ACCEPTED
0
$0
4
$133,132
10
$102,064
2
$47,135
1
$98,130
0
$0
APPLICATIONS DENIED
1
$109,440
9
$100,843
36
$96,708
5
$27,230
0
$0
4
$67,102
APPLICATIONS WITHDRAWN
0
$0
1
$129,920
27
$109,311
1
$92,590
1
$29,400
1
$95,380
FILES CLOSED FOR INCOMPLETENESS
0
$0
1
$139,860
6
$119,282
0
$0
0
$0
0
$0
Aggregated Statistics For Year 2003 (Based on 4 partial tracts)
A) FHA, FSA/RHS & VA Home Purchase Loans
B) Conventional Home Purchase Loans
C) Refinancings
D) Home Improvement Loans
F) Non-occupant Loans on < 5 Family Dwellings (A B C & D)
Number
Average Value
Number
Average Value
Number
Average Value
Number
Average Value
Number
Average Value
LOANS ORIGINATED
4
$111,705
23
$119,845
130
$113,512
6
$24,118
5
$95,370
APPLICATIONS APPROVED, NOT ACCEPTED
0
$0
2
$197,150
11
$105,579
1
$22,670
0
$0
APPLICATIONS DENIED
1
$63,500
6
$80,853
40
$105,237
4
$22,992
1
$64,440
APPLICATIONS WITHDRAWN
0
$0
4
$97,470
27
$104,069
1
$9,070
0
$0
FILES CLOSED FOR INCOMPLETENESS
0
$0
1
$101,030
7
$104,663
0
$0
0
$0
Aggregated Statistics For Year 2002 (Based on 4 partial tracts)
A) FHA, FSA/RHS & VA Home Purchase Loans
B) Conventional Home Purchase Loans
C) Refinancings
D) Home Improvement Loans
E) Loans on Dwellings For 5+ Families
F) Non-occupant Loans on < 5 Family Dwellings (A B C & D)
Number
Average Value
Number
Average Value
Number
Average Value
Number
Average Value
Number
Average Value
Number
Average Value
LOANS ORIGINATED
3
$115,843
14
$104,459
85
$105,817
9
$18,110
2
$311,195
3
$58,257
APPLICATIONS APPROVED, NOT ACCEPTED
0
$0
5
$121,322
14
$100,839
1
$18,770
0
$0
0
$0
APPLICATIONS DENIED
1
$44,570
4
$97,842
31
$99,820
2
$12,045
0
$0
0
$0
APPLICATIONS WITHDRAWN
0
$0
1
$113,440
15
$107,747
1
$26,610
0
$0
0
$0
FILES CLOSED FOR INCOMPLETENESS
0
$0
1
$199,510
8
$116,574
0
$0
0
$0
0
$0
Aggregated Statistics For Year 2001 (Based on 4 partial tracts)
A) FHA, FSA/RHS & VA Home Purchase Loans
B) Conventional Home Purchase Loans
C) Refinancings
D) Home Improvement Loans
F) Non-occupant Loans on < 5 Family Dwellings (A B C & D)
Number
Average Value
Number
Average Value
Number
Average Value
Number
Average Value
Number
Average Value
LOANS ORIGINATED
2
$82,685
13
$118,134
72
$99,298
11
$40,758
3
$123,557
APPLICATIONS APPROVED, NOT ACCEPTED
0
$0
2
$91,405
9
$95,332
1
$51,680
0
$0
APPLICATIONS DENIED
0
$0
14
$63,079
26
$83,238
3
$43,433
0
$0
APPLICATIONS WITHDRAWN
0
$0
2
$54,535
15
$88,631
1
$77,340
0
$0
FILES CLOSED FOR INCOMPLETENESS
0
$0
0
$0
6
$104,543
0
$0
0
$0
Aggregated Statistics For Year 2000 (Based on 4 partial tracts)
A) FHA, FSA/RHS & VA Home Purchase Loans
B) Conventional Home Purchase Loans
C) Refinancings
D) Home Improvement Loans
F) Non-occupant Loans on < 5 Family Dwellings (A B C & D)
Number
Average Value
Number
Average Value
Number
Average Value
Number
Average Value
Number
Average Value
LOANS ORIGINATED
3
$94,387
14
$77,115
31
$88,056
11
$26,193
3
$102,297
APPLICATIONS APPROVED, NOT ACCEPTED
0
$0
3
$78,120
6
$68,542
1
$8,760
0
$0
APPLICATIONS DENIED
1
$51,610
12
$50,806
10
$66,561
5
$14,418
0
$0
APPLICATIONS WITHDRAWN
0
$0
2
$90,570
8
$56,680
2
$30,390
0
$0
FILES CLOSED FOR INCOMPLETENESS
0
$0
1
$99,760
2
$62,730
0
$0
0
$0
Aggregated Statistics For Year 1999 (Based on 2 partial tracts)
A) FHA, FSA/RHS & VA Home Purchase Loans
B) Conventional Home Purchase Loans
C) Refinancings
D) Home Improvement Loans
F) Non-occupant Loans on < 5 Family Dwellings (A B C & D)
Detailed PMIC statistics for the following Tracts:0027.00
, 0028.00
2002 - 2018 National Fire Incident Reporting System (NFIRS) incidents
According to the data from the years 2002 - 2018 the average number of fire incidents per year is 12. The highest number of reported fire incidents - 21 took place in 2015, and the least - 5 in 2004. The data has a rising trend.
When looking into fire subcategories, the most incidents belonged to: Outside Fires (54.1%), and Structure Fires (24.9%).
Fire incident types reported to NFIRS in Zip Code 64401

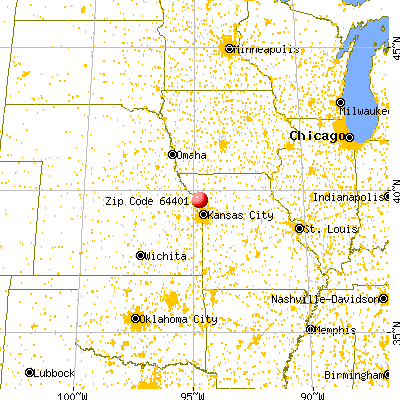


 Nearest zip codes: 64507, 64448, 64439, 64443, 64454, 64444.


 According to the data from the years 2002 - 2018 the average number of fire incidents per year is 12. The highest number of reported fire incidents - 21 took place in 2015, and the least - 5 in 2004. The data has a rising trend.
 When looking into fire subcategories, the most incidents belonged to: Outside Fires (54.1%), and Structure Fires (24.9%).