Estimated zip code population in 2022: 2,075 Zip code population in 2010: 2,339 Zip code population in 2000: 2,177
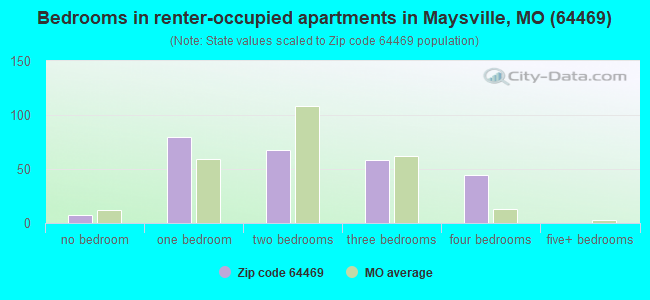
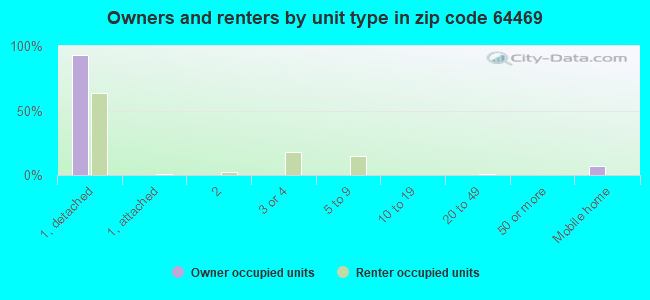
Houses and condos: 915 Renter-occupied apartments: 258
% of renters here:
32%
State:
32%
March 2022 cost of living index in zip code 64469: 75.7 (low, U.S. average is 100)
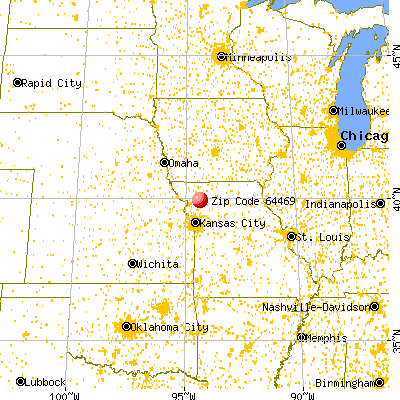
Land area: 121.9 sq. mi. Water area: 1.1 sq. mi.
Population density: 17 people per square mile
(very low).
OSM Map
General Map
Google Map
MSN Map
OSM Map
General Map
Google Map
MSN Map
OSM Map
General Map
Google Map
MSN Map
OSM Map
General Map
Google Map
MSN Map
Please wait while loading the map...
Real estate property taxes paid for housing units in 2022:
This zip code:
1.0% ($1,357)
Missouri:
0.8% ($1,810)
Median real estate property taxes paid for housing units with mortgages in 2022: $1,562 (0.8%) Median real estate property taxes paid for housing units with no mortgage in 2022: $1,137 (1.0%)
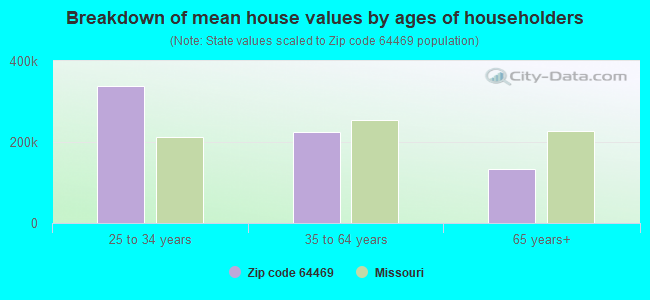
Estimated median house/condo value in 2022: $131,234
64469:
$131,234
Missouri:
$221,200
According to our research of Missouri and other state lists, there were 2 registered sex offenders living in 64469 zip code as of May 28, 2024. The ratio of all residents to sex offenders in zip code 64469 is 1,132 to 1. The ratio of registered sex offenders to all residents in this zip code is much lower than the state average.
Median resident age:
This zip code:
40.0 years
Missouri median age:
39.1 years
Average household size:
This zip code:
2.5 people
Missouri:
2.4 people
Averages for the 2020 tax year for zip code 64469, filed in 2021:
Average Adjusted Gross Income (AGI) in 2020: $52,158 (Individual Income Tax Returns)
Here:
$52,158
State:
$68,151
Salary/wage: $47,790 (reported on 80.4% of returns)
Here:
$47,790
State:
$56,131
(% of AGI for various income ranges: 1257.8% for AGIs below $25k, 4003.5% for AGIs $25k-50k, 6414.5% for AGIs $50k-75k, 9597.1% for AGIs $75k-100k, 18002.9% for AGIs $100k-200k)
Taxable interest for individuals: $1,354 (reported on 36.1% of returns)
This zip code:
$1,354
Missouri:
$1,586
(% of AGI for various income ranges: 36.5% for AGIs below $25k, 26.5% for AGIs $25k-50k, 37.3% for AGIs $50k-75k, 85.7% for AGIs $75k-100k, 337.1% for AGIs $100k-200k)
Ordinary dividends: $6,260 (reported on 15.5% of returns)
Here:
$6,260
State:
$10,947
(% of AGI for various income ranges: 27.8% for AGIs below $25k, 22.0% for AGIs $25k-50k, 40.9% for AGIs $50k-75k, 37.1% for AGIs $75k-100k, 1085.7% for AGIs $100k-200k)
Net capital gain/loss in AGI: +$4,841 (reported on 17.5% of returns)
Here:
+$4,841
State:
+$18,453
(% of AGI for various income ranges: 72.6% for AGIs below $25k, 35.5% for AGIs $25k-50k, 70.0% for AGIs $50k-75k, 181.4% for AGIs $75k-100k, 544.3% for AGIs $100k-200k)
Profit/loss from business: +$7,171 (reported on 17.5% of returns)
Here:
+$7,171
State:
+$12,260
(% of AGI for various income ranges: 241.7% for AGIs below $25k, 147.5% for AGIs $25k-50k, 176.4% for AGIs $50k-75k, 70.0% for AGIs $75k-100k, 178.6% for AGIs $100k-200k)
Taxable individual retirement arrangement distribution: $17,838 (reported on 8.2% of returns)
64469:
$17,838
Missouri:
$19,719
(% of AGI for various income ranges: 209.5% for AGIs $25k-50k, 1440.0% for AGIs $75k-100k)
Total itemized deductions: $29,667 (reported on 3.1% of returns)
Here:
$29,667
State:
$36,651
(% of AGI for various income ranges: 1271.4% for AGIs $75k-100k)
Taxes paid: $5,233 (reported on 3.1% of returns)
64469:
$5,233
State:
$7,608
(% of AGI for various income ranges: 224.3% for AGIs $75k-100k)
Earned income credit: $2,462 (reported on 16.5% of returns)
Here:
$2,462
State:
$2,315
(% of AGI for various income ranges: 109.1% for AGIs below $25k, 71.5% for AGIs $25k-50k)
Percentage of individuals using paid preparers for their 2020 taxes: 94.8%
Here:
95%
State:
93%
(% for various income ranges: 90.9% for AGIs below $25k, 96.2% for AGIs $25k-50k, 93.3% for AGIs $50k-75k, 100.0% for AGIs $75k-100k, 100.0% for AGIs $100k-200k)
Averages for the 2012 tax year for zip code 64469, filed in 2013:
Average Adjusted Gross Income (AGI) in 2012: $45,473 (Individual Income Tax Returns)
Here:
$45,473
State:
$55,896
Salary/wage: $41,997 (reported on 80.9% of returns)
Here:
$41,997
State:
$46,205
(% of AGI for various income ranges: 70.3% for AGIs below $25k, 88.5% for AGIs $25k-50k, 77.2% for AGIs $50k-75k, 82.5% for AGIs $75k-100k, 59.6% for AGIs $100k-200k)
Taxable interest for individuals: $915 (reported on 38.2% of returns)
This zip code:
$915
Missouri:
$1,559
(% of AGI for various income ranges: 2.7% for AGIs below $25k, 0.5% for AGIs $25k-50k, 0.7% for AGIs $50k-75k, 0.6% for AGIs $75k-100k, 0.5% for AGIs $100k-200k)
Ordinary dividends: $3,407 (reported on 15.7% of returns)
Here:
$3,407
State:
$7,410
(% of AGI for various income ranges: 1.0% for AGIs below $25k, 0.5% for AGIs $25k-50k, 1.7% for AGIs $50k-75k, 2.0% for AGIs $100k-200k)
Net capital gain/loss in AGI: +$6,513 (reported on 16.9% of returns)
Here:
+$6,513
State:
+$11,579
(% of AGI for various income ranges: 2.3% for AGIs below $25k, 1.8% for AGIs $25k-50k, 3.5% for AGIs $50k-75k, 3.4% for AGIs $100k-200k)
Profit/loss from business: +$4,613 (reported on 16.9% of returns)
Here:
+$4,613
State:
+$11,688
(% of AGI for various income ranges: 5.7% for AGIs below $25k, 2.1% for AGIs $25k-50k, 3.0% for AGIs $50k-75k, 0.2% for AGIs $75k-100k)
Taxable individual retirement arrangement distribution: $7,289 (reported on 10.1% of returns)
64469:
$7,289
Missouri:
$14,773
(% of AGI for various income ranges: 4.5% for AGIs below $25k, 2.1% for AGIs $25k-50k, 3.2% for AGIs $50k-75k)
Total itemized deductions: $20,042 (22% of AGI, reported on 21.3% of returns)
Here:
$20,042
State:
$22,730
Here:
21.7% of AGI
State:
19.2% of AGI
(% of AGI for various income ranges: 9.7% for AGIs below $25k, 7.8% for AGIs $25k-50k, 7.4% for AGIs $50k-75k, 9.7% for AGIs $75k-100k, 11.9% for AGIs $100k-200k)
Charity contributions: $4,850 (reported on 15.7% of returns)
Here:
$4,850
State:
$4,745
(% of AGI for various income ranges: 1.1% for AGIs $25k-50k, 1.0% for AGIs $50k-75k, 1.8% for AGIs $75k-100k, 3.1% for AGIs $100k-200k)
Taxes paid: $6,095 (reported on 21.3% of returns)
64469:
$6,095
State:
$8,399
(% of AGI for various income ranges: 1.0% for AGIs below $25k, 1.2% for AGIs $25k-50k, 1.7% for AGIs $50k-75k, 2.6% for AGIs $75k-100k, 5.8% for AGIs $100k-200k)
Earned income credit: $2,161 (reported on 20.2% of returns)
Here:
$2,161
State:
$2,288
(% of AGI for various income ranges: 6.3% for AGIs below $25k, 1.7% for AGIs $25k-50k)
Percentage of individuals using paid preparers for their 2012 taxes: 73.0%
Here:
73%
State:
55%
(% for various income ranges: 69.7% for AGIs below $25k, 72.0% for AGIs $25k-50k, 80.0% for AGIs $50k-75k, 75.0% for AGIs $75k-100k, 75.0% for AGIs $100k-200k)
Averages for the 2004 tax year for zip code 64469, filed in 2005:
Average Adjusted Gross Income (AGI) in 2004: $33,204 (Individual Income Tax Returns)
Here:
$33,204
State:
$44,591
Salary/wage: $32,305 (reported on 82.7% of returns)
Here:
$32,305
State:
$38,941
(% of AGI for various income ranges: 134.1% for AGIs below $10k, 73.8% for AGIs $10k-25k, 91.6% for AGIs $25k-50k, 82.5% for AGIs $50k-75k, 77.1% for AGIs $75k-100k, 48.7% for AGIs over 100k)
Taxable interest for individuals: $1,281 (reported on 47.0% of returns)
This zip code:
$1,281
Missouri:
$1,801
(% of AGI for various income ranges: 10.1% for AGIs below $10k, 4.0% for AGIs $10k-25k, 1.8% for AGIs $25k-50k, 0.9% for AGIs $50k-75k, 0.7% for AGIs $75k-100k, 1.2% for AGIs over 100k)
Taxable dividends: $1,744 (reported on 18.3% of returns)
Here:
$1,744
State:
$3,677
(% of AGI for various income ranges: 2.8% for AGIs below $10k, 1.3% for AGIs $10k-25k, 0.4% for AGIs $25k-50k, 0.7% for AGIs $50k-75k, 0.9% for AGIs $75k-100k, 2.4% for AGIs over 100k)
Net capital gain/loss: +$6,560 (reported on 17.3% of returns)
Here:
+$6,560
State:
+$8,915
(% of AGI for various income ranges: 1.6% for AGIs below $10k, 1.9% for AGIs $10k-25k, 0.7% for AGIs $25k-50k, 5.1% for AGIs $50k-75k, 4.6% for AGIs $75k-100k, 7.1% for AGIs over 100k)
Profit/loss from business: +$3,737 (reported on 19.5% of returns)
Here:
+$3,737
State:
+$9,793
(% of AGI for various income ranges: 12.8% for AGIs below $10k, 9.6% for AGIs $10k-25k, 2.8% for AGIs $25k-50k, -1.4% for AGIs $50k-75k, 1.0% for AGIs $75k-100k)
IRA payment deduction: $2,583 (reported on 1.3% of returns)
64469:
$2,583
Missouri:
$2,972
Total itemized deductions: $15,344 (23% of AGI, reported on 17.1% of returns)
Here:
$15,344
State:
$18,261
Here:
22.9% of AGI
State:
20.5% of AGI
(% of AGI for various income ranges: 7.4% for AGIs $10k-25k, 5.0% for AGIs $25k-50k, 8.8% for AGIs $50k-75k, 12.2% for AGIs $75k-100k, 10.2% for AGIs over 100k)
Charity contributions deductions: $3,984 (6% of AGI, reported on 13.4% of returns)
Here:
$3,984
State:
$3,665
Here:
5.6% of AGI
State:
3.9% of AGI
(% of AGI for various income ranges: 0.5% for AGIs $10k-25k, 1.1% for AGIs $25k-50k, 1.9% for AGIs $50k-75k, 1.5% for AGIs $75k-100k, 3.8% for AGIs over 100k)
Total tax: $3,649 (reported on 71.8% of returns)
64469:
$3,649
State:
$6,999
(% of AGI for various income ranges: 3.3% for AGIs below $10k, 4.4% for AGIs $10k-25k, 5.3% for AGIs $25k-50k, 7.7% for AGIs $50k-75k, 10.2% for AGIs $75k-100k, 16.1% for AGIs over 100k)
Earned income credit: $1,587 (reported on 18.2% of returns)
Here:
$1,587
State:
$1,728
Percentage of individuals using paid preparers for their 2004 taxes: 80.6%
Here:
81%
State:
62%
(% for various income ranges: 73.2% for AGIs below $10k, 80.2% for AGIs $10k-25k, 85.8% for AGIs $25k-50k, 85.3% for AGIs $50k-75k, 71.7% for AGIs $75k-100k, 92.0% for AGIs over 100k)
Household received Food Stamps/SNAP in the past 12 months: 85 Household did not receive Food Stamps/SNAP in the past 12 months: 734
Women who had a birth in the past 12 months: 31 (12 now married, 21 unmarried) Women who did not have a birth in the past 12 months: 432 (193 now married, 238 unmarried)
Housing units in zip code 64469 with a mortgage: 299 Median monthly owner costs for units with a mortgage: $1,078 Median monthly owner costs for units without a mortgage: $504
Residents with income below the poverty level in 2022:
This zip code:
12.9%
Whole state:
13.2%
Residents with income below 50% of the poverty level in 2022:
This zip code:
3.8%
Whole state:
6.8%
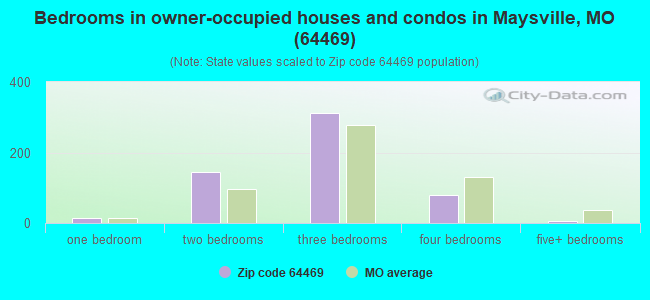
Median number of rooms in houses and condos:
Here:
6.0
State:
6.4
Median number of rooms in apartments:
Here:
4.4
State:
4.4
Notable locations in this zip code not listed on our city pages
Notable locations in zip code 64469: Central Dekalb County Fire Protection District (A), Central Dekalb County Fire Protection District Fairport (B). Display/hide their locations on the map
Cemeteries: Butler Cemetery (1), Norwegian Cemetery (2), Greenridge Cemetery (3), Oak Grove Wood Cemetery (4), Schuchman Cemetery (5), Oak Lawn Cemetery (6), Irwin Cemetery (7). Display/hide their locations on the map
Reservoirs: B-21 Lake (A), Duce Lake (B), C-75 Lake (C), Maysville Reservoir (D), Jestes Lake (E), Gene Carte Farm Lake (F). Display/hide their locations on the map
In group quarters: 54 (-1 institutionalized population)
Size of family households: 252 2-persons, 151 3-persons, 49 4-persons, 30 5-persons, 17 6-persons, 16 7-or-more-persons
Size of nonfamily households: 258 1-person, 44 2-persons, 1 3-persons
340 married couples with children.
185 single-parent households (36 men, 149 women).
99.5% of residents of 64469 zip code speak English at home.
0.2% of residents speak other Indo-European language at home (100% very well).
0.2% of residents speak Asian or Pacific Island language at home (100% very well).
Foreign born population: 33 (1.6%) (0.0% of them are naturalized citizens)
:
1.6%
Whole state:
4.1%
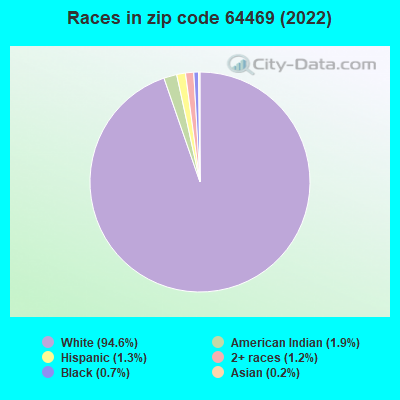
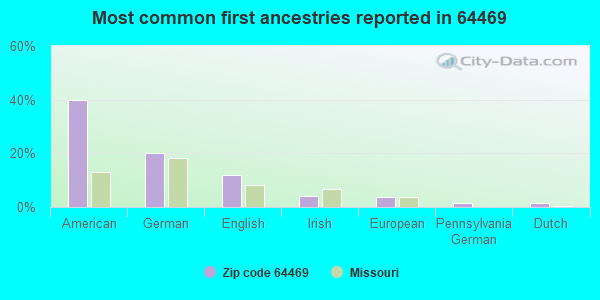
40%American
20%German
12%English
4%Irish
4%European
2%Pennsylvania German
1%Dutch
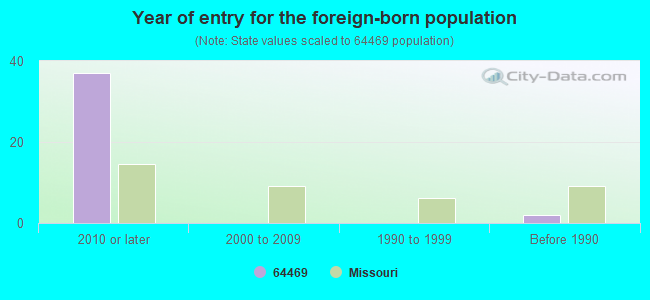
Year of entry for the foreign-born population
372010 or later
02000 to 2009
01990 to 1999
2Before 1990
Facilities with environmental interests located in this zip code:
RED BARN GAS SPILL % US EPA (250 E HWY 6 in MAYSVILLE, MO)
STATE MASTER (Missouri monitoring and compilance) - RCRAINFO-MOP000043612, NOT IN A UNIVERSE (Resource Conservation and Recovery Act (tracking hazardous waste)) Organizations: PAT FLANNERY (CONTACT/OWNER)
Housing units lacking complete plumbing facilities: 2.1% Housing units lacking complete kitchen facilities: 2.8%
40.0%Bottled, tank, or LP gas
39.1%Electricity
7.3%Wood
7.0%Other fuel
6.3%Utility gas
0.5%Solar energy
Population in 1990: 1,948. Population change in the 1990s: +229 (+11.8%).
Place of birth for U.S.-born residents:
This state: 1,582
Northeast: 7
Midwest: 263
South: 84
West: 100
54% of the 64469 zip code residents lived in the same house 5 years ago. Out of people who lived in different houses, 46% lived in this county. Out of people who lived in different counties, 50% lived in Missouri.
93% of the 64469 zip code residents lived in the same house 1 year ago. Out of people who lived in different houses, 35% moved from this county. Out of people who lived in different houses, 58% moved from different county within same state. Out of people who lived in different houses, 10% moved from different state.
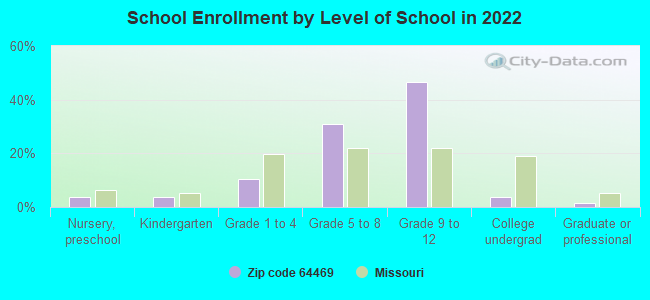
Private vs. public school enrollment:
Students in private schools in grades 1 to 8 (elementary and middle school): 21
Here:
10.2%
Missouri:
15.4%
Students in private schools in grades 9 to 12 (high school): 5
Here:
2.3%
Missouri:
13.9%
Students in private undergraduate colleges:
Here:
0.0%
Missouri:
22.6%
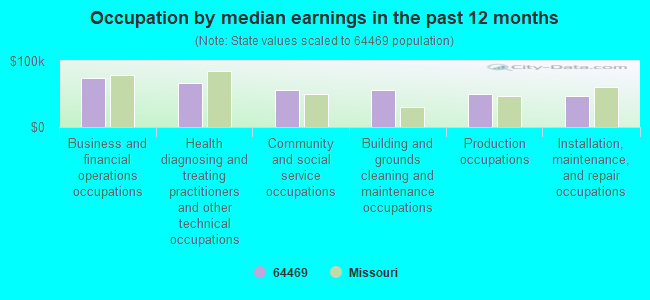
Occupation by median earnings in the past 12 months ($)
74,897Business and financial operations occupations
66,013Health diagnosing and treating practitioners and other technical occupations
56,177Community and social service occupations
55,982Building and grounds cleaning and maintenance occupations
50,056Production occupations
47,658Installation, maintenance, and repair occupations
Top industries in this zip code by the number of employees in 2005:
Health Care and Social Assistance: Nursing Care Facilities (50-99 employees: 1 establishment)
Finance and Insurance: Commercial Banking (20-49: 1, 10-19: 1)
Health Care and Social Assistance: Child Day Care Services (5-9: 2, 1-4: 1)
Health Care and Social Assistance: Offices of Physicians (except Mental Health Specialists) (10-19: 1)
Accommodation and Food Services: Food Service Contractors (10-19: 1)
Wholesale Trade: Farm and Garden Machinery and Equipment Merchant Wholesalers (10-19: 1)
29 people in nursing facilities/skilled-nursing facilities
14 people in workers' group living quarters and job corps centers
People in group quarters in 2000:
66 people in nursing homes
3 people in local jails and other confinement facilities (including police lockups)
3 people in other noninstitutional group quarters
2002 - 2018 National Fire Incident Reporting System (NFIRS) incidents
According to the data from the years 2002 - 2018 the average number of fire incidents per year is 21. The highest number of fire incidents - 43 took place in 2005, and the least - 3 in 2002. The data has a rising trend.
When looking into fire subcategories, the most incidents belonged to: Outside Fires (58.7%), and Structure Fires (28.1%).
Fire incident types reported to NFIRS in Zip Code 64469


 Nearest zip codes: 64422, 64497, 64474, 64463, 64430, 64689.


 According to the data from the years 2002 - 2018 the average number of fire incidents per year is 21. The highest number of fire incidents - 43 took place in 2005, and the least - 3 in 2002. The data has a rising trend.
 When looking into fire subcategories, the most incidents belonged to: Outside Fires (58.7%), and Structure Fires (28.1%).