Estimated zip code population in 2022: 822 Zip code population in 2010: 1,229 Zip code population in 2000: 1,203
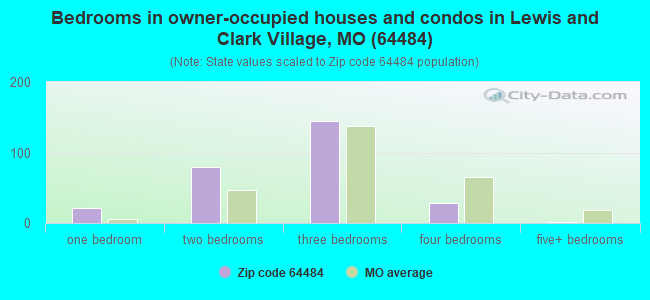
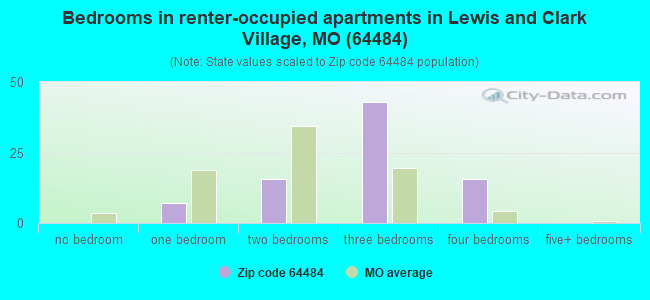
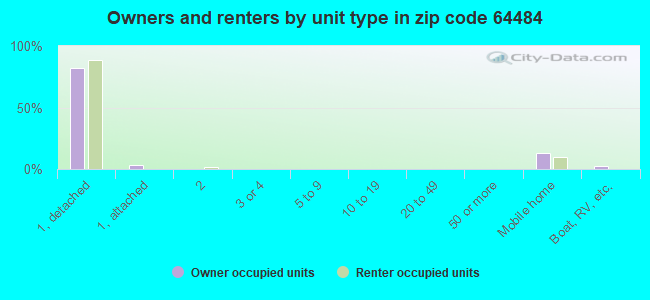
Houses and condos: 386 Renter-occupied apartments: 82
% of renters here:
23%
State:
32%
March 2022 cost of living index in zip code 64484: 75.8 (low, U.S. average is 100)
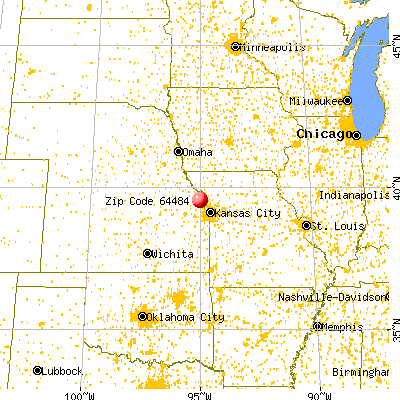
Land area: 72.4 sq. mi. Water area: 3.3 sq. mi.
Population density: 11 people per square mile
(very low).
OSM Map
General Map
Google Map
MSN Map
OSM Map
General Map
Google Map
MSN Map
OSM Map
General Map
Google Map
MSN Map
OSM Map
General Map
Google Map
MSN Map
Please wait while loading the map...
Real estate property taxes paid for housing units in 2022:
This zip code:
0.7% ($881)
Missouri:
0.8% ($1,810)
Median real estate property taxes paid for housing units with mortgages in 2022: $1,092 (0.8%) Median real estate property taxes paid for housing units with no mortgage in 2022: $784 (0.7%)
Business Search- 14 Million verified businesses
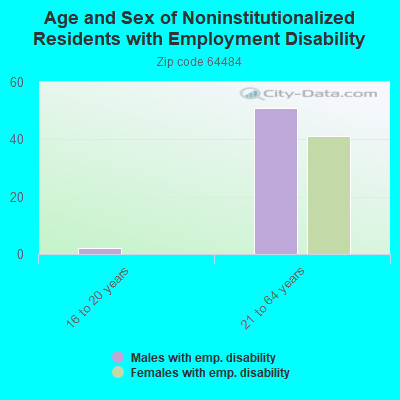
Males: 384
(46.8%)
Females: 437
(53.2%)
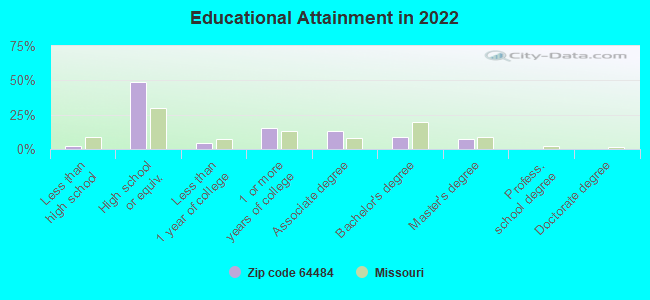
For population 25 years and over in 64484:
High school or higher: 96.3%
Bachelor's degree or higher: 15.7%
Graduate or professional degree: 7.1%
Unemployed: 2.5%
Mean travel time to work (commute): 23.4 minutes
For population 15 years and over in 64484:
Never married: 22.3%
Now married: 55.0%
Separated: 0.4%
Widowed: 5.3%
Divorced: 16.9%
Zip code 64484 compared to state average:
Median house value below state average.
Black race population percentage significantly below state average.
Hispanic race population percentage significantly below state average.
Median age significantly above state average.
Foreign-born population percentage significantly below state average.
Length of stay since moving in significantly above state average.
Number of college students significantly below state average.
Percentage of population with a bachelor's degree or higher below state average.
Averages for the 2020 tax year for zip code 64484, filed in 2021:
Average Adjusted Gross Income (AGI) in 2020: $54,850 (Individual Income Tax Returns)
Here:
$54,850
State:
$68,151
Salary/wage: $48,453 (reported on 82.6% of returns)
Here:
$48,453
State:
$56,131
(% of AGI for various income ranges: 1256.2% for AGIs below $25k, 3557.0% for AGIs $25k-50k, 6470.0% for AGIs $50k-75k, 9775.0% for AGIs $75k-100k, 20193.3% for AGIs $100k-200k)
Taxable interest for individuals: $529 (reported on 30.4% of returns)
This zip code:
$529
Missouri:
$1,586
(% of AGI for various income ranges: 11.2% for AGIs below $25k, 13.0% for AGIs $25k-50k, 8.3% for AGIs $50k-75k, 80.0% for AGIs $75k-100k, 50.0% for AGIs $100k-200k)
Ordinary dividends: $740 (reported on 10.9% of returns)
Here:
$740
State:
$10,947
(% of AGI for various income ranges: 23.8% for AGIs below $25k, 45.0% for AGIs $75k-100k)
Net capital gain/loss in AGI: +$5,075 (reported on 8.7% of returns)
Here:
+$5,075
State:
+$18,453
(% of AGI for various income ranges: 111.2% for AGIs below $25k, 285.0% for AGIs $75k-100k)
Profit/loss from business: +$4,467 (reported on 13.0% of returns)
Here:
+$4,467
State:
+$12,260
(% of AGI for various income ranges: 176.2% for AGIs below $25k, 211.7% for AGIs $50k-75k)
Taxable individual retirement arrangement distribution: $9,733 (reported on 6.5% of returns)
64484:
$9,733
Missouri:
$19,719
(% of AGI for various income ranges: 292.0% for AGIs $25k-50k)
Earned income credit: $2,717 (reported on 13.0% of returns)
Here:
$2,717
State:
$2,315
(% of AGI for various income ranges: 96.2% for AGIs below $25k, 86.0% for AGIs $25k-50k)
Percentage of individuals using paid preparers for their 2020 taxes: 95.7%
Here:
96%
State:
93%
(% for various income ranges: 92.3% for AGIs below $25k, 92.3% for AGIs $25k-50k, 100.0% for AGIs $50k-75k, 100.0% for AGIs $75k-100k, 100.0% for AGIs $100k-200k)
Averages for the 2012 tax year for zip code 64484, filed in 2013:
Average Adjusted Gross Income (AGI) in 2012: $47,254 (Individual Income Tax Returns)
Here:
$47,254
State:
$55,896
Salary/wage: $39,832 (reported on 80.4% of returns)
Here:
$39,832
State:
$46,205
(% of AGI for various income ranges: 68.9% for AGIs below $25k, 81.4% for AGIs $25k-50k, 79.4% for AGIs $50k-75k, 69.5% for AGIs $75k-100k, 45.4% for AGIs $100k-200k)
Taxable interest for individuals: $727 (reported on 32.6% of returns)
This zip code:
$727
Missouri:
$1,559
(% of AGI for various income ranges: 1.2% for AGIs below $25k, 0.6% for AGIs $25k-50k, 0.6% for AGIs $50k-75k, 0.3% for AGIs $75k-100k, 0.2% for AGIs $100k-200k)
Ordinary dividends: $883 (reported on 13.0% of returns)
Here:
$883
State:
$7,410
Net capital gain/loss in AGI: +$6,500 (reported on 13.0% of returns)
Here:
+$6,500
State:
+$11,579
Profit/loss from business: +$4,350 (reported on 13.0% of returns)
Here:
+$4,350
State:
+$11,688
Taxable individual retirement arrangement distribution: $4,800 (reported on 6.5% of returns)
64484:
$4,800
Missouri:
$14,773
Total itemized deductions: $16,486 (17% of AGI, reported on 15.2% of returns)
Here:
$16,486
State:
$22,730
Here:
16.8% of AGI
State:
19.2% of AGI
Charity contributions: $3,380 (reported on 10.9% of returns)
Here:
$3,380
State:
$4,745
(% of AGI for various income ranges: 1.9% for AGIs $25k-50k, 2.0% for AGIs $75k-100k)
Taxes paid: $5,371 (reported on 15.2% of returns)
64484:
$5,371
State:
$8,399
(% of AGI for various income ranges: 2.7% for AGIs below $25k, 1.3% for AGIs $50k-75k, 6.4% for AGIs $75k-100k)
Earned income credit: $2,222 (reported on 19.6% of returns)
Here:
$2,222
State:
$2,288
(% of AGI for various income ranges: 8.3% for AGIs below $25k, 1.1% for AGIs $25k-50k)
Percentage of individuals using paid preparers for their 2012 taxes: 65.2%
Here:
65%
State:
55%
(% for various income ranges: 62.5% for AGIs below $25k, 66.7% for AGIs $25k-50k, 66.7% for AGIs $50k-75k, 60.0% for AGIs $75k-100k, 75.0% for AGIs $100k-200k)
Averages for the 2004 tax year for zip code 64484, filed in 2005:
Average Adjusted Gross Income (AGI) in 2004: $36,914 (Individual Income Tax Returns)
Here:
$36,914
State:
$44,591
Salary/wage: $34,916 (reported on 83.3% of returns)
Here:
$34,916
State:
$38,941
(% of AGI for various income ranges: 75.8% for AGIs below $10k, 74.2% for AGIs $10k-25k, 84.4% for AGIs $25k-50k, 84.8% for AGIs $50k-75k, 83.7% for AGIs $75k-100k, 56.5% for AGIs over 100k)
Taxable interest for individuals: $1,297 (reported on 40.3% of returns)
This zip code:
$1,297
Missouri:
$1,801
(% of AGI for various income ranges: 6.0% for AGIs below $10k, 3.7% for AGIs $10k-25k, 1.3% for AGIs $25k-50k, 0.8% for AGIs $50k-75k, 1.0% for AGIs $75k-100k, 0.4% for AGIs over 100k)
Taxable dividends: $442 (reported on 15.8% of returns)
Here:
$442
State:
$3,677
(% of AGI for various income ranges: 0.4% for AGIs below $10k, 0.3% for AGIs $10k-25k, 0.3% for AGIs $25k-50k, 0.1% for AGIs $50k-75k, 0.2% for AGIs $75k-100k)
Profit/loss from business: +$4,485 (reported on 12.5% of returns)
Here:
+$4,485
State:
+$9,793
(% of AGI for various income ranges: 12.7% for AGIs below $10k, 3.1% for AGIs $10k-25k, 2.4% for AGIs $25k-50k, 1.1% for AGIs $75k-100k)
Total itemized deductions: $13,226 (19% of AGI, reported on 17.1% of returns)
Here:
$13,226
State:
$18,261
Here:
19.2% of AGI
State:
20.5% of AGI
(% of AGI for various income ranges: 6.5% for AGIs $10k-25k, 3.9% for AGIs $25k-50k, 6.3% for AGIs $50k-75k, 7.2% for AGIs $75k-100k, 9.1% for AGIs over 100k)
Charity contributions deductions: $2,652 (3% of AGI, reported on 12.7% of returns)
Here:
$2,652
State:
$3,665
Here:
3.5% of AGI
State:
3.9% of AGI
(% of AGI for various income ranges: 0.9% for AGIs $25k-50k, 0.8% for AGIs $50k-75k, 1.2% for AGIs $75k-100k, 1.7% for AGIs over 100k)
Total tax: $4,799 (reported on 73.3% of returns)
64484:
$4,799
State:
$6,999
(% of AGI for various income ranges: 3.0% for AGIs below $10k, 4.1% for AGIs $10k-25k, 7.0% for AGIs $25k-50k, 8.4% for AGIs $50k-75k, 11.5% for AGIs $75k-100k, 19.0% for AGIs over 100k)
Earned income credit: $1,759 (reported on 15.3% of returns)
Here:
$1,759
State:
$1,728
Percentage of individuals using paid preparers for their 2004 taxes: 75.7%
Here:
76%
State:
62%
(% for various income ranges: 64.7% for AGIs below $10k, 81.5% for AGIs $10k-25k, 74.1% for AGIs $25k-50k, 79.1% for AGIs $50k-75k, 81.8% for AGIs $75k-100k, 73.7% for AGIs over 100k)
Household received Food Stamps/SNAP in the past 12 months: 24 Household did not receive Food Stamps/SNAP in the past 12 months: 333
Women who had a birth in the past 12 months: 9 (6 now married, 3 unmarried) Women who did not have a birth in the past 12 months: 155 (66 now married, 89 unmarried)
Housing units in zip code 64484 with a mortgage: 97 (10 second mortgage, 6 home equity loan) Median monthly owner costs for units with a mortgage: $1,113 Median monthly owner costs for units without a mortgage: $468
Residents with income below the poverty level in 2022:
This zip code:
9.9%
Whole state:
13.2%
Residents with income below 50% of the poverty level in 2022:
This zip code:
1.2%
Whole state:
6.8%
Median number of rooms in houses and condos:
Here:
6.2
State:
6.4
Median number of rooms in apartments:
Here:
6.4
State:
4.4
Notable locations in this zip code not listed on our city pages
Notable locations in zip code 64484: Rushville Volunteer Fire Department (A), Sugar Lake Fire Protection District (B). Display/hide their locations on the map
Cemeteries: Hudseph Cemetery (1), Sugar Creek Cemetery (2), Alexander Cemetery (3), Armstrong Cemetery (4), Bellis Cemetery (5), Kerlin Cemetery (6), Gore Cemetery (7). Display/hide their locations on the map
Lakes and reservoirs: Mud Lake (A), Little Bean Lake (B), Cottonwood Slough (C), Lewis and Clark Lake (D), Bean Lake (E), Indian Mound Lakes (F), Dead Mans Hole (G). Display/hide their locations on the map
Streams, rivers, and creeks: Short Creek (A), Lost Creek (B), Sugar Creek (C), Horseshoe Slough (D), Goose Creek (E). Display/hide their locations on the map
Size of family households: 129 2-persons, 39 3-persons, 34 4-persons, 27 5-persons, 2 6-persons, 2 7-or-more-persons
Size of nonfamily households: 114 1-person, 8 2-persons
100 married couples with children.
72 single-parent households (8 men, 64 women).
99.5% of residents of 64484 zip code speak English at home.
0.3% of residents speak Spanish at home (100% very well).
0.4% of residents speak Asian or Pacific Island language at home (100% well).
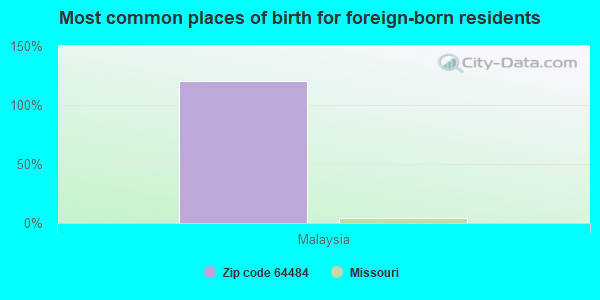
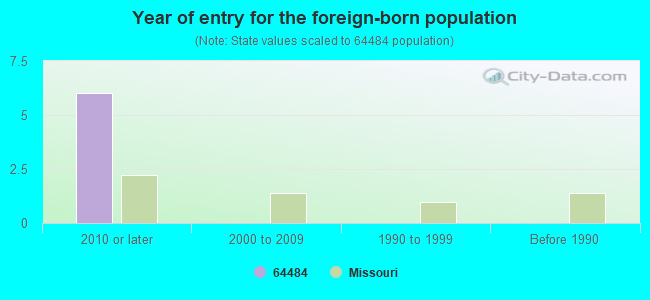
Foreign born population: 5 (0.7%) (100.0% of them are naturalized citizens)
This zip code:
0.7%
Whole state:
4.1%
120%Malaysia
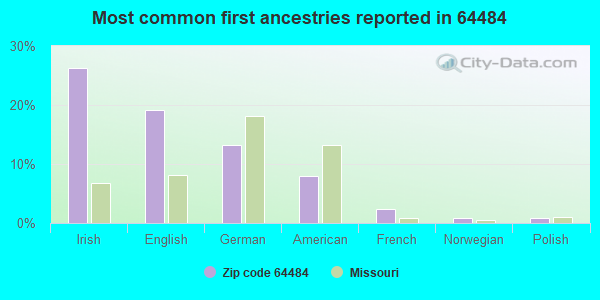
26%Irish
19%English
13%German
8%American
2%French
1%Norwegian
1%Polish
Year of entry for the foreign-born population
62010 or later
02000 to 2009
01990 to 1999
0Before 1990
Facilities with environmental interests located in this zip code:
AMOCO FERTILIZER PLANT (ALONG SANTA FE RR TRACKS in RUSHVILLE, MO)
STATE MASTER (Missouri monitoring and compilance) - RCRAINFO-MOD000687368, NOT IN A UNIVERSE (Resource Conservation and Recovery Act (tracking hazardous waste))
ROBERT SERVAES CONSTRUCTION & QUARRY (8551 S W STATE in RUSHVILLE, MO)
AIR MINOR (AIRS/AFS) STATE MASTER (Missouri monitoring and compilance) - AIRS/AFS-MO0966922, AIR MINOR Business SIC classification: CRUSHED AND BROKEN LIMESTONE
FARMERS COOPERATIVE ASSOCIATION (JCT. US 59 & 116 HIGHWAY in RUSHVILLE, MO)
AIR MINOR (AIRS/AFS) STATE MASTER (Missouri monitoring and compilance) - AIRS/AFS-MO0819253, AIR MINOR Business SIC classification: GRAIN AND FIELD BEANS Alternative names: RUSHVILLE ELEVATOR
RUSHVILLE FERTILIZER PLT (PO BOX 6 in RUSHVILLE, MO)
STATE MASTER (Missouri monitoring and compilance) - NCDB-I07#19980121F2573 1, COMPLIANCE ACTIVITY, NCDB-I07#19940228F2573 1, COMPLIANCE ACTIVITY (Tracking inspections of insecticide, fungicide, and rodenticide, and toxic substances)
RUSHVILLE ELEM. (8681 STATE RD 116 SW in RUSHVILLE, MO)
(National Center for Education Statistics) - STATE ID-4020011079 Organizations: BUCHANAN CO. R-IV (SCHOOL DISTRICT)
Housing units lacking complete plumbing facilities: 2.3% Housing units lacking complete kitchen facilities: 3.1%
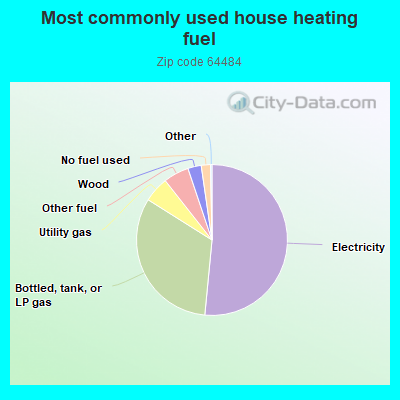
52.0%Electricity
32.7%Bottled, tank, or LP gas
5.5%Utility gas
5.5%Other fuel
2.9%Wood
2.0%No fuel used
Population in 1990: 1,068. Population change in the 1990s: +135 (+12.6%).
Place of birth for U.S.-born residents:
This state: 414
Midwest: 350
South: 32
West: 21
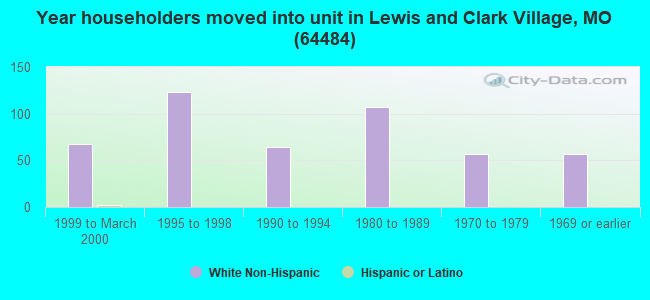
65% of the 64484 zip code residents lived in the same house 5 years ago. Out of people who lived in different houses, 47% lived in this county. Out of people who lived in different counties, 50% lived in Missouri.
92% of the 64484 zip code residents lived in the same house 1 year ago. Out of people who lived in different houses, 35% moved from this county. Out of people who lived in different houses, 51% moved from different county within same state. Out of people who lived in different houses, 16% moved from different state.
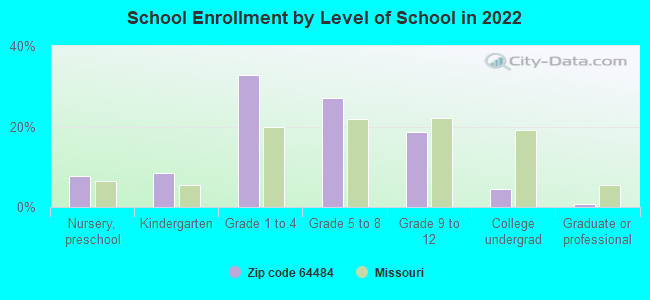
Private vs. public school enrollment:
Students in private schools in grades 1 to 8 (elementary and middle school):
Here:
0.0%
Missouri:
15.4%
Students in private schools in grades 9 to 12 (high school): 4
Here:
14.4%
Missouri:
13.9%
Students in private undergraduate colleges:
Here:
0.0%
Missouri:
22.6%
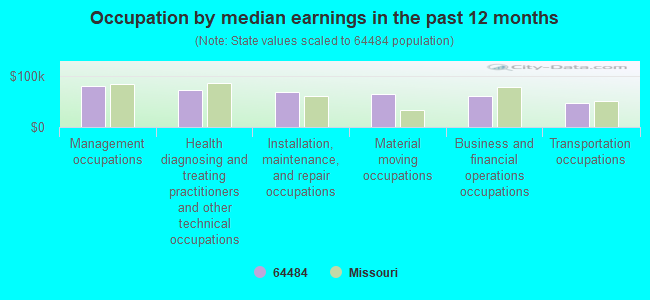
Occupation by median earnings in the past 12 months ($)
81,014Management occupations
73,546Health diagnosing and treating practitioners and other technical occupations
69,715Installation, maintenance, and repair occupations
64,368Material moving occupations
60,163Business and financial operations occupations
47,796Transportation occupations
Top industries in this zip code by the number of employees in 2005:
Construction: Poured Concrete Foundation and Structure Contractors (10-19 employees: 1 establishment)
Finance and Insurance: Commercial Banking (10-19: 1)
Accommodation and Food Services: Snack and Nonalcoholic Beverage Bars (1-4: 1)
Wholesale Trade: Automobile and Other Motor Vehicle Merchant Wholesalers (1-4: 1)
Finance and Insurance: Other Activities Related to Credit Intermediation (1-4: 1)
Administrative and Support and Waste Management and Remediation Services: Landscaping Services (1-4: 1)
Health Care and Social Assistance: Services for the Elderly and Persons with Disabilities (1-4: 1)
Fatal accident statistics in 2012:
Fatal accident count: 1
Vehicles involved in fatal accidents: 1
Fatal accidents caused by drunken drivers: 1
Fatalities: 1
Persons involved in fatal accidents: 1
Pedestrians involved in fatal accidents: 0
Home Mortgage Disclosure Act Aggregated Statistics For Year 2009 (Based on 4 partial tracts)
A) FHA, FSA/RHS & VA Home Purchase Loans
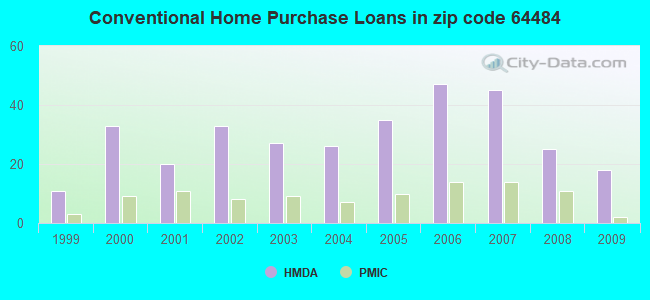
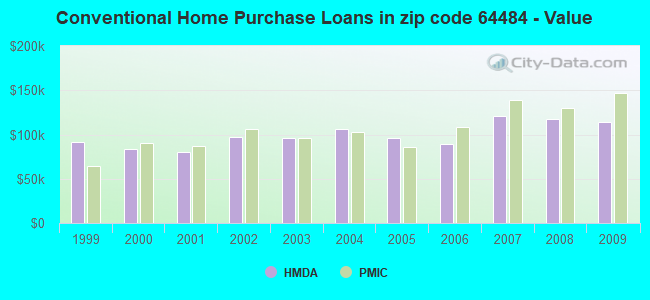
B) Conventional Home Purchase Loans
C) Refinancings
D) Home Improvement Loans
E) Loans on Dwellings For 5+ Families
F) Non-occupant Loans on < 5 Family Dwellings (A B C & D)
G) Loans On Manufactured Home Dwelling (A B C & D)
Number
Average Value
Number
Average Value
Number
Average Value
Number
Average Value
Number
Average Value
Number
Average Value
Number
Average Value
LOANS ORIGINATED
11
$147,001
18
$114,422
82
$141,983
6
$38,863
1
$326,880
14
$130,800
2
$66,600
APPLICATIONS APPROVED, NOT ACCEPTED
1
$160,620
1
$12,260
10
$147,301
0
$0
0
$0
1
$12,260
1
$102,150
APPLICATIONS DENIED
0
$0
4
$44,792
43
$126,865
5
$58,760
0
$0
1
$10,620
7
$64,676
APPLICATIONS WITHDRAWN
3
$160,887
3
$49,233
33
$130,427
3
$59,240
0
$0
1
$40,860
2
$69,460
FILES CLOSED FOR INCOMPLETENESS
1
$71,910
0
$0
4
$142,418
2
$64,150
0
$0
0
$0
1
$79,270
Aggregated Statistics For Year 2008 (Based on 4 partial tracts)
A) FHA, FSA/RHS & VA Home Purchase Loans
B) Conventional Home Purchase Loans
C) Refinancings
D) Home Improvement Loans
F) Non-occupant Loans on < 5 Family Dwellings (A B C & D)
G) Loans On Manufactured Home Dwelling (A B C & D)
Number
Average Value
Number
Average Value
Number
Average Value
Number
Average Value
Number
Average Value
Number
Average Value
LOANS ORIGINATED
9
$136,756
25
$117,497
58
$128,991
20
$43,674
17
$92,142
9
$46,762
APPLICATIONS APPROVED, NOT ACCEPTED
0
$0
1
$144,660
12
$126,767
1
$56,370
2
$28,195
0
$0
APPLICATIONS DENIED
3
$90,487
4
$50,250
54
$125,841
10
$37,242
2
$82,410
3
$70,007
APPLICATIONS WITHDRAWN
0
$0
4
$139,425
17
$172,956
2
$47,425
3
$79,427
2
$71,095
FILES CLOSED FOR INCOMPLETENESS
1
$63,540
0
$0
0
$0
0
$0
0
$0
0
$0
Aggregated Statistics For Year 2007 (Based on 4 partial tracts)
A) FHA, FSA/RHS & VA Home Purchase Loans
B) Conventional Home Purchase Loans
C) Refinancings
D) Home Improvement Loans
F) Non-occupant Loans on < 5 Family Dwellings (A B C & D)
G) Loans On Manufactured Home Dwelling (A B C & D)
Number
Average Value
Number
Average Value
Number
Average Value
Number
Average Value
Number
Average Value
Number
Average Value
LOANS ORIGINATED
7
$148,014
45
$121,212
63
$121,481
14
$28,576
16
$96,339
10
$60,391
APPLICATIONS APPROVED, NOT ACCEPTED
0
$0
5
$142,628
13
$138,485
2
$55,160
0
$0
4
$63,742
APPLICATIONS DENIED
2
$145,250
11
$89,174
56
$136,295
11
$71,579
3
$57,883
7
$78,919
APPLICATIONS WITHDRAWN
0
$0
4
$139,125
21
$124,129
1
$76,020
2
$133,700
1
$32,690
FILES CLOSED FOR INCOMPLETENESS
0
$0
2
$193,790
5
$141,148
1
$40,860
1
$40,860
0
$0
Aggregated Statistics For Year 2006 (Based on 4 partial tracts)
A) FHA, FSA/RHS & VA Home Purchase Loans
B) Conventional Home Purchase Loans
C) Refinancings
D) Home Improvement Loans
F) Non-occupant Loans on < 5 Family Dwellings (A B C & D)
G) Loans On Manufactured Home Dwelling (A B C & D)
Number
Average Value
Number
Average Value
Number
Average Value
Number
Average Value
Number
Average Value
Number
Average Value
LOANS ORIGINATED
6
$125,425
47
$88,753
70
$127,298
17
$31,129
14
$80,474
3
$51,757
APPLICATIONS APPROVED, NOT ACCEPTED
0
$0
3
$88,720
19
$99,887
7
$34,934
0
$0
0
$0
APPLICATIONS DENIED
2
$74,290
28
$92,661
71
$101,635
12
$44,932
4
$114,265
4
$30,032
APPLICATIONS WITHDRAWN
0
$0
8
$77,175
24
$134,753
3
$77,110
2
$46,755
1
$57,200
FILES CLOSED FOR INCOMPLETENESS
0
$0
3
$104,403
4
$105,295
0
$0
1
$77,910
0
$0
Aggregated Statistics For Year 2005 (Based on 4 partial tracts)
A) FHA, FSA/RHS & VA Home Purchase Loans
B) Conventional Home Purchase Loans
C) Refinancings
D) Home Improvement Loans
F) Non-occupant Loans on < 5 Family Dwellings (A B C & D)
G) Loans On Manufactured Home Dwelling (A B C & D)
Number
Average Value
Number
Average Value
Number
Average Value
Number
Average Value
Number
Average Value
Number
Average Value
LOANS ORIGINATED
5
$113,070
35
$96,037
95
$110,377
10
$35,525
16
$70,868
7
$65,376
APPLICATIONS APPROVED, NOT ACCEPTED
1
$15,530
4
$68,535
18
$96,290
2
$49,685
1
$92,570
2
$22,065
APPLICATIONS DENIED
0
$0
15
$67,387
69
$106,757
11
$43,537
4
$87,398
2
$77,225
APPLICATIONS WITHDRAWN
1
$75,180
6
$87,083
51
$112,175
9
$118,094
0
$0
1
$61,290
FILES CLOSED FOR INCOMPLETENESS
0
$0
0
$0
8
$115,559
0
$0
0
$0
0
$0
Aggregated Statistics For Year 2004 (Based on 4 partial tracts)
A) FHA, FSA/RHS & VA Home Purchase Loans
B) Conventional Home Purchase Loans
C) Refinancings
D) Home Improvement Loans
F) Non-occupant Loans on < 5 Family Dwellings (A B C & D)
G) Loans On Manufactured Home Dwelling (A B C & D)
Number
Average Value
Number
Average Value
Number
Average Value
Number
Average Value
Number
Average Value
Number
Average Value
LOANS ORIGINATED
2
$66,520
26
$106,157
98
$109,602
12
$21,608
9
$97,980
7
$59,227
APPLICATIONS APPROVED, NOT ACCEPTED
0
$0
7
$107,747
17
$107,432
2
$10,795
0
$0
1
$58,840
APPLICATIONS DENIED
0
$0
10
$84,348
66
$88,876
7
$21,741
2
$87,030
4
$35,032
APPLICATIONS WITHDRAWN
0
$0
4
$161,858
44
$100,420
5
$37,668
1
$133,470
3
$68,917
FILES CLOSED FOR INCOMPLETENESS
0
$0
2
$109,165
9
$119,739
0
$0
0
$0
0
$0
Aggregated Statistics For Year 2003 (Based on 4 partial tracts)
A) FHA, FSA/RHS & VA Home Purchase Loans
B) Conventional Home Purchase Loans
C) Refinancings
D) Home Improvement Loans
F) Non-occupant Loans on < 5 Family Dwellings (A B C & D)
Number
Average Value
Number
Average Value
Number
Average Value
Number
Average Value
Number
Average Value
LOANS ORIGINATED
7
$109,514
27
$95,914
153
$99,106
12
$53,527
16
$87,916
APPLICATIONS APPROVED, NOT ACCEPTED
1
$137,510
4
$86,802
15
$122,186
1
$12,100
0
$0
APPLICATIONS DENIED
1
$36,770
18
$65,469
60
$104,100
4
$23,542
2
$71,665
APPLICATIONS WITHDRAWN
1
$47,400
9
$107,071
46
$102,088
0
$0
2
$100,105
FILES CLOSED FOR INCOMPLETENESS
0
$0
2
$94,775
5
$122,476
0
$0
0
$0
Aggregated Statistics For Year 2002 (Based on 4 partial tracts)
A) FHA, FSA/RHS & VA Home Purchase Loans
B) Conventional Home Purchase Loans
C) Refinancings
D) Home Improvement Loans
F) Non-occupant Loans on < 5 Family Dwellings (A B C & D)
Number
Average Value
Number
Average Value
Number
Average Value
Number
Average Value
Number
Average Value
LOANS ORIGINATED
4
$101,848
33
$97,016
116
$101,663
14
$23,167
9
$71,259
APPLICATIONS APPROVED, NOT ACCEPTED
1
$185,500
3
$67,227
17
$89,276
2
$7,640
0
$0
APPLICATIONS DENIED
1
$62,780
6
$52,360
37
$86,885
8
$17,558
1
$60,240
APPLICATIONS WITHDRAWN
0
$0
5
$97,384
34
$88,246
2
$51,710
1
$93,790
FILES CLOSED FOR INCOMPLETENESS
0
$0
2
$34,830
5
$108,166
0
$0
1
$50,050
Aggregated Statistics For Year 2001 (Based on 4 partial tracts)
A) FHA, FSA/RHS & VA Home Purchase Loans
B) Conventional Home Purchase Loans
C) Refinancings
D) Home Improvement Loans
F) Non-occupant Loans on < 5 Family Dwellings (A B C & D)
Number
Average Value
Number
Average Value
Number
Average Value
Number
Average Value
Number
Average Value
LOANS ORIGINATED
8
$100,430
20
$80,178
86
$91,980
18
$71,599
11
$65,478
APPLICATIONS APPROVED, NOT ACCEPTED
0
$0
3
$45,690
8
$134,148
0
$0
1
$90,390
APPLICATIONS DENIED
1
$127,080
12
$74,694
29
$81,190
6
$18,227
2
$41,025
APPLICATIONS WITHDRAWN
1
$44,130
2
$73,940
15
$111,176
2
$10,400
0
$0
FILES CLOSED FOR INCOMPLETENESS
0
$0
2
$68,415
6
$103,707
0
$0
1
$24,060
Aggregated Statistics For Year 2000 (Based on 4 partial tracts)
A) FHA, FSA/RHS & VA Home Purchase Loans
B) Conventional Home Purchase Loans
C) Refinancings
D) Home Improvement Loans
F) Non-occupant Loans on < 5 Family Dwellings (A B C & D)
Number
Average Value
Number
Average Value
Number
Average Value
Number
Average Value
Number
Average Value
LOANS ORIGINATED
6
$82,973
33
$83,845
33
$79,266
16
$17,070
4
$66,395
APPLICATIONS APPROVED, NOT ACCEPTED
0
$0
5
$84,484
6
$67,397
3
$18,903
1
$81,720
APPLICATIONS DENIED
0
$0
10
$69,937
17
$65,678
5
$20,234
2
$28,075
APPLICATIONS WITHDRAWN
0
$0
5
$73,618
13
$67,855
1
$57,880
0
$0
FILES CLOSED FOR INCOMPLETENESS
0
$0
0
$0
3
$84,840
1
$19,610
0
$0
Aggregated Statistics For Year 1999 (Based on 2 partial tracts)
A) FHA, FSA/RHS & VA Home Purchase Loans
B) Conventional Home Purchase Loans
C) Refinancings
D) Home Improvement Loans
F) Non-occupant Loans on < 5 Family Dwellings (A B C & D)
Detailed PMIC statistics for the following Tracts:0029.00
, 0307.00
2002 - 2018 National Fire Incident Reporting System (NFIRS) incidents
According to the data from the years 2002 - 2018 the average number of fire incidents per year is 8. The highest number of fires - 27 took place in 2014, and the least - 1 in 2007. The data has a declining trend.
When looking into fire subcategories, the most incidents belonged to: Structure Fires (41.5%), and Outside Fires (40.0%).
Fire incident types reported to NFIRS in Zip Code 64484


 Nearest zip codes: 64440, 66002, 64098, 64504, 64448, 66027.


 According to the data from the years 2002 - 2018 the average number of fire incidents per year is 8. The highest number of fires - 27 took place in 2014, and the least - 1 in 2007. The data has a declining trend.
 When looking into fire subcategories, the most incidents belonged to: Structure Fires (41.5%), and Outside Fires (40.0%).