Estimated zip code population in 2022: 1,501 Zip code population in 2010: 1,428 Zip code population in 2000: 1,534
Houses and condos: 668 Renter-occupied apartments: 123
% of renters here:
19%
State:
32%
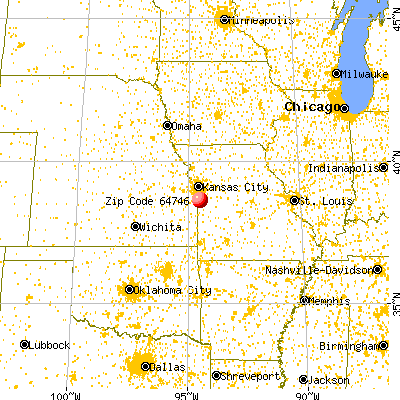
March 2022 cost of living index in zip code 64746: 77.4 (low, U.S. average is 100)
Land area: 31.0 sq. mi. Water area: 0.3 sq. mi.
Population density: 48 people per square mile
(very low).
OSM Map
General Map
Google Map
MSN Map
OSM Map
General Map
Google Map
MSN Map
OSM Map
General Map
Google Map
MSN Map
OSM Map
General Map
Google Map
MSN Map
Please wait while loading the map...
Real estate property taxes paid for housing units in 2022:
This zip code:
0.8% ($1,731)
Missouri:
0.8% ($1,810)
Median real estate property taxes paid for housing units with mortgages in 2022: $1,684 (0.6%) Median real estate property taxes paid for housing units with no mortgage in 2022: $1,905 (1.2%)
Business Search- 14 Million verified businesses
Males: 772
(51.5%)
Females: 728
(48.5%)
For population 25 years and over in 64746:
High school or higher: 93.2%
Bachelor's degree or higher: 20.6%
Graduate or professional degree: 4.6%
Unemployed: 4.3%
Mean travel time to work (commute): 33.3 minutes
For population 15 years and over in 64746:
Never married: 19.7%
Now married: 55.8%
Separated: 2.4%
Widowed: 7.2%
Divorced: 14.9%
Zip code 64746 compared to state average:
Black race population percentage significantly below state average.
Hispanic race population percentage significantly below state average.
Foreign-born population percentage significantly below state average.
Renting percentage below state average.
Number of college students significantly below state average.
Percentage of population with a bachelor's degree or higher below state average.
Averages for the 2020 tax year for zip code 64746, filed in 2021:
Average Adjusted Gross Income (AGI) in 2020: $62,558 (Individual Income Tax Returns)
Here:
$62,558
State:
$68,151
Salary/wage: $57,384 (reported on 79.2% of returns)
Here:
$57,384
State:
$56,131
(% of AGI for various income ranges: 1128.7% for AGIs below $25k, 3583.6% for AGIs $25k-50k, 6577.5% for AGIs $50k-75k, 8152.9% for AGIs $75k-100k, 17581.7% for AGIs $100k-200k)
Taxable interest for individuals: $486 (reported on 30.6% of returns)
This zip code:
$486
Missouri:
$1,586
(% of AGI for various income ranges: 12.0% for AGIs below $25k, 7.1% for AGIs $25k-50k, 21.2% for AGIs $50k-75k, 52.9% for AGIs $75k-100k, 41.7% for AGIs $100k-200k)
Ordinary dividends: $1,842 (reported on 16.7% of returns)
Here:
$1,842
State:
$10,947
(% of AGI for various income ranges: 37.3% for AGIs below $25k, 81.2% for AGIs $50k-75k, 166.7% for AGIs $100k-200k)
Net capital gain/loss in AGI: +$5,540 (reported on 13.9% of returns)
Here:
+$5,540
State:
+$18,453
(% of AGI for various income ranges: 25.3% for AGIs below $25k, 120.0% for AGIs $50k-75k, 700.0% for AGIs $100k-200k)
Profit/loss from business: +$11,445 (reported on 15.3% of returns)
Here:
+$11,445
State:
+$12,260
(% of AGI for various income ranges: 313.3% for AGIs below $25k, 256.2% for AGIs $50k-75k, 582.9% for AGIs $75k-100k, 293.3% for AGIs $100k-200k)
Taxable individual retirement arrangement distribution: $17,543 (reported on 9.7% of returns)
64746:
$17,543
Missouri:
$19,719
(% of AGI for various income ranges: 95.3% for AGIs below $25k, 497.5% for AGIs $50k-75k, 981.4% for AGIs $75k-100k)
Total itemized deductions: $22,600 (reported on 5.6% of returns)
Here:
$22,600
State:
$36,651
(% of AGI for various income ranges: 1506.7% for AGIs $100k-200k)
Charity contributions: $9,350 (reported on 2.8% of returns)
Here:
$9,350
State:
$15,671
(% of AGI for various income ranges: 233.8% for AGIs $50k-75k)
Taxes paid: $7,000 (reported on 5.6% of returns)
64746:
$7,000
State:
$7,608
(% of AGI for various income ranges: 466.7% for AGIs $100k-200k)
Earned income credit: $1,633 (reported on 12.5% of returns)
Here:
$1,633
State:
$2,315
(% of AGI for various income ranges: 70.0% for AGIs below $25k, 30.0% for AGIs $25k-50k)
Percentage of individuals using paid preparers for their 2020 taxes: 93.1%
Here:
93%
State:
93%
(% for various income ranges: 90.5% for AGIs below $25k, 94.1% for AGIs $25k-50k, 91.7% for AGIs $50k-75k, 88.9% for AGIs $75k-100k, 100.0% for AGIs $100k-200k, 100.0% for AGIs over 200k)
Averages for the 2012 tax year for zip code 64746, filed in 2013:
Average Adjusted Gross Income (AGI) in 2012: $49,537 (Individual Income Tax Returns)
Here:
$49,537
State:
$55,896
Salary/wage: $45,637 (reported on 80.6% of returns)
Here:
$45,637
State:
$46,205
(% of AGI for various income ranges: 72.4% for AGIs below $25k, 72.9% for AGIs $25k-50k, 76.2% for AGIs $50k-75k, 76.0% for AGIs $75k-100k, 73.1% for AGIs $100k-200k)
Taxable interest for individuals: $647 (reported on 28.4% of returns)
This zip code:
$647
Missouri:
$1,559
(% of AGI for various income ranges: 0.9% for AGIs below $25k, 0.5% for AGIs $25k-50k, 0.5% for AGIs $50k-75k, 0.2% for AGIs $75k-100k, 0.2% for AGIs $100k-200k)
Ordinary dividends: $1,591 (reported on 16.4% of returns)
Here:
$1,591
State:
$7,410
(% of AGI for various income ranges: 0.7% for AGIs below $25k, 0.6% for AGIs $25k-50k, 1.2% for AGIs $50k-75k, 0.3% for AGIs $100k-200k)
Profit/loss from business: +$9,864 (reported on 16.4% of returns)
Here:
+$9,864
State:
+$11,688
(% of AGI for various income ranges: 5.8% for AGIs below $25k, 8.1% for AGIs $25k-50k, 7.0% for AGIs $75k-100k)
Taxable individual retirement arrangement distribution: $17,657 (reported on 10.4% of returns)
64746:
$17,657
Missouri:
$14,773
Total itemized deductions: $20,272 (22% of AGI, reported on 26.9% of returns)
Here:
$20,272
State:
$22,730
Here:
21.7% of AGI
State:
19.2% of AGI
(% of AGI for various income ranges: 9.3% for AGIs $25k-50k, 10.1% for AGIs $50k-75k, 12.9% for AGIs $75k-100k, 14.2% for AGIs $100k-200k)
Charity contributions: $3,500 (reported on 20.9% of returns)
Here:
$3,500
State:
$4,745
(% of AGI for various income ranges: 1.4% for AGIs $25k-50k, 1.3% for AGIs $50k-75k, 1.8% for AGIs $75k-100k, 1.9% for AGIs $100k-200k)
Taxes paid: $6,561 (reported on 26.9% of returns)
64746:
$6,561
State:
$8,399
(% of AGI for various income ranges: 1.9% for AGIs $25k-50k, 2.8% for AGIs $50k-75k, 3.5% for AGIs $75k-100k, 5.9% for AGIs $100k-200k)
Earned income credit: $2,560 (reported on 14.9% of returns)
Here:
$2,560
State:
$2,288
(% of AGI for various income ranges: 7.2% for AGIs below $25k, 0.9% for AGIs $25k-50k)
Percentage of individuals using paid preparers for their 2012 taxes: 59.7%
Here:
60%
State:
55%
(% for various income ranges: 52.2% for AGIs below $25k, 50.0% for AGIs $25k-50k, 66.7% for AGIs $50k-75k, 75.0% for AGIs $75k-100k, 75.0% for AGIs $100k-200k)
Averages for the 2004 tax year for zip code 64746, filed in 2005:
Average Adjusted Gross Income (AGI) in 2004: $43,790 (Individual Income Tax Returns)
Here:
$43,790
State:
$44,591
Salary/wage: $39,718 (reported on 83.6% of returns)
Here:
$39,718
State:
$38,941
(% of AGI for various income ranges: 100.6% for AGIs below $10k, 67.4% for AGIs $10k-25k, 77.1% for AGIs $25k-50k, 82.0% for AGIs $50k-75k, 91.4% for AGIs $75k-100k, 59.4% for AGIs over 100k)
Taxable interest for individuals: $971 (reported on 41.3% of returns)
This zip code:
$971
Missouri:
$1,801
(% of AGI for various income ranges: 4.1% for AGIs below $10k, 4.6% for AGIs $10k-25k, 1.2% for AGIs $25k-50k, 0.3% for AGIs $50k-75k, 0.2% for AGIs $75k-100k, 0.3% for AGIs over 100k)
Taxable dividends: $1,071 (reported on 19.0% of returns)
Here:
$1,071
State:
$3,677
(% of AGI for various income ranges: 0.5% for AGIs $10k-25k, 0.4% for AGIs $25k-50k, 0.1% for AGIs $50k-75k, 0.1% for AGIs $75k-100k, 1.1% for AGIs over 100k)
Net capital gain/loss: +$3,301 (reported on 13.9% of returns)
Here:
+$3,301
State:
+$8,915
(% of AGI for various income ranges: 3.1% for AGIs below $10k, 0.3% for AGIs $25k-50k, 0.3% for AGIs $50k-75k, 3.2% for AGIs over 100k)
Profit/loss from business: +$5,423 (reported on 18.4% of returns)
Here:
+$5,423
State:
+$9,793
(% of AGI for various income ranges: -12.5% for AGIs below $10k, 7.9% for AGIs $10k-25k, 3.2% for AGIs $25k-50k, 3.5% for AGIs $50k-75k, 1.5% for AGIs $75k-100k)
Total itemized deductions: $17,411 (22% of AGI, reported on 32.7% of returns)
Here:
$17,411
State:
$18,261
Here:
21.6% of AGI
State:
20.5% of AGI
(% of AGI for various income ranges: 13.9% for AGIs $10k-25k, 7.9% for AGIs $25k-50k, 13.1% for AGIs $50k-75k, 17.0% for AGIs $75k-100k, 14.1% for AGIs over 100k)
Charity contributions deductions: $2,705 (3% of AGI, reported on 26.3% of returns)
Here:
$2,705
State:
$3,665
Here:
3.0% of AGI
State:
3.9% of AGI
(% of AGI for various income ranges: 0.9% for AGIs $10k-25k, 0.8% for AGIs $25k-50k, 1.6% for AGIs $50k-75k, 2.4% for AGIs $75k-100k, 2.0% for AGIs over 100k)
Total tax: $6,065 (reported on 75.7% of returns)
64746:
$6,065
State:
$6,999
(% of AGI for various income ranges: 4.3% for AGIs below $10k, 4.1% for AGIs $10k-25k, 6.9% for AGIs $25k-50k, 8.2% for AGIs $50k-75k, 9.1% for AGIs $75k-100k, 18.6% for AGIs over 100k)
Earned income credit: $1,471 (reported on 13.0% of returns)
Here:
$1,471
State:
$1,728
Percentage of individuals using paid preparers for their 2004 taxes: 67.6%
Here:
68%
State:
62%
(% for various income ranges: 54.2% for AGIs below $10k, 65.9% for AGIs $10k-25k, 73.1% for AGIs $25k-50k, 70.0% for AGIs $50k-75k, 72.1% for AGIs $75k-100k, 82.9% for AGIs over 100k)
Household received Food Stamps/SNAP in the past 12 months: 85 Household did not receive Food Stamps/SNAP in the past 12 months: 550
Women who had a birth in the past 12 months: 8 (8 now married, 0 unmarried) Women who did not have a birth in the past 12 months: 255 (159 now married, 94 unmarried)
Housing units in zip code 64746 with a mortgage: 315 (5 second mortgage, 3 both second mortgage and home equity loan) Houses without a mortgage: 11
Median monthly owner costs for units with a mortgage: $1,806 Median monthly owner costs for units without a mortgage: $512
Residents with income below the poverty level in 2022:
This zip code:
15.0%
Whole state:
13.2%
Residents with income below 50% of the poverty level in 2022:
This zip code:
4.1%
Whole state:
6.8%
Median number of rooms in houses and condos:
Here:
6.2
State:
6.4
Median number of rooms in apartments:
Here:
3.4
State:
4.4
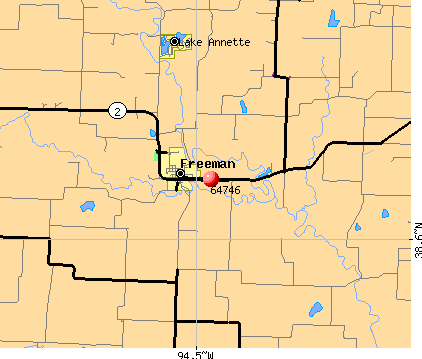
Notable locations in this zip code not listed on our city pages
Notable locations in zip code 64746: Cass County Midway Wastewater Treatment Facility (A), Freeman Wastewater Treatment Facility (B), Zion School (C), Dolan - West Dolan Fire Protection District Main Station (D). Display/hide their locations on the map
Size of family households: 189 2-persons, 57 3-persons, 86 4-persons, 37 5-persons, 19 6-persons, 4 7-or-more-persons
Size of nonfamily households: 216 1-person, 20 2-persons, 3 3-persons
273 married couples with children.
117 single-parent households (25 men, 92 women).
99.1% of residents of 64746 zip code speak English at home.
0.5% of residents speak Spanish at home (100% very well).
0.2% of residents speak other Indo-European language at home (100% very well).
Foreign born population: 11 (0.8%) (75.2% of them are naturalized citizens)
This zip code:
0.8%
Whole state:
4.1%
91%Japan
46%Irish
14%American
9%German
4%European
3%Italian
2%English
2%French
Year of entry for the foreign-born population
22010 or later
02000 to 2009
01990 to 1999
26Before 1990
Facilities with environmental interests located in this zip code:
AMOCO PIPE LINE CO (700 E MAIN in FREEMAN, MO)
AIR MINOR (AIRS/AFS) OIL CONTROL (Facility Response Plan for oil discharge) STATE MASTER (Missouri monitoring and compilance) - AIRS/AFS-MO0806158, AIR MINOR STATE MASTER (Missouri monitoring and compilance) - PCS-MO0106933, NPDES NON-MAJOR, RCRAINFO-MOT300010246, LQG National Pollutant Discharge Elimination System NON-MAJOR (Tracking pollutant discharge elimination systems) - permit Large Quantity Generators, more that 1000 kg of hazardous waste/month (Resource Conservation and Recovery Act (tracking hazardous waste)) - notification Business SIC classification: CRUDE PETROLEUM PIPELINES Organizations: BP PIPELINES NORTH AMERICA (CONTACT/OPERATOR)
, BP PIPELINES NORTH AMERIC (CONTACT/OWNER)
Alternative names: AMOCO PIPELINE , AMOCO PIPELINE CO FREEMAN, AMOCO PIPELINE COMPANY, BP PIPELINES/FREEMAN, BP PIPELINES FREEMAN STATION
FREEMAN (FREEMAN in FREEMAN, MO)
STATE MASTER (Missouri monitoring and compilance) - PCS-MO0104248, NPDES NON-MAJOR National Pollutant Discharge Elimination System NON-MAJOR (Tracking pollutant discharge elimination systems) - permit National Pollutant Discharge Elimination System NON-MAJOR (Tracking pollutant discharge elimination systems) - permit COMMUNITY WATER SYSTEM (SDWIS) Business SIC classification: HEAVY CONSTRUCTION; SEWERAGE SYSTEMS Organizations: FREEMAN, CITY OF (CONTACT/OWNER)
Alternative names: FREEMAN, CITY OF, FREEMAN WASTEWATER TREATM, FREEMAN WWTF
HIGHWAY 2 DRUMS (HWY 2 1/4 MI W OF CO RD C in FREEMAN, MO)
SUPERFUND (Superfund database) STATE MASTER (Missouri monitoring and compilance) - CERCLIS-MOD985809490, SUPERFUND Alternative names: FREEMAN DRUMS (FINDS), FREEMAN OPERATING AREA (FINDS), LOWE FARM
BP PIPELINES/NORTH AMERIC (700 EAST MAIN ST in FREEMAN, MO)
National Pollutant Discharge Elimination System NON-MAJOR (Tracking pollutant discharge elimination systems) - permit Business SIC classification: REFINED PETROLEUM PIPELINES Alternative names: FREEMAN TERMINAL/BP PIPE
BP PIPELINES NORTH AMERICA INC-FREEMAN STATION (700 EAST MAIN in FREEMAN, MO)
CRITERIA AND HAZARDOUS AIR POLLUTANT INVENTORY (Inventory of air pollution sources) Business SIC classification: CRUDE PETROLEUM PIPELINES
Housing units lacking complete plumbing facilities: 2.5% Housing units lacking complete kitchen facilities: 1.7%
48.1%Electricity
22.0%Utility gas
18.8%Bottled, tank, or LP gas
11.5%Wood
Population in 1990: 1,509. Population change in the 1990s: +25 (+1.7%).
Place of birth for U.S.-born residents:
This state: 808
Northeast: 4
Midwest: 567
South: 38
West: 56
61% of the 64746 zip code residents lived in the same house 5 years ago. Out of people who lived in different houses, 53% lived in this county. Out of people who lived in different counties, 50% lived in Missouri.
95% of the 64746 zip code residents lived in the same house 1 year ago. Out of people who lived in different houses, 9% moved from this county. Out of people who lived in different houses, 37% moved from different county within same state. Out of people who lived in different houses, 63% moved from different state.
Private vs. public school enrollment:
Students in private schools in grades 1 to 8 (elementary and middle school): 3
Here:
1.5%
Missouri:
15.4%
Students in private schools in grades 9 to 12 (high school):
Here:
0.0%
Missouri:
13.9%
Students in private undergraduate colleges: 3
Here:
26.9%
Missouri:
22.6%
Occupation by median earnings in the past 12 months ($)
118,352Installation, maintenance, and repair occupations
98,748Health diagnosing and treating practitioners and other technical occupations
84,877Construction and extraction occupations
81,804Business and financial operations occupations
74,855Health technologists and technicians
72,924Management occupations
Companies with federal contracts located in this zip code:
STRATEGOS PROFESSIONAL PRODUCT (7901 E STATE RTE W in FREEMAN, MO; small business)
$37,960 with Army for Individual Equipment. Signed on 2005-09-29. Completion date: 2005-11-21.
Top industries in this zip code by the number of employees in 2005:
Construction: Poured Concrete Foundation and Structure Contractors (10-19 employees: 1 establishment, 5-9 employees: 1 establishment)
Other Services (except Public Administration): Car Washes (5-9: 1)
Construction: Water and Sewer Line and Related Structures Construction (5-9: 1)
Construction: Commercial and Institutional Building Construction (1-4: 2)
Construction: Electrical Contractors (1-4: 1)
Information: Internet Service Providers (1-4: 1)
People in group quarters in 2000:
3 people in homes for the mentally retarded
Home Mortgage Disclosure Act Aggregated Statistics For Year 2009 (Based on 2 partial tracts)
A) FHA, FSA/RHS & VA Home Purchase Loans
B) Conventional Home Purchase Loans
C) Refinancings
D) Home Improvement Loans
F) Non-occupant Loans on < 5 Family Dwellings (A B C & D)
G) Loans On Manufactured Home Dwelling (A B C & D)
Number
Average Value
Number
Average Value
Number
Average Value
Number
Average Value
Number
Average Value
Number
Average Value
LOANS ORIGINATED
4
$111,362
5
$109,338
53
$153,324
4
$43,080
2
$53,850
1
$100,380
APPLICATIONS APPROVED, NOT ACCEPTED
1
$151,640
0
$0
6
$141,230
0
$0
0
$0
0
$0
APPLICATIONS DENIED
2
$144,105
2
$104,255
14
$170,320
4
$47,928
1
$106,840
3
$89,607
APPLICATIONS WITHDRAWN
1
$69,790
0
$0
9
$191,131
1
$84,440
0
$0
0
$0
FILES CLOSED FOR INCOMPLETENESS
0
$0
0
$0
2
$156,810
0
$0
0
$0
0
$0
Aggregated Statistics For Year 2008 (Based on 2 partial tracts)
A) FHA, FSA/RHS & VA Home Purchase Loans
B) Conventional Home Purchase Loans
C) Refinancings
D) Home Improvement Loans
F) Non-occupant Loans on < 5 Family Dwellings (A B C & D)
G) Loans On Manufactured Home Dwelling (A B C & D)
Number
Average Value
Number
Average Value
Number
Average Value
Number
Average Value
Number
Average Value
Number
Average Value
LOANS ORIGINATED
5
$133,290
9
$135,846
34
$155,620
4
$31,988
3
$87,883
1
$75,390
APPLICATIONS APPROVED, NOT ACCEPTED
1
$83,580
1
$106,840
6
$189,983
1
$96,500
0
$0
0
$0
APPLICATIONS DENIED
0
$0
3
$128,090
32
$140,414
5
$62,724
2
$76,680
3
$111,003
APPLICATIONS WITHDRAWN
0
$0
0
$0
12
$151,247
1
$138,720
0
$0
1
$46,960
FILES CLOSED FOR INCOMPLETENESS
0
$0
0
$0
4
$227,248
0
$0
0
$0
0
$0
Aggregated Statistics For Year 2007 (Based on 2 partial tracts)
A) FHA, FSA/RHS & VA Home Purchase Loans
B) Conventional Home Purchase Loans
C) Refinancings
D) Home Improvement Loans
F) Non-occupant Loans on < 5 Family Dwellings (A B C & D)
G) Loans On Manufactured Home Dwelling (A B C & D)
Number
Average Value
Number
Average Value
Number
Average Value
Number
Average Value
Number
Average Value
Number
Average Value
LOANS ORIGINATED
3
$99,083
19
$136,405
42
$151,847
6
$21,540
4
$142,058
2
$116,530
APPLICATIONS APPROVED, NOT ACCEPTED
1
$102,100
2
$90,035
11
$133,705
2
$19,385
0
$0
1
$120,190
APPLICATIONS DENIED
0
$0
8
$115,992
30
$117,235
4
$27,895
3
$145,610
2
$105,545
APPLICATIONS WITHDRAWN
1
$53,420
1
$221,430
12
$150,601
0
$0
1
$61,600
0
$0
FILES CLOSED FOR INCOMPLETENESS
0
$0
0
$0
3
$86,160
0
$0
0
$0
0
$0
Aggregated Statistics For Year 2006 (Based on 2 partial tracts)
A) FHA, FSA/RHS & VA Home Purchase Loans
B) Conventional Home Purchase Loans
C) Refinancings
D) Home Improvement Loans
F) Non-occupant Loans on < 5 Family Dwellings (A B C & D)
G) Loans On Manufactured Home Dwelling (A B C & D)
Number
Average Value
Number
Average Value
Number
Average Value
Number
Average Value
Number
Average Value
Number
Average Value
LOANS ORIGINATED
3
$105,690
33
$126,368
52
$144,210
12
$30,407
7
$73,913
3
$80,417
APPLICATIONS APPROVED, NOT ACCEPTED
0
$0
3
$85,153
9
$144,606
3
$56,147
0
$0
0
$0
APPLICATIONS DENIED
1
$118,900
4
$122,348
31
$127,434
7
$84,376
2
$59,020
1
$105,550
APPLICATIONS WITHDRAWN
2
$131,825
7
$141,180
17
$140,188
1
$27,570
1
$78,840
1
$86,590
FILES CLOSED FOR INCOMPLETENESS
0
$0
0
$0
6
$136,923
0
$0
0
$0
0
$0
Aggregated Statistics For Year 2005 (Based on 2 partial tracts)
A) FHA, FSA/RHS & VA Home Purchase Loans
B) Conventional Home Purchase Loans
C) Refinancings
D) Home Improvement Loans
F) Non-occupant Loans on < 5 Family Dwellings (A B C & D)
G) Loans On Manufactured Home Dwelling (A B C & D)
Number
Average Value
Number
Average Value
Number
Average Value
Number
Average Value
Number
Average Value
Number
Average Value
LOANS ORIGINATED
4
$121,378
28
$99,530
59
$115,710
7
$58,834
5
$62,208
4
$60,635
APPLICATIONS APPROVED, NOT ACCEPTED
0
$0
5
$140,096
8
$110,285
0
$0
0
$0
1
$135,700
APPLICATIONS DENIED
1
$72,370
6
$75,677
31
$124,779
6
$34,392
1
$45,230
3
$88,600
APPLICATIONS WITHDRAWN
0
$0
3
$131,537
28
$135,040
2
$121,700
0
$0
1
$71,080
FILES CLOSED FOR INCOMPLETENESS
0
$0
0
$0
5
$150,866
0
$0
0
$0
0
$0
Aggregated Statistics For Year 2004 (Based on 2 partial tracts)
A) FHA, FSA/RHS & VA Home Purchase Loans
B) Conventional Home Purchase Loans
C) Refinancings
D) Home Improvement Loans
F) Non-occupant Loans on < 5 Family Dwellings (A B C & D)
G) Loans On Manufactured Home Dwelling (A B C & D)
Number
Average Value
Number
Average Value
Number
Average Value
Number
Average Value
Number
Average Value
Number
Average Value
LOANS ORIGINATED
5
$118,040
25
$102,289
68
$124,489
8
$41,734
6
$97,433
6
$71,082
APPLICATIONS APPROVED, NOT ACCEPTED
0
$0
7
$103,207
12
$103,822
1
$86,160
1
$158,100
2
$57,510
APPLICATIONS DENIED
0
$0
11
$93,484
35
$116,895
5
$28,088
2
$119,545
4
$52,772
APPLICATIONS WITHDRAWN
0
$0
3
$60,023
24
$123,119
2
$80,560
1
$46,530
1
$83,580
FILES CLOSED FOR INCOMPLETENESS
0
$0
1
$131,390
7
$115,086
0
$0
0
$0
0
$0
Aggregated Statistics For Year 2003 (Based on 2 partial tracts)
A) FHA, FSA/RHS & VA Home Purchase Loans
B) Conventional Home Purchase Loans
C) Refinancings
D) Home Improvement Loans
F) Non-occupant Loans on < 5 Family Dwellings (A B C & D)
Number
Average Value
Number
Average Value
Number
Average Value
Number
Average Value
Number
Average Value
LOANS ORIGINATED
2
$111,795
21
$94,510
126
$122,050
4
$24,125
6
$80,847
APPLICATIONS APPROVED, NOT ACCEPTED
0
$0
4
$66,235
9
$107,269
1
$31,020
1
$47,820
APPLICATIONS DENIED
0
$0
7
$96,869
38
$99,866
2
$23,480
2
$91,545
APPLICATIONS WITHDRAWN
0
$0
5
$104,684
30
$120,351
0
$0
0
$0
FILES CLOSED FOR INCOMPLETENESS
0
$0
3
$82,857
7
$142,656
0
$0
2
$171,245
Aggregated Statistics For Year 2002 (Based on 2 partial tracts)
A) FHA, FSA/RHS & VA Home Purchase Loans
B) Conventional Home Purchase Loans
C) Refinancings
D) Home Improvement Loans
F) Non-occupant Loans on < 5 Family Dwellings (A B C & D)
Number
Average Value
Number
Average Value
Number
Average Value
Number
Average Value
Number
Average Value
LOANS ORIGINATED
5
$98,740
22
$104,880
89
$113,238
5
$41,270
3
$139,003
APPLICATIONS APPROVED, NOT ACCEPTED
0
$0
2
$129,885
19
$125,408
1
$15,080
0
$0
APPLICATIONS DENIED
0
$0
7
$103,330
34
$100,845
3
$9,477
1
$93,480
APPLICATIONS WITHDRAWN
0
$0
2
$97,360
21
$126,881
1
$18,520
1
$69,360
FILES CLOSED FOR INCOMPLETENESS
0
$0
0
$0
6
$107,700
0
$0
0
$0
Aggregated Statistics For Year 2001 (Based on 2 partial tracts)
A) FHA, FSA/RHS & VA Home Purchase Loans
B) Conventional Home Purchase Loans
C) Refinancings
D) Home Improvement Loans
F) Non-occupant Loans on < 5 Family Dwellings (A B C & D)
Number
Average Value
Number
Average Value
Number
Average Value
Number
Average Value
Number
Average Value
LOANS ORIGINATED
2
$58,160
22
$89,430
74
$115,484
7
$26,524
6
$73,452
APPLICATIONS APPROVED, NOT ACCEPTED
0
$0
2
$37,050
7
$93,053
0
$0
0
$0
APPLICATIONS DENIED
0
$0
4
$82,822
33
$91,473
4
$14,648
1
$21,540
APPLICATIONS WITHDRAWN
1
$86,590
2
$244,480
22
$102,863
2
$31,450
0
$0
FILES CLOSED FOR INCOMPLETENESS
0
$0
0
$0
3
$97,360
0
$0
0
$0
Aggregated Statistics For Year 2000 (Based on 2 partial tracts)
A) FHA, FSA/RHS & VA Home Purchase Loans
B) Conventional Home Purchase Loans
C) Refinancings
D) Home Improvement Loans
F) Non-occupant Loans on < 5 Family Dwellings (A B C & D)
Number
Average Value
Number
Average Value
Number
Average Value
Number
Average Value
Number
Average Value
LOANS ORIGINATED
4
$100,915
19
$99,787
32
$76,090
8
$10,555
3
$44,373
APPLICATIONS APPROVED, NOT ACCEPTED
0
$0
5
$64,362
10
$63,629
0
$0
0
$0
APPLICATIONS DENIED
1
$56,870
9
$52,844
28
$72,467
3
$36,617
1
$37,050
APPLICATIONS WITHDRAWN
0
$0
3
$111,290
7
$60,004
1
$62,470
0
$0
FILES CLOSED FOR INCOMPLETENESS
0
$0
0
$0
3
$69,790
0
$0
0
$0
Aggregated Statistics For Year 1999 (Based on 1 partial tract)
A) FHA, FSA/RHS & VA Home Purchase Loans
B) Conventional Home Purchase Loans
C) Refinancings
D) Home Improvement Loans
F) Non-occupant Loans on < 5 Family Dwellings (A B C & D)
Detailed PMIC statistics for the following Tracts:0611.00
2002 - 2018 National Fire Incident Reporting System (NFIRS) incidents
According to the data from the years 2002 - 2018 the average number of fires per year is 26. The highest number of fire incidents - 50 took place in 2009, and the least - 3 in 2016. The data has a declining trend.
When looking into fire subcategories, the most incidents belonged to: Outside Fires (56.7%), and Structure Fires (34.6%).
Fire incident types reported to NFIRS in Zip Code 64746


 Nearest zip codes: 64734, 64742, 64078, 64725, 64701, 66053.


 According to the data from the years 2002 - 2018 the average number of fires per year is 26. The highest number of fire incidents - 50 took place in 2009, and the least - 3 in 2016. The data has a declining trend.
 When looking into fire subcategories, the most incidents belonged to: Outside Fires (56.7%), and Structure Fires (34.6%).