Estimated zip code population in 2022: 1,958 Zip code population in 2010: 1,899 Zip code population in 2000: 1,830
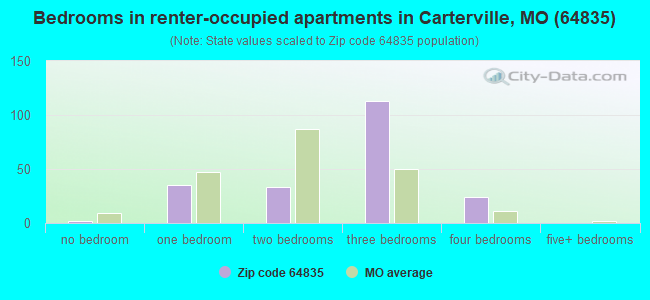
Houses and condos: 786 Renter-occupied apartments: 209
% of renters here:
30%
State:
32%
March 2022 cost of living index in zip code 64835: 82.0 (low, U.S. average is 100)
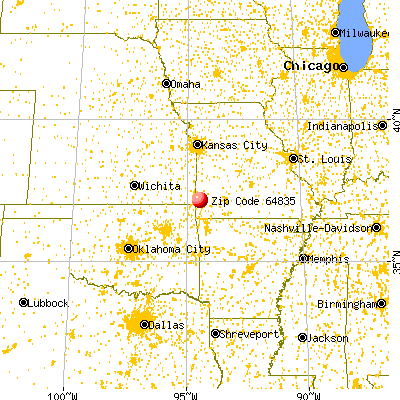
Land area: 2.4 sq. mi. Water area: 0.0 sq. mi.
Population density: 815 people per square mile
(low).
OSM Map
General Map
Google Map
MSN Map
OSM Map
General Map
Google Map
MSN Map
OSM Map
General Map
Google Map
MSN Map
OSM Map
General Map
Google Map
MSN Map
Please wait while loading the map...
Real estate property taxes paid for housing units in 2022:
This zip code:
0.8% ($793)
Missouri:
0.8% ($1,810)
Median real estate property taxes paid for housing units with mortgages in 2022: $870 (0.8%) Median real estate property taxes paid for housing units with no mortgage in 2022: $711 (1.1%)
Business Search- 14 Million verified businesses
Males: 1,124
(57.4%)
Females: 833
(42.6%)
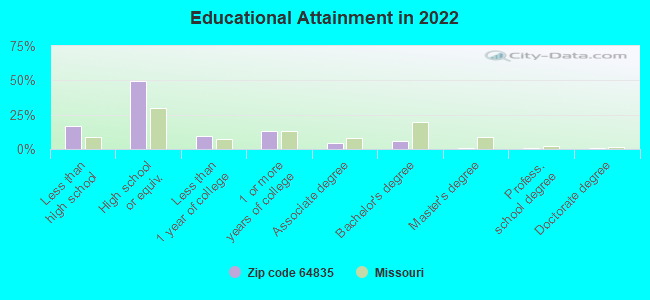
For population 25 years and over in 64835:
High school or higher: 82.1%
Bachelor's degree or higher: 7.0%
Graduate or professional degree: 1.4%
Unemployed: 7.7%
Mean travel time to work (commute): 18.8 minutes
For population 15 years and over in 64835:
Never married: 26.1%
Now married: 45.4%
Separated: 2.6%
Widowed: 7.9%
Divorced: 18.0%
Zip code 64835 compared to state average:
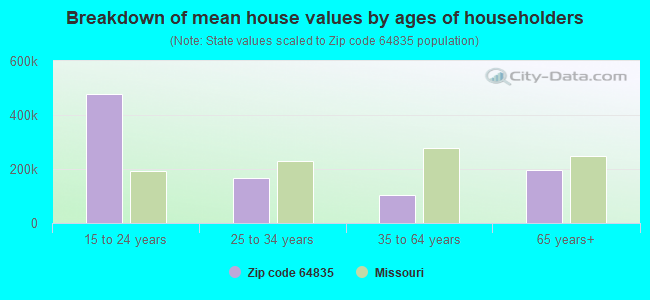
Median house value below state average.
Unemployed percentage above state average.
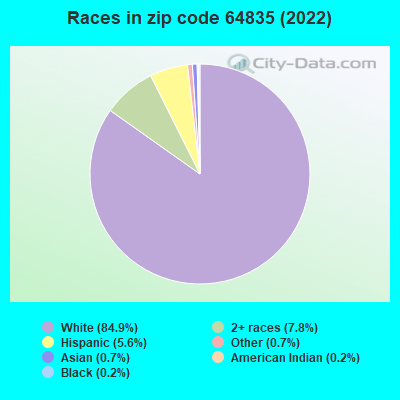
Black race population percentage significantly below state average.
Foreign-born population percentage significantly below state average.
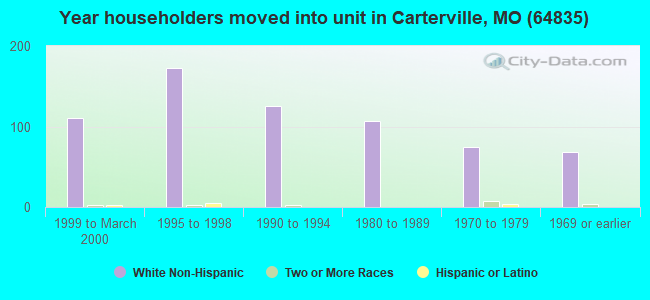
Length of stay since moving in significantly above state average.
Number of college students below state average.
Percentage of population with a bachelor's degree or higher significantly below state average.
Estimated median house/condo value in 2022: $103,278
64835:
$103,278
Missouri:
$221,200
According to our research of Missouri and other state lists, there were 5 registered sex offenders living in 64835 zip code as of May 23, 2024. The ratio of all residents to sex offenders in zip code 64835 is 368 to 1. The ratio of registered sex offenders to all residents in this zip code is near the state average.
Median resident age:
This zip code:
36.4 years
Missouri median age:
39.1 years
Average household size:
This zip code:
2.8 people
Missouri:
2.4 people
Averages for the 2020 tax year for zip code 64835, filed in 2021:
Average Adjusted Gross Income (AGI) in 2020: $36,322 (Individual Income Tax Returns)
Here:
$36,322
State:
$68,151
Salary/wage: $35,468 (reported on 87.7% of returns)
Here:
$35,468
State:
$56,131
(% of AGI for various income ranges: 1189.2% for AGIs below $25k, 3657.9% for AGIs $25k-50k, 5820.0% for AGIs $50k-75k, 6646.7% for AGIs $75k-100k)
Taxable interest for individuals: $289 (reported on 11.1% of returns)
This zip code:
$289
Missouri:
$1,586
(% of AGI for various income ranges: 2.3% for AGIs below $25k, 2.5% for AGIs $25k-50k, 14.0% for AGIs $50k-75k)
Ordinary dividends: $380 (reported on 6.2% of returns)
Here:
$380
State:
$10,947
(% of AGI for various income ranges: 2.7% for AGIs below $25k, 12.0% for AGIs $50k-75k)
Net capital gain/loss in AGI: +$600 (reported on 4.9% of returns)
Here:
+$600
State:
+$18,453
(% of AGI for various income ranges: 10.0% for AGIs $25k-50k)
Profit/loss from business: +$4,333 (reported on 11.1% of returns)
Here:
+$4,333
State:
+$12,260
(% of AGI for various income ranges: 100.0% for AGIs below $25k, 68.3% for AGIs $25k-50k)
Taxable individual retirement arrangement distribution: $9,433 (reported on 3.7% of returns)
64835:
$9,433
Missouri:
$19,719
(% of AGI for various income ranges: 108.8% for AGIs below $25k)
Earned income credit: $2,548 (reported on 28.4% of returns)
Here:
$2,548
State:
$2,315
(% of AGI for various income ranges: 131.9% for AGIs below $25k, 101.2% for AGIs $25k-50k)
Percentage of individuals using paid preparers for their 2020 taxes: 95.1%
Here:
95%
State:
93%
(% for various income ranges: 94.1% for AGIs below $25k, 96.3% for AGIs $25k-50k, 91.7% for AGIs $50k-75k, 100.0% for AGIs $75k-100k, 100.0% for AGIs $100k-200k)
Averages for the 2012 tax year for zip code 64835, filed in 2013:
Average Adjusted Gross Income (AGI) in 2012: $30,664 (Individual Income Tax Returns)
Here:
$30,664
State:
$55,896
Salary/wage: $28,212 (reported on 93.8% of returns)
Here:
$28,212
State:
$46,205
(% of AGI for various income ranges: 87.3% for AGIs below $25k, 89.0% for AGIs $25k-50k, 87.9% for AGIs $50k-75k, 76.9% for AGIs $75k-100k)
Taxable interest for individuals: $150 (reported on 12.5% of returns)
This zip code:
$150
Missouri:
$1,559
(% of AGI for various income ranges: 0.1% for AGIs below $25k)
Ordinary dividends: $217 (reported on 7.5% of returns)
Here:
$217
State:
$7,410
Net capital gain/loss in AGI: +$1,025 (reported on 5.0% of returns)
Here:
+$1,025
State:
+$11,579
Profit/loss from business: +$5,457 (reported on 8.8% of returns)
Here:
+$5,457
State:
+$11,688
Taxable individual retirement arrangement distribution: $6,633 (reported on 3.8% of returns)
64835:
$6,633
Missouri:
$14,773
Total itemized deductions: $17,986 (27% of AGI, reported on 8.8% of returns)
Here:
$17,986
State:
$22,730
Here:
26.8% of AGI
State:
19.2% of AGI
Charity contributions: $3,275 (reported on 5.0% of returns)
Here:
$3,275
State:
$4,745
Taxes paid: $3,543 (reported on 8.8% of returns)
64835:
$3,543
State:
$8,399
Earned income credit: $2,404 (reported on 32.5% of returns)
Here:
$2,404
State:
$2,288
(% of AGI for various income ranges: 8.5% for AGIs below $25k, 1.8% for AGIs $25k-50k)
Percentage of individuals using paid preparers for their 2012 taxes: 47.5%
Here:
48%
State:
55%
(% for various income ranges: 42.9% for AGIs below $25k, 50.0% for AGIs $25k-50k, 60.0% for AGIs $50k-75k, 50.0% for AGIs $75k-100k)
Averages for the 2004 tax year for zip code 64835, filed in 2005:
Average Adjusted Gross Income (AGI) in 2004: $26,216 (Individual Income Tax Returns)
Here:
$26,216
State:
$44,591
Salary/wage: $24,719 (reported on 91.6% of returns)
Here:
$24,719
State:
$38,941
(% of AGI for various income ranges: 76.7% for AGIs below $10k, 87.9% for AGIs $10k-25k, 86.8% for AGIs $25k-50k, 94.6% for AGIs $50k-75k, 66.1% for AGIs $75k-100k)
Taxable interest for individuals: $394 (reported on 20.7% of returns)
This zip code:
$394
Missouri:
$1,801
(% of AGI for various income ranges: 1.9% for AGIs below $10k, 0.4% for AGIs $10k-25k, 0.3% for AGIs $25k-50k, 0.1% for AGIs $50k-75k)
Taxable dividends: $143 (reported on 9.4% of returns)
Here:
$143
State:
$3,677
Net capital gain/loss: +$2,538 (reported on 5.2% of returns)
Here:
+$2,538
State:
+$8,915
Profit/loss from business: +$5,775 (reported on 13.7% of returns)
Here:
+$5,775
State:
+$9,793
Total itemized deductions: $12,015 (24% of AGI, reported on 9.1% of returns)
Here:
$12,015
State:
$18,261
Here:
24.3% of AGI
State:
20.5% of AGI
Charity contributions deductions: $3,102 (6% of AGI, reported on 6.6% of returns)
Here:
$3,102
State:
$3,665
Here:
6.1% of AGI
State:
3.9% of AGI
Total tax: $2,505 (reported on 67.6% of returns)
64835:
$2,505
State:
$6,999
(% of AGI for various income ranges: 2.7% for AGIs below $10k, 3.8% for AGIs $10k-25k, 5.5% for AGIs $25k-50k, 7.7% for AGIs $50k-75k, 15.1% for AGIs $75k-100k)
Earned income credit: $1,799 (reported on 29.3% of returns)
Here:
$1,799
State:
$1,728
Percentage of individuals using paid preparers for their 2004 taxes: 62.0%
Here:
62%
State:
62%
(% for various income ranges: 52.2% for AGIs below $10k, 67.1% for AGIs $10k-25k, 63.3% for AGIs $25k-50k, 59.2% for AGIs $50k-75k, 63.2% for AGIs $75k-100k)
Household received Food Stamps/SNAP in the past 12 months: 153 Household did not receive Food Stamps/SNAP in the past 12 months: 555
Women who had a birth in the past 12 months: 24 (15 now married, 8 unmarried) Women who did not have a birth in the past 12 months: 395 (225 now married, 168 unmarried)
Housing units in zip code 64835 with a mortgage: 283 (17 second mortgage, 7 both second mortgage and home equity loan) Median monthly owner costs for units with a mortgage: $983 Median monthly owner costs for units without a mortgage: $420
Residents with income below the poverty level in 2022:
This zip code:
25.1%
Whole state:
13.2%
Residents with income below 50% of the poverty level in 2022:
This zip code:
16.8%
Whole state:
6.8%
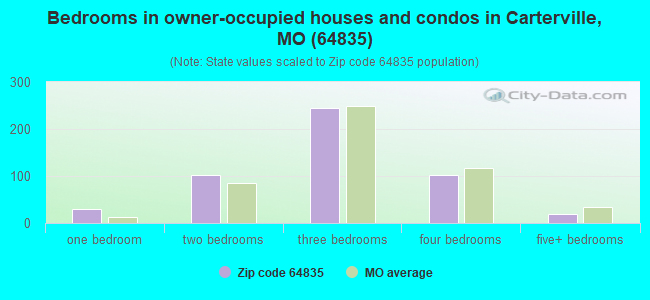
Median number of rooms in houses and condos:
Here:
6.1
State:
6.4
Median number of rooms in apartments:
Here:
5.7
State:
4.4
Notable locations in this zip code not listed on our city pages
Size of family households: 189 2-persons, 89 3-persons, 109 4-persons, 75 5-persons, 33 6-persons, 14 7-or-more-persons
Size of nonfamily households: 160 1-person, 29 2-persons, 4 3-persons
275 married couples with children.
226 single-parent households (95 men, 131 women).
97.0% of residents of 64835 zip code speak English at home.
1.7% of residents speak Spanish at home (75% very well, 19% well, 6% not well).
0.2% of residents speak other Indo-European language at home (100% very well).
0.6% of residents speak Asian or Pacific Island language at home (50% very well, 50% well).
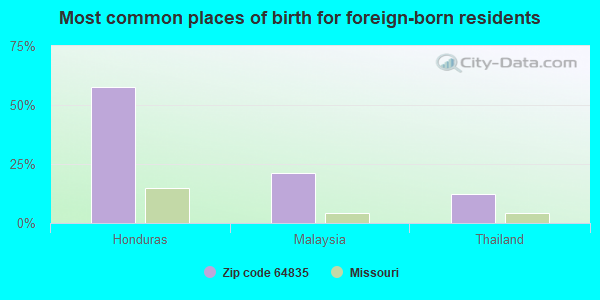
Foreign born population: 33 (1.7%) (38.5% of them are naturalized citizens)
This zip code:
1.7%
Whole state:
4.1%
58%Honduras
21%Malaysia
12%Thailand
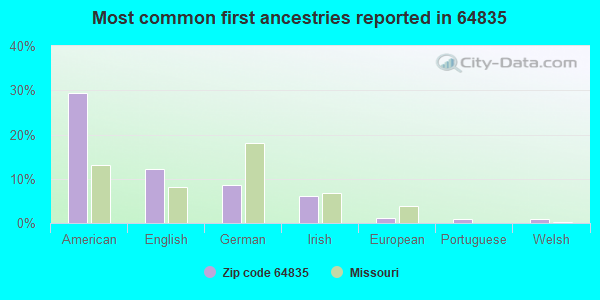
29%American
12%English
8%German
6%Irish
1%European
1%Portuguese
1%Welsh
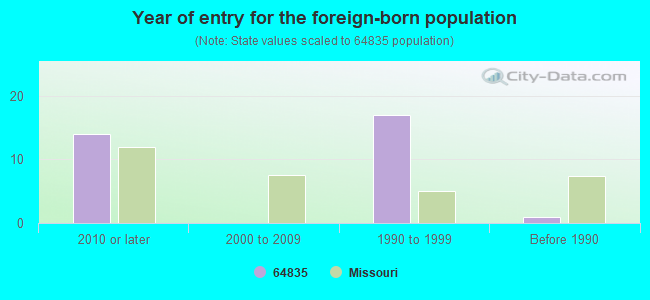
Year of entry for the foreign-born population
142010 or later
02000 to 2009
171990 to 1999
1Before 1990
Facilities with environmental interests located in this zip code:
JEFF FLEMING (200 N DAVEY in CARTERVILLE, MO)
STATE MASTER (Missouri monitoring and compilance) - PCS-MOR80C411, NPDES NON-MAJOR National Pollutant Discharge Elimination System NON-MAJOR (Tracking pollutant discharge elimination systems) - permit Business SIC classification: PREPARED FEEDS AND FEED INGREDIENTS FOR ANIMALS AND FOWLS, EXCEPT DOGS AND CATS; TERMINAL AND JOINT TERMINAL MAINTENANCE FACILITIES FOR MOTOR FREIGHT TRANSPORTATION Alternative names: FLEMING GREASE CO.
RONNIE SMITH (TENNESSEE AVE in CARTERVILLE, MO)
National Pollutant Discharge Elimination System NON-MAJOR (Tracking pollutant discharge elimination systems) - permit Business SIC classification: HEAVY CONSTRUCTION Alternative names: HOLLY HILL SUBDIVISION
Housing units lacking complete plumbing facilities: 1.5% Housing units lacking complete kitchen facilities: 1.8%
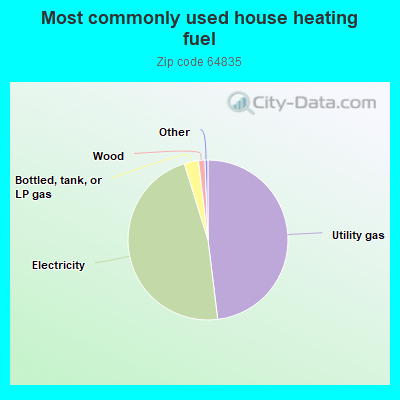
48.2%Utility gas
47.3%Electricity
2.9%Bottled, tank, or LP gas
1.3%Wood
Population in 1990: 2,397.
Place of birth for U.S.-born residents:
This state: 1,339
Northeast: 6
Midwest: 176
South: 151
West: 257
56% of the 64835 zip code residents lived in the same house 5 years ago. Out of people who lived in different houses, 72% lived in this county. Out of people who lived in different counties, 50% lived in Missouri.
93% of the 64835 zip code residents lived in the same house 1 year ago. Out of people who lived in different houses, 89% moved from this county. Out of people who lived in different houses, 6% moved from different county within same state. Out of people who lived in different houses, 2% moved from different state.
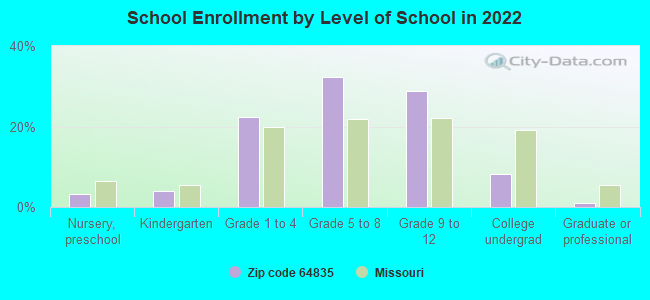
Private vs. public school enrollment:
Students in private schools in grades 1 to 8 (elementary and middle school): 15
Here:
5.3%
Missouri:
15.4%
Students in private schools in grades 9 to 12 (high school): 1
Here:
0.8%
Missouri:
13.9%
Students in private undergraduate colleges: 2
Here:
5.8%
Missouri:
22.6%
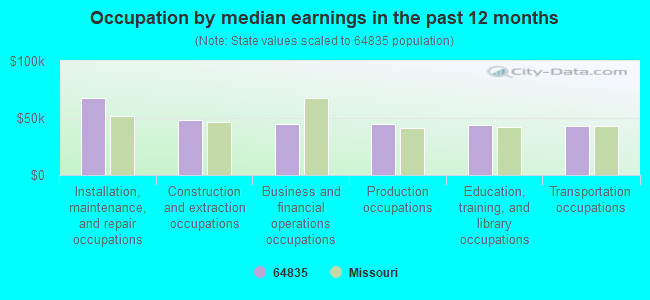
Occupation by median earnings in the past 12 months ($)
67,715Installation, maintenance, and repair occupations
48,220Construction and extraction occupations
45,068Business and financial operations occupations
44,945Production occupations
43,878Education, training, and library occupations
43,076Transportation occupations
Top industries in this zip code by the number of employees in 2005:
Utilities: Other Electric Power Generation (20-49 employees: 1 establishment)
Construction: Electrical Contractors (10-19: 1)
Wholesale Trade: Other Electronic Parts and Equipment Merchant Wholesalers (10-19: 1)
Other Services (except Public Administration): Religious Organizations (5-9: 2)
Wholesale Trade: Industrial and Personal Service Paper Merchant Wholesalers (5-9: 1)
Home Mortgage Disclosure Act Aggregated Statistics For Year 2009 (Based on 2 partial tracts)
A) FHA, FSA/RHS & VA Home Purchase Loans
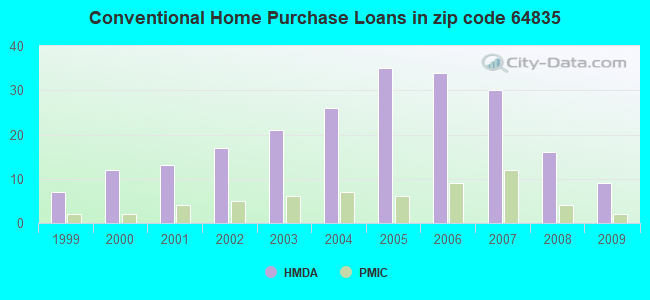
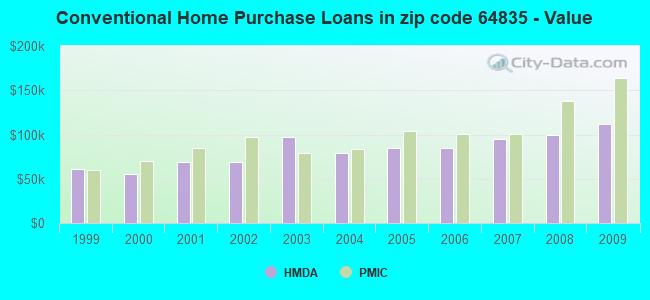
B) Conventional Home Purchase Loans
C) Refinancings
D) Home Improvement Loans
F) Non-occupant Loans on < 5 Family Dwellings (A B C & D)
G) Loans On Manufactured Home Dwelling (A B C & D)
Number
Average Value
Number
Average Value
Number
Average Value
Number
Average Value
Number
Average Value
Number
Average Value
LOANS ORIGINATED
15
$113,434
9
$111,889
34
$139,887
4
$22,815
4
$99,062
2
$24,310
APPLICATIONS APPROVED, NOT ACCEPTED
0
$0
0
$0
2
$107,525
0
$0
0
$0
0
$0
APPLICATIONS DENIED
2
$105,470
2
$62,085
12
$110,688
2
$32,070
0
$0
1
$66,200
APPLICATIONS WITHDRAWN
1
$111,450
1
$163,630
11
$102,153
1
$64,330
0
$0
1
$46,380
FILES CLOSED FOR INCOMPLETENESS
1
$68,630
0
$0
1
$97,050
0
$0
0
$0
0
$0
Aggregated Statistics For Year 2008 (Based on 2 partial tracts)
A) FHA, FSA/RHS & VA Home Purchase Loans
B) Conventional Home Purchase Loans
C) Refinancings
D) Home Improvement Loans
F) Non-occupant Loans on < 5 Family Dwellings (A B C & D)
G) Loans On Manufactured Home Dwelling (A B C & D)
Number
Average Value
Number
Average Value
Number
Average Value
Number
Average Value
Number
Average Value
Number
Average Value
LOANS ORIGINATED
9
$105,738
16
$99,239
25
$114,676
4
$21,692
5
$62,496
2
$38,520
APPLICATIONS APPROVED, NOT ACCEPTED
0
$0
0
$0
2
$142,775
0
$0
0
$0
0
$0
APPLICATIONS DENIED
1
$109,770
5
$75,324
16
$139,922
5
$48,956
0
$0
3
$72,743
APPLICATIONS WITHDRAWN
1
$70,130
2
$81,160
7
$116,047
1
$38,150
0
$0
0
$0
FILES CLOSED FOR INCOMPLETENESS
1
$91,630
0
$0
2
$86,115
0
$0
0
$0
0
$0
Aggregated Statistics For Year 2007 (Based on 2 partial tracts)
A) FHA, FSA/RHS & VA Home Purchase Loans
B) Conventional Home Purchase Loans
C) Refinancings
D) Home Improvement Loans
F) Non-occupant Loans on < 5 Family Dwellings (A B C & D)
G) Loans On Manufactured Home Dwelling (A B C & D)
Number
Average Value
Number
Average Value
Number
Average Value
Number
Average Value
Number
Average Value
Number
Average Value
LOANS ORIGINATED
4
$121,738
30
$94,759
27
$112,498
5
$60,924
7
$65,957
3
$56,350
APPLICATIONS APPROVED, NOT ACCEPTED
0
$0
3
$71,870
5
$96,530
0
$0
0
$0
0
$0
APPLICATIONS DENIED
1
$148,290
8
$78,728
22
$98,209
7
$38,763
1
$76,670
5
$58,568
APPLICATIONS WITHDRAWN
0
$0
2
$92,565
7
$98,977
2
$37,585
0
$0
1
$31,600
FILES CLOSED FOR INCOMPLETENESS
0
$0
1
$123,790
4
$93,592
0
$0
0
$0
0
$0
Aggregated Statistics For Year 2006 (Based on 2 partial tracts)
A) FHA, FSA/RHS & VA Home Purchase Loans
B) Conventional Home Purchase Loans
C) Refinancings
D) Home Improvement Loans
F) Non-occupant Loans on < 5 Family Dwellings (A B C & D)
G) Loans On Manufactured Home Dwelling (A B C & D)
Number
Average Value
Number
Average Value
Number
Average Value
Number
Average Value
Number
Average Value
Number
Average Value
LOANS ORIGINATED
5
$95,034
34
$84,816
26
$102,562
8
$31,744
8
$71,878
5
$43,310
APPLICATIONS APPROVED, NOT ACCEPTED
0
$0
3
$87,017
3
$53,857
0
$0
0
$0
0
$0
APPLICATIONS DENIED
0
$0
11
$70,312
23
$96,590
7
$31,683
1
$54,230
3
$51,673
APPLICATIONS WITHDRAWN
0
$0
4
$83,308
14
$89,746
2
$63,955
1
$71,430
0
$0
FILES CLOSED FOR INCOMPLETENESS
0
$0
1
$26,740
3
$85,273
0
$0
0
$0
0
$0
Aggregated Statistics For Year 2005 (Based on 2 partial tracts)
A) FHA, FSA/RHS & VA Home Purchase Loans
B) Conventional Home Purchase Loans
C) Refinancings
D) Home Improvement Loans
F) Non-occupant Loans on < 5 Family Dwellings (A B C & D)
G) Loans On Manufactured Home Dwelling (A B C & D)
Number
Average Value
Number
Average Value
Number
Average Value
Number
Average Value
Number
Average Value
Number
Average Value
LOANS ORIGINATED
4
$85,600
35
$85,213
32
$89,076
6
$44,693
8
$45,628
4
$32,025
APPLICATIONS APPROVED, NOT ACCEPTED
0
$0
2
$80,410
3
$84,650
1
$18,140
0
$0
0
$0
APPLICATIONS DENIED
1
$120,610
7
$46,803
26
$76,397
6
$20,882
1
$31,420
3
$33,350
APPLICATIONS WITHDRAWN
0
$0
4
$105,655
16
$84,407
2
$64,795
0
$0
0
$0
FILES CLOSED FOR INCOMPLETENESS
0
$0
0
$0
1
$85,080
0
$0
0
$0
0
$0
Aggregated Statistics For Year 2004 (Based on 2 partial tracts)
A) FHA, FSA/RHS & VA Home Purchase Loans
B) Conventional Home Purchase Loans
C) Refinancings
D) Home Improvement Loans
F) Non-occupant Loans on < 5 Family Dwellings (A B C & D)
G) Loans On Manufactured Home Dwelling (A B C & D)
Number
Average Value
Number
Average Value
Number
Average Value
Number
Average Value
Number
Average Value
Number
Average Value
LOANS ORIGINATED
8
$85,786
26
$79,345
32
$81,070
6
$26,585
7
$58,584
4
$50,162
APPLICATIONS APPROVED, NOT ACCEPTED
0
$0
2
$62,740
6
$87,235
1
$13,460
0
$0
1
$36,090
APPLICATIONS DENIED
1
$95,930
5
$67,880
22
$80,486
4
$36,840
2
$76,205
3
$39,270
APPLICATIONS WITHDRAWN
0
$0
3
$67,133
16
$82,923
1
$14,770
1
$47,120
1
$33,100
FILES CLOSED FOR INCOMPLETENESS
0
$0
0
$0
4
$107,572
0
$0
0
$0
0
$0
Aggregated Statistics For Year 2003 (Based on 2 partial tracts)
A) FHA, FSA/RHS & VA Home Purchase Loans
B) Conventional Home Purchase Loans
C) Refinancings
D) Home Improvement Loans
F) Non-occupant Loans on < 5 Family Dwellings (A B C & D)
Number
Average Value
Number
Average Value
Number
Average Value
Number
Average Value
Number
Average Value
LOANS ORIGINATED
5
$84,000
21
$96,670
49
$82,082
4
$27,395
8
$108,858
APPLICATIONS APPROVED, NOT ACCEPTED
0
$0
2
$45,630
6
$66,073
1
$14,210
1
$26,550
APPLICATIONS DENIED
1
$63,390
7
$53,349
21
$75,592
2
$31,605
1
$56,290
APPLICATIONS WITHDRAWN
1
$48,620
2
$85,365
10
$84,599
1
$9,910
2
$50,960
FILES CLOSED FOR INCOMPLETENESS
0
$0
0
$0
1
$143,430
0
$0
0
$0
Aggregated Statistics For Year 2002 (Based on 2 partial tracts)
A) FHA, FSA/RHS & VA Home Purchase Loans
B) Conventional Home Purchase Loans
C) Refinancings
D) Home Improvement Loans
F) Non-occupant Loans on < 5 Family Dwellings (A B C & D)
Number
Average Value
Number
Average Value
Number
Average Value
Number
Average Value
Number
Average Value
LOANS ORIGINATED
6
$73,180
17
$69,168
38
$80,956
3
$41,950
6
$47,747
APPLICATIONS APPROVED, NOT ACCEPTED
0
$0
2
$100,515
4
$61,010
0
$0
0
$0
APPLICATIONS DENIED
1
$52,550
5
$51,500
19
$62,153
3
$4,800
1
$41,140
APPLICATIONS WITHDRAWN
0
$0
2
$82,560
12
$87,392
1
$26,180
1
$72,560
FILES CLOSED FOR INCOMPLETENESS
0
$0
0
$0
2
$92,470
0
$0
0
$0
Aggregated Statistics For Year 2001 (Based on 2 partial tracts)
A) FHA, FSA/RHS & VA Home Purchase Loans
B) Conventional Home Purchase Loans
C) Refinancings
D) Home Improvement Loans
F) Non-occupant Loans on < 5 Family Dwellings (A B C & D)
Number
Average Value
Number
Average Value
Number
Average Value
Number
Average Value
Number
Average Value
LOANS ORIGINATED
6
$68,722
13
$69,319
27
$72,078
3
$14,897
4
$33,145
APPLICATIONS APPROVED, NOT ACCEPTED
0
$0
1
$63,210
2
$45,630
0
$0
0
$0
APPLICATIONS DENIED
1
$72,370
9
$42,761
13
$52,676
3
$21,630
0
$0
APPLICATIONS WITHDRAWN
1
$55,730
2
$125,385
6
$60,837
1
$34,030
0
$0
FILES CLOSED FOR INCOMPLETENESS
0
$0
0
$0
2
$57,220
0
$0
0
$0
Aggregated Statistics For Year 2000 (Based on 2 partial tracts)
A) FHA, FSA/RHS & VA Home Purchase Loans
B) Conventional Home Purchase Loans
C) Refinancings
D) Home Improvement Loans
F) Non-occupant Loans on < 5 Family Dwellings (A B C & D)
Number
Average Value
Number
Average Value
Number
Average Value
Number
Average Value
Number
Average Value
LOANS ORIGINATED
4
$51,238
12
$55,305
12
$55,617
4
$20,335
3
$61,273
APPLICATIONS APPROVED, NOT ACCEPTED
0
$0
1
$46,560
4
$54,650
1
$9,160
0
$0
APPLICATIONS DENIED
0
$0
6
$38,303
10
$51,219
2
$16,080
1
$17,390
APPLICATIONS WITHDRAWN
0
$0
2
$43,475
4
$51,658
0
$0
0
$0
FILES CLOSED FOR INCOMPLETENESS
0
$0
0
$0
1
$35,340
0
$0
0
$0
Aggregated Statistics For Year 1999 (Based on 1 partial tract)
A) FHA, FSA/RHS & VA Home Purchase Loans
B) Conventional Home Purchase Loans
C) Refinancings
D) Home Improvement Loans
F) Non-occupant Loans on < 5 Family Dwellings (A B C & D)
Detailed PMIC statistics for the following Tracts:0115.00
2003 - 2018 National Fire Incident Reporting System (NFIRS) incidents
According to the data from the years 2003 - 2018 the average number of fire incidents per year is 20. The highest number of reported fires - 67 took place in 2017, and the least - 2 in 2003. The data has an increasing trend.
When looking into fire subcategories, the most incidents belonged to: Outside Fires (46.5%), and Structure Fires (43.7%).
Fire incident types reported to NFIRS in Zip Code 64835


 Nearest zip codes: 64870, 64801, 64841, 64830, 64857, 64849.


 According to the data from the years 2003 - 2018 the average number of fire incidents per year is 20. The highest number of reported fires - 67 took place in 2017, and the least - 2 in 2003. The data has an increasing trend.
 When looking into fire subcategories, the most incidents belonged to: Outside Fires (46.5%), and Structure Fires (43.7%).