Estimated zip code population in 2022: 1,259 Zip code population in 2010: 1,350 Zip code population in 2000: 1,407
Houses and condos: 595 Renter-occupied apartments: 94
% of renters here:
17%
State:
32%
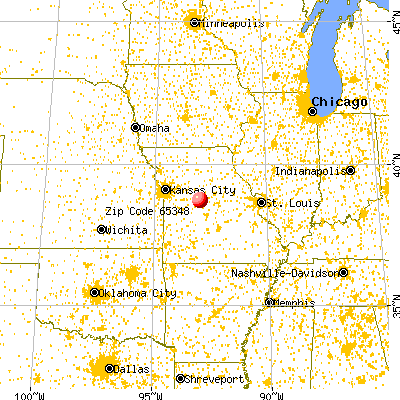
March 2022 cost of living index in zip code 65348: 77.5 (low, U.S. average is 100)
Land area: 73.8 sq. mi. Water area: 0.0 sq. mi.
Population density: 17 people per square mile
(very low).
OSM Map
General Map
Google Map
MSN Map
OSM Map
General Map
Google Map
MSN Map
OSM Map
General Map
Google Map
MSN Map
OSM Map
General Map
Google Map
MSN Map
Please wait while loading the map...
Real estate property taxes paid for housing units in 2022:
This zip code:
0.5% ($1,006)
Missouri:
0.8% ($1,810)
Median real estate property taxes paid for housing units with mortgages in 2022: $912 (0.4%) Median real estate property taxes paid for housing units with no mortgage in 2022: $1,165 (0.6%)
Business Search- 14 Million verified businesses
Males: 603
(47.9%)
Females: 656
(52.1%)
For population 25 years and over in 65348:
High school or higher: 85.4%
Bachelor's degree or higher: 9.0%
Graduate or professional degree: 2.8%
Unemployed: 3.3%
Mean travel time to work (commute): 32.8 minutes
For population 15 years and over in 65348:
Never married: 19.0%
Now married: 54.2%
Separated: 0.9%
Widowed: 4.1%
Divorced: 21.7%
Zip code 65348 compared to state average:
Black race population percentage significantly below state average.
Hispanic race population percentage significantly below state average.
Renting percentage below state average.
Length of stay since moving in above state average.
Number of college students below state average.
Percentage of population with a bachelor's degree or higher significantly below state average.
Averages for the 2020 tax year for zip code 65348, filed in 2021:
Average Adjusted Gross Income (AGI) in 2020: $52,439 (Individual Income Tax Returns)
Here:
$52,439
State:
$68,151
Salary/wage: $46,924 (reported on 78.9% of returns)
Here:
$46,924
State:
$56,131
(% of AGI for various income ranges: 1256.7% for AGIs below $25k, 3420.8% for AGIs $25k-50k, 6204.3% for AGIs $50k-75k, 12076.7% for AGIs $75k-100k, 18842.5% for AGIs $100k-200k)
Taxable interest for individuals: $1,288 (reported on 28.1% of returns)
This zip code:
$1,288
Missouri:
$1,586
(% of AGI for various income ranges: 20.0% for AGIs below $25k, 36.7% for AGIs $25k-50k, 80.0% for AGIs $50k-75k, 205.0% for AGIs $100k-200k)
Ordinary dividends: $683 (reported on 10.5% of returns)
Here:
$683
State:
$10,947
(% of AGI for various income ranges: 20.8% for AGIs below $25k, 53.3% for AGIs $75k-100k)
Net capital gain/loss in AGI: +$3,071 (reported on 12.3% of returns)
Here:
+$3,071
State:
+$18,453
(% of AGI for various income ranges: 34.2% for AGIs below $25k, 85.7% for AGIs $50k-75k, 285.0% for AGIs $100k-200k)
Profit/loss from business: +$8,143 (reported on 12.3% of returns)
Here:
+$8,143
State:
+$12,260
(% of AGI for various income ranges: 301.7% for AGIs below $25k, 297.1% for AGIs $50k-75k)
Taxable individual retirement arrangement distribution: $9,875 (reported on 7.0% of returns)
65348:
$9,875
Missouri:
$19,719
(% of AGI for various income ranges: 564.3% for AGIs $50k-75k)
Earned income credit: $2,389 (reported on 15.8% of returns)
Here:
$2,389
State:
$2,315
(% of AGI for various income ranges: 90.8% for AGIs below $25k, 88.3% for AGIs $25k-50k)
Percentage of individuals using paid preparers for their 2020 taxes: 93.0%
Here:
93%
State:
93%
(% for various income ranges: 88.9% for AGIs below $25k, 93.3% for AGIs $25k-50k, 100.0% for AGIs $50k-75k, 100.0% for AGIs $75k-100k, 88.9% for AGIs $100k-200k)
Averages for the 2012 tax year for zip code 65348, filed in 2013:
Average Adjusted Gross Income (AGI) in 2012: $39,782 (Individual Income Tax Returns)
Here:
$39,782
State:
$55,896
Salary/wage: $37,502 (reported on 80.4% of returns)
Here:
$37,502
State:
$46,205
(% of AGI for various income ranges: 73.7% for AGIs below $25k, 75.9% for AGIs $25k-50k, 85.6% for AGIs $50k-75k, 77.7% for AGIs $75k-100k, 60.9% for AGIs $100k-200k)
Taxable interest for individuals: $1,094 (reported on 32.1% of returns)
This zip code:
$1,094
Missouri:
$1,559
(% of AGI for various income ranges: 1.9% for AGIs below $25k, 0.3% for AGIs $25k-50k, 0.8% for AGIs $50k-75k, 1.7% for AGIs $75k-100k)
Ordinary dividends: $783 (reported on 10.7% of returns)
Here:
$783
State:
$7,410
Net capital gain/loss in AGI: +$4,657 (reported on 12.5% of returns)
Here:
+$4,657
State:
+$11,579
Profit/loss from business: +$7,411 (reported on 16.1% of returns)
Here:
+$7,411
State:
+$11,688
(% of AGI for various income ranges: 9.1% for AGIs below $25k, 5.0% for AGIs $25k-50k, 2.3% for AGIs $50k-75k)
Taxable individual retirement arrangement distribution: $5,900 (reported on 7.1% of returns)
65348:
$5,900
Missouri:
$14,773
Total itemized deductions: $19,040 (26% of AGI, reported on 17.9% of returns)
Here:
$19,040
State:
$22,730
Here:
26.2% of AGI
State:
19.2% of AGI
(% of AGI for various income ranges: 7.2% for AGIs $25k-50k, 15.2% for AGIs $50k-75k, 18.7% for AGIs $100k-200k)
Charity contributions: $2,286 (reported on 12.5% of returns)
Here:
$2,286
State:
$4,745
Taxes paid: $4,550 (reported on 17.9% of returns)
65348:
$4,550
State:
$8,399
(% of AGI for various income ranges: 1.4% for AGIs $25k-50k, 3.8% for AGIs $50k-75k, 4.7% for AGIs $100k-200k)
Earned income credit: $2,327 (reported on 19.6% of returns)
Here:
$2,327
State:
$2,288
(% of AGI for various income ranges: 5.7% for AGIs below $25k, 1.6% for AGIs $25k-50k)
Percentage of individuals using paid preparers for their 2012 taxes: 67.9%
Here:
68%
State:
55%
(% for various income ranges: 65.2% for AGIs below $25k, 66.7% for AGIs $25k-50k, 66.7% for AGIs $50k-75k, 83.3% for AGIs $75k-100k, 66.7% for AGIs $100k-200k)
Averages for the 2004 tax year for zip code 65348, filed in 2005:
Average Adjusted Gross Income (AGI) in 2004: $32,280 (Individual Income Tax Returns)
Here:
$32,280
State:
$44,591
Salary/wage: $30,754 (reported on 82.4% of returns)
Here:
$30,754
State:
$38,941
(% of AGI for various income ranges: 71.6% for AGIs below $10k, 73.7% for AGIs $10k-25k, 81.1% for AGIs $25k-50k, 84.9% for AGIs $50k-75k, 112.8% for AGIs $75k-100k)
Taxable interest for individuals: $1,076 (reported on 39.5% of returns)
This zip code:
$1,076
Missouri:
$1,801
(% of AGI for various income ranges: 6.1% for AGIs below $10k, 2.2% for AGIs $10k-25k, 0.9% for AGIs $25k-50k, 1.1% for AGIs $50k-75k, 1.5% for AGIs $75k-100k)
Taxable dividends: $303 (reported on 13.4% of returns)
Here:
$303
State:
$3,677
(% of AGI for various income ranges: 0.1% for AGIs $10k-25k, 0.1% for AGIs $25k-50k, 0.2% for AGIs $50k-75k, 0.2% for AGIs $75k-100k)
Net capital gain/loss: +$1,966 (reported on 15.5% of returns)
Here:
+$1,966
State:
+$8,915
(% of AGI for various income ranges: 1.7% for AGIs below $10k, 2.8% for AGIs $10k-25k, 0.7% for AGIs $25k-50k, 0.2% for AGIs $50k-75k, 1.3% for AGIs $75k-100k)
Profit/loss from business: +$5,918 (reported on 19.4% of returns)
Here:
+$5,918
State:
+$9,793
(% of AGI for various income ranges: 10.4% for AGIs below $10k, 8.9% for AGIs $10k-25k, 4.5% for AGIs $25k-50k, 1.6% for AGIs $50k-75k)
IRA payment deduction: $2,091 (reported on 1.9% of returns)
65348:
$2,091
Missouri:
$2,972
Total itemized deductions: $14,518 (23% of AGI, reported on 15.0% of returns)
Here:
$14,518
State:
$18,261
Here:
23.1% of AGI
State:
20.5% of AGI
(% of AGI for various income ranges: 4.9% for AGIs $10k-25k, 5.7% for AGIs $25k-50k, 7.3% for AGIs $50k-75k, 8.9% for AGIs $75k-100k, 11.3% for AGIs over 100k)
Charity contributions deductions: $2,317 (3% of AGI, reported on 10.6% of returns)
Here:
$2,317
State:
$3,665
Here:
3.3% of AGI
State:
3.9% of AGI
Total tax: $3,422 (reported on 73.2% of returns)
65348:
$3,422
State:
$6,999
(% of AGI for various income ranges: 3.1% for AGIs below $10k, 4.0% for AGIs $10k-25k, 5.8% for AGIs $25k-50k, 8.2% for AGIs $50k-75k, 11.4% for AGIs $75k-100k, 16.8% for AGIs over 100k)
Earned income credit: $1,660 (reported on 18.7% of returns)
Here:
$1,660
State:
$1,728
Percentage of individuals using paid preparers for their 2004 taxes: 71.6%
Here:
72%
State:
62%
(% for various income ranges: 64.8% for AGIs below $10k, 71.5% for AGIs $10k-25k, 74.5% for AGIs $25k-50k, 75.0% for AGIs $50k-75k, 67.9% for AGIs $75k-100k, 90.9% for AGIs over 100k)
Household received Food Stamps/SNAP in the past 12 months: 47 Household did not receive Food Stamps/SNAP in the past 12 months: 492
Women who had a birth in the past 12 months: 17 (16 now married, 0 unmarried) Women who did not have a birth in the past 12 months: 230 (110 now married, 118 unmarried)
Housing units in zip code 65348 with a mortgage: 249 (5 second mortgage, 5 both second mortgage and home equity loan) Median monthly owner costs for units with a mortgage: $1,125 Median monthly owner costs for units without a mortgage: $410
Residents with income below the poverty level in 2022:
This zip code:
16.0%
Whole state:
13.2%
Residents with income below 50% of the poverty level in 2022:
This zip code:
7.4%
Whole state:
6.8%
Median number of rooms in houses and condos:
Here:
5.9
State:
6.4
Median number of rooms in apartments:
Here:
6.1
State:
4.4
Notable locations in this zip code not listed on our city pages
Streams, rivers, and creeks: Clear Branch (A), Long Branch (B), Johnson Branch (C), Pipkin Branch (D), Richland Creek (E), Otter Creek (F), Harlan Branch (G), Flat Creek (H). Display/hide their locations on the map
Size of family households: 164 2-persons, 105 3-persons, 54 4-persons, 15 5-persons, 1 6-persons, 4 7-or-more-persons
Size of nonfamily households: 160 1-person, 30 2-persons, 2 4-persons
192 married couples with children.
96 single-parent households (43 men, 53 women).
93.5% of residents of 65348 zip code speak English at home.
2.9% of residents speak other Indo-European language at home (15% very well, 85% well).
3.6% of residents speak Asian or Pacific Island language at home (100% not well).
Foreign born population: 49 (3.9%) (92.1% of them are naturalized citizens)
This zip code:
3.9%
Whole state:
4.1%
106%Indonesia
8%United Kingdom, excluding England and Scotland
6%Sweden
4%France
31%German
23%English
13%American
2%Irish
2%European
2%Italian
1%Lebanese
Year of entry for the foreign-born population
02010 or later
32000 to 2009
21990 to 1999
43Before 1990
Facilities with environmental interests located in this zip code:
OTTERVILLE (OLD HWY 50 in OTTERVILLE, MO)
STATE MASTER (Missouri monitoring and compilance) - PCS-MO0101125, NPDES NON-MAJOR National Pollutant Discharge Elimination System NON-MAJOR (Tracking pollutant discharge elimination systems) - permit COMMUNITY WATER SYSTEM (SDWIS) - SDWIS-MO3010614 70680, WATER TREATMENT PLANT Business SIC classification: SEWERAGE SYSTEMS Alternative names: OTTERVILLE WWTF
AG COOP SERVICES (100 S VINE ST in OTTERVILLE, MO)
STATE MASTER (Missouri monitoring and compilance) - PCS-MOR240247, NPDES NON-MAJOR National Pollutant Discharge Elimination System NON-MAJOR (Tracking pollutant discharge elimination systems) - permit Business SIC classification: MISCELLANEOUS RETAIL STORES Alternative names: JACK VEULEMAN
OTTERVILLE ELEM. (100 SPRING ST in OTTERVILLE, MO)
(National Center for Education Statistics) - STATE ID-4020027058 Organizations: OTTERVILLE R-VI (SCHOOL DISTRICT)
OTTERVILLE HIGH (100 SPRING ST in OTTERVILLE, MO)
(National Center for Education Statistics) - STATE ID-1050027058 Organizations: OTTERVILLE R-VI (SCHOOL DISTRICT)
GARY BRODERSEN (POTTER FORD DRIVE in OTTERVILLE, MO)
National Pollutant Discharge Elimination System NON-MAJOR (Tracking pollutant discharge elimination systems) - permit Business SIC classification: CONSTRUCTION SAND AND GRAVEL Alternative names: BRODERSEN SAND & GRAVEL D
Housing units lacking complete plumbing facilities: 8.5% Housing units lacking complete kitchen facilities: 9.9%
48.8%Electricity
22.5%Bottled, tank, or LP gas
20.6%Utility gas
8.4%Wood
Population in 1990: 853. Population change in the 1990s: +554 (+64.9%).
Place of birth for U.S.-born residents:
This state: 1,007
Northeast: 45
Midwest: 77
South: 34
West: 38
59% of the 65348 zip code residents lived in the same house 5 years ago. Out of people who lived in different houses, 34% lived in this county. Out of people who lived in different counties, 50% lived in Missouri.
91% of the 65348 zip code residents lived in the same house 1 year ago. Out of people who lived in different houses, 35% moved from this county. Out of people who lived in different houses, 35% moved from different county within same state. Out of people who lived in different houses, 29% moved from different state. Out of people who lived in different houses, 1% moved from abroad.
Private vs. public school enrollment:
Students in private schools in grades 1 to 8 (elementary and middle school): 13
Here:
8.8%
Missouri:
15.4%
Students in private schools in grades 9 to 12 (high school): 4
Here:
6.1%
Missouri:
13.9%
Students in private undergraduate colleges:
Here:
0.0%
Missouri:
22.6%
Occupation by median earnings in the past 12 months ($)
98,957Health diagnosing and treating practitioners and other technical occupations
86,378Transportation occupations
62,615Management occupations
52,941Installation, maintenance, and repair occupations
47,693Law enforcement workers including supervisors
41,920Education, training, and library occupations
Top industries in this zip code by the number of employees in 2005:
Finance and Insurance: Commercial Banking (5-9 employees: 1 establishment)
Other Services (except Public Administration): Religious Organizations (1-4: 2)
Wholesale Trade: Warm Air Heating and Air-Conditioning Equipment and Supplies Merchant Wholesalers (1-4: 1)
Other Services (except Public Administration): General Automotive Repair (1-4: 1)
Accommodation and Food Services: Rooming and Boarding Houses (1-4: 1)
Construction: New Single-Family Housing Construction (except Operative Builders) (1-4: 1)
Administrative and Support and Waste Management and Remediation Services: Janitorial Services (1-4: 1)
Fatal accident statistics in 2014:
Fatal accident count: 1
Vehicles involved in fatal accidents: 2
Fatal accidents caused by drunken drivers: 0
Fatalities: 4
Persons involved in fatal accidents: 6
Pedestrians involved in fatal accidents: 0
Fatal accident statistics in 2011:
Fatal accident count: 2
Vehicles involved in fatal accidents: 4
Fatal accidents caused by drunken drivers: 0
Fatalities: 2
Persons involved in fatal accidents: 5
Pedestrians involved in fatal accidents: 0
2002 - 2018 National Fire Incident Reporting System (NFIRS) incidents
According to the data from the years 2002 - 2018 the average number of fire incidents per year is 15. The highest number of reported fires - 32 took place in 2012, and the least - 5 in 2007. The data has a dropping trend.
When looking into fire subcategories, the most reports belonged to: Outside Fires (55.3%), and Structure Fires (29.2%).
Fire incident types reported to NFIRS in Zip Code 65348


 Nearest zip codes: 65329, 65354, 65350, 65276, 65237, 65081.


 According to the data from the years 2002 - 2018 the average number of fire incidents per year is 15. The highest number of reported fires - 32 took place in 2012, and the least - 5 in 2007. The data has a dropping trend.
 When looking into fire subcategories, the most reports belonged to: Outside Fires (55.3%), and Structure Fires (29.2%).