Estimated zip code population in 2022: 1,834 Zip code population in 2010: 2,134 Zip code population in 2000: 2,242
Houses and condos: 887 Renter-occupied apartments: 200
% of renters here:
27%
State:
32%
March 2022 cost of living index in zip code 65571: 76.2 (low, U.S. average is 100)
Land area: 181.8 sq. mi. Water area: 0.1 sq. mi.
Population density: 10 people per square mile
(very low).
OSM Map
General Map
Google Map
MSN Map
OSM Map
General Map
Google Map
MSN Map
OSM Map
General Map
Google Map
MSN Map
OSM Map
General Map
Google Map
MSN Map
Please wait while loading the map...
Real estate property taxes paid for housing units in 2022:
This zip code:
0.5% ($571)
Missouri:
0.8% ($1,810)
Median real estate property taxes paid for housing units with mortgages in 2022: $844 (0.5%) Median real estate property taxes paid for housing units with no mortgage in 2022: $541 (0.5%)
Business Search- 14 Million verified businesses
Males: 1,018
(55.5%)
Females: 816
(44.5%)
For population 25 years and over in 65571:
High school or higher: 82.4%
Bachelor's degree or higher: 8.2%
Graduate or professional degree: 5.4%
Unemployed: 10.6%
Mean travel time to work (commute): 30.9 minutes
For population 15 years and over in 65571:
Never married: 22.7%
Now married: 55.3%
Separated: 0.5%
Widowed: 13.7%
Divorced: 7.8%
Zip code 65571 compared to state average:
Median household income significantly below state average.
Median house value below state average.
Unemployed percentage above state average.
Black race population percentage significantly below state average.
Hispanic race population percentage significantly below state average.
Median age significantly above state average.
Foreign-born population percentage significantly below state average.
Length of stay since moving in significantly above state average.
Number of college students significantly below state average.
Percentage of population with a bachelor's degree or higher significantly below state average.
Estimated median house/condo value in 2022: $109,047
65571:
$109,047
Missouri:
$221,200
According to our research of Missouri and other state lists, there were 5 registered sex offenders living in 65571 zip code as of May 28, 2024. The ratio of all residents to sex offenders in zip code 65571 is 449 to 1. The ratio of registered sex offenders to all residents in this zip code is lower than the state average.
Median resident age:
This zip code:
53.0 years
Missouri median age:
39.1 years
Average household size:
This zip code:
2.4 people
Missouri:
2.4 people
Averages for the 2020 tax year for zip code 65571, filed in 2021:
Average Adjusted Gross Income (AGI) in 2020: $39,225 (Individual Income Tax Returns)
Here:
$39,225
State:
$68,151
Salary/wage: $38,100 (reported on 74.7% of returns)
Here:
$38,100
State:
$56,131
(% of AGI for various income ranges: 1290.0% for AGIs below $25k, 3978.2% for AGIs $25k-50k, 8274.3% for AGIs $50k-75k, 9190.0% for AGIs $75k-100k, 14746.7% for AGIs $100k-200k)
Taxable interest for individuals: $917 (reported on 27.7% of returns)
This zip code:
$917
Missouri:
$1,586
(% of AGI for various income ranges: 37.0% for AGIs below $25k, 38.2% for AGIs $25k-50k, 20.0% for AGIs $50k-75k, 117.5% for AGIs $75k-100k)
Ordinary dividends: $3,320 (reported on 6.0% of returns)
Here:
$3,320
State:
$10,947
(% of AGI for various income ranges: 14.8% for AGIs below $25k, 188.6% for AGIs $50k-75k)
Net capital gain/loss in AGI: +$5,333 (reported on 10.8% of returns)
Here:
+$5,333
State:
+$18,453
(% of AGI for various income ranges: 39.6% for AGIs below $25k, 122.4% for AGIs $25k-50k, 452.5% for AGIs $75k-100k)
Profit/loss from business: +$9,339 (reported on 21.7% of returns)
Here:
+$9,339
State:
+$12,260
(% of AGI for various income ranges: 277.8% for AGIs below $25k, 405.9% for AGIs $25k-50k, 502.9% for AGIs $50k-75k)
Taxable individual retirement arrangement distribution: $6,133 (reported on 3.6% of returns)
65571:
$6,133
Missouri:
$19,719
(% of AGI for various income ranges: 80.0% for AGIs below $25k)
Earned income credit: $2,390 (reported on 24.1% of returns)
Here:
$2,390
State:
$2,315
(% of AGI for various income ranges: 114.8% for AGIs below $25k, 125.9% for AGIs $25k-50k)
Percentage of individuals using paid preparers for their 2020 taxes: 91.6%
Here:
92%
State:
93%
(% for various income ranges: 91.7% for AGIs below $25k, 92.0% for AGIs $25k-50k, 91.7% for AGIs $50k-75k, 83.3% for AGIs $75k-100k, 100.0% for AGIs $100k-200k)
Averages for the 2012 tax year for zip code 65571, filed in 2013:
Average Adjusted Gross Income (AGI) in 2012: $32,587 (Individual Income Tax Returns)
Here:
$32,587
State:
$55,896
Salary/wage: $28,719 (reported on 72.0% of returns)
Here:
$28,719
State:
$46,205
(% of AGI for various income ranges: 66.8% for AGIs below $25k, 70.0% for AGIs $25k-50k, 72.4% for AGIs $50k-75k, 100.0% for AGIs $75k-100k)
Taxable interest for individuals: $1,517 (reported on 28.0% of returns)
This zip code:
$1,517
Missouri:
$1,559
(% of AGI for various income ranges: 1.4% for AGIs below $25k, 1.6% for AGIs $25k-50k, 1.5% for AGIs $50k-75k, 1.5% for AGIs $75k-100k)
Ordinary dividends: $1,488 (reported on 9.8% of returns)
Here:
$1,488
State:
$7,410
Net capital gain/loss in AGI: +$5,873 (reported on 13.4% of returns)
Here:
+$5,873
State:
+$11,579
(% of AGI for various income ranges: 1.2% for AGIs below $25k, 3.1% for AGIs $25k-50k, 2.0% for AGIs $50k-75k, 7.0% for AGIs $75k-100k)
Profit/loss from business: +$11,179 (reported on 29.3% of returns)
Here:
+$11,179
State:
+$11,688
(% of AGI for various income ranges: 15.4% for AGIs below $25k, 13.0% for AGIs $25k-50k, 12.3% for AGIs $50k-75k)
Taxable individual retirement arrangement distribution: $6,150 (reported on 4.9% of returns)
65571:
$6,150
Missouri:
$14,773
Total itemized deductions: $18,291 (27% of AGI, reported on 13.4% of returns)
Here:
$18,291
State:
$22,730
Here:
27.2% of AGI
State:
19.2% of AGI
(% of AGI for various income ranges: 8.0% for AGIs $25k-50k, 6.9% for AGIs $50k-75k, 30.9% for AGIs $75k-100k)
Charity contributions: $4,157 (reported on 8.5% of returns)
Here:
$4,157
State:
$4,745
Taxes paid: $3,555 (reported on 13.4% of returns)
65571:
$3,555
State:
$8,399
(% of AGI for various income ranges: 1.2% for AGIs $25k-50k, 0.9% for AGIs $50k-75k, 8.1% for AGIs $75k-100k)
Earned income credit: $2,254 (reported on 29.3% of returns)
Here:
$2,254
State:
$2,288
(% of AGI for various income ranges: 7.2% for AGIs below $25k, 2.0% for AGIs $25k-50k)
Percentage of individuals using paid preparers for their 2012 taxes: 70.7%
Here:
71%
State:
55%
(% for various income ranges: 68.3% for AGIs below $25k, 69.6% for AGIs $25k-50k, 81.8% for AGIs $50k-75k, 125.0% for AGIs $75k-100k)
Averages for the 2004 tax year for zip code 65571, filed in 2005:
Average Adjusted Gross Income (AGI) in 2004: $23,635 (Individual Income Tax Returns)
Here:
$23,635
State:
$44,591
Salary/wage: $22,891 (reported on 74.3% of returns)
Here:
$22,891
State:
$38,941
(% of AGI for various income ranges: 110.8% for AGIs below $10k, 68.1% for AGIs $10k-25k, 74.3% for AGIs $25k-50k, 74.1% for AGIs $50k-75k, 68.7% for AGIs $75k-100k, 57.0% for AGIs over 100k)
Taxable interest for individuals: $1,396 (reported on 40.1% of returns)
This zip code:
$1,396
Missouri:
$1,801
(% of AGI for various income ranges: 13.8% for AGIs below $10k, 2.8% for AGIs $10k-25k, 1.7% for AGIs $25k-50k, 2.7% for AGIs $50k-75k, 0.8% for AGIs over 100k)
Taxable dividends: $929 (reported on 12.2% of returns)
Here:
$929
State:
$3,677
(% of AGI for various income ranges: 5.2% for AGIs below $10k, 0.3% for AGIs $10k-25k, 0.4% for AGIs $25k-50k, 0.4% for AGIs $50k-75k)
Net capital gain/loss: +$3,438 (reported on 16.2% of returns)
Here:
+$3,438
State:
+$8,915
(% of AGI for various income ranges: 6.3% for AGIs below $10k, 2.4% for AGIs $10k-25k, 3.1% for AGIs $25k-50k, 1.6% for AGIs $50k-75k, 0.9% for AGIs $75k-100k)
Profit/loss from business: +$8,827 (reported on 26.7% of returns)
Here:
+$8,827
State:
+$9,793
(% of AGI for various income ranges: 27.1% for AGIs below $10k, 16.2% for AGIs $10k-25k, 9.4% for AGIs $25k-50k, 7.9% for AGIs $50k-75k)
IRA payment deduction: $2,250 (reported on 1.5% of returns)
65571:
$2,250
Missouri:
$2,972
Total itemized deductions: $15,795 (28% of AGI, reported on 11.0% of returns)
Here:
$15,795
State:
$18,261
Here:
27.9% of AGI
State:
20.5% of AGI
(% of AGI for various income ranges: 5.7% for AGIs $10k-25k, 3.9% for AGIs $25k-50k, 10.6% for AGIs $50k-75k, 14.2% for AGIs $75k-100k, 17.4% for AGIs over 100k)
Charity contributions deductions: $4,662 (8% of AGI, reported on 8.5% of returns)
Here:
$4,662
State:
$3,665
Here:
7.9% of AGI
State:
3.9% of AGI
(% of AGI for various income ranges: 1.0% for AGIs $10k-25k, 0.8% for AGIs $25k-50k, 3.3% for AGIs $50k-75k, 6.0% for AGIs over 100k)
Total tax: $2,397 (reported on 63.2% of returns)
65571:
$2,397
State:
$6,999
(% of AGI for various income ranges: 6.6% for AGIs below $10k, 4.2% for AGIs $10k-25k, 5.4% for AGIs $25k-50k, 6.7% for AGIs $50k-75k, 9.0% for AGIs $75k-100k, 13.9% for AGIs over 100k)
Earned income credit: $1,799 (reported on 30.5% of returns)
Here:
$1,799
State:
$1,728
Percentage of individuals using paid preparers for their 2004 taxes: 77.4%
Here:
77%
State:
62%
(% for various income ranges: 72.3% for AGIs below $10k, 78.9% for AGIs $10k-25k, 79.9% for AGIs $25k-50k, 79.2% for AGIs $50k-75k, 80.0% for AGIs $75k-100k, 85.7% for AGIs over 100k)
Household received Food Stamps/SNAP in the past 12 months: 71 Household did not receive Food Stamps/SNAP in the past 12 months: 674
Women who had a birth in the past 12 months: 6 (6 now married, 0 unmarried) Women who did not have a birth in the past 12 months: 201 (107 now married, 93 unmarried)
Housing units in zip code 65571 with a mortgage: 70 Houses without a mortgage: 2
Median monthly owner costs for units with a mortgage: $1,058 Median monthly owner costs for units without a mortgage: $303
Residents with income below the poverty level in 2022:
This zip code:
23.1%
Whole state:
13.2%
Residents with income below 50% of the poverty level in 2022:
This zip code:
13.2%
Whole state:
6.8%
Median number of rooms in houses and condos:
Here:
5.5
State:
6.4
Median number of rooms in apartments:
Here:
5.3
State:
4.4
Notable locations in this zip code not listed on our city pages
Cemeteries: Dyer Cemetery (1), Pickett Cemetery (2), Riley Cemetery (3), Bell Cemetery (4), Black Pond Cemetery (5), Cold Spring Cemetery (6), Summersville Cemetery (7). Display/hide their locations on the map
Streams, rivers, and creeks: East Fork Pine Branch (A), Casto Valley Creek (B), Black Valley Creek (C), Bay Creek (D), Leatherwood Creek (E). Display/hide their locations on the map
Parks in zip code 65571 include: Bay Creek Campsite (1), Flat Rock State Wildlife Area (2), Skunk Pond State Wildlife Management Area (3). Display/hide their locations on the map
In group quarters: 11 (-1 institutionalized population)
Size of family households: 289 2-persons, 107 3-persons, 19 4-persons, 47 5-persons, 44 7-or-more-persons
Size of nonfamily households: 204 1-person, 36 2-persons
284 married couples with children.
62 single-parent households (5 men, 57 women).
100.2% of residents of 65571 zip code speak English at home.
0.2% of residents speak other Indo-European language at home (100% very well).
0.1% of residents speak Asian or Pacific Island language at home (100% very well).
Foreign born population: 1 (0.1%) (100.0% of them are naturalized citizens)
This zip code:
0.1%
Whole state:
4.1%
100%Hong Kong
26%German
25%American
11%Pennsylvania German
8%European
5%English
4%Irish
2%Italian
Year of entry for the foreign-born population
02010 or later
02000 to 2009
01990 to 1999
1Before 1990
Housing units lacking complete plumbing facilities: 8.2% Housing units lacking complete kitchen facilities: 6.0%
39.2%Bottled, tank, or LP gas
29.8%Wood
26.9%Electricity
4.3%Utility gas
Population in 1990: 1,199. Population change in the 1990s: +1,043 (+87.0%).
Place of birth for U.S.-born residents:
This state: 1,097
Northeast: 94
Midwest: 477
South: 59
West: 108
62% of the 65571 zip code residents lived in the same house 5 years ago. Out of people who lived in different houses, 41% lived in this county. Out of people who lived in different counties, 50% lived in Missouri.
98% of the 65571 zip code residents lived in the same house 1 year ago. Out of people who lived in different houses, 25% moved from this county. Out of people who lived in different houses, 86% moved from different county within same state. Out of people who lived in different houses, 11% moved from different state.
Private vs. public school enrollment:
Students in private schools in grades 1 to 8 (elementary and middle school):
Here:
0.0%
Missouri:
15.4%
Students in private schools in grades 9 to 12 (high school): 4
Here:
2.4%
Missouri:
13.9%
Students in private undergraduate colleges:
Here:
0.0%
Missouri:
22.6%
Occupation by median earnings in the past 12 months ($)
111,038Sales and related occupations
91,854Transportation occupations
68,876Management occupations
65,022Installation, maintenance, and repair occupations
28,620Production occupations
12,600Farming, fishing, and forestry occupations
Top industries in this zip code by the number of employees in 2005:
Finance and Insurance: Commercial Banking (20-49 employees: 1 establishment)
Health Care and Social Assistance: Residential Mental Retardation Facilities (10-19: 1)
Administrative and Support and Waste Management and Remediation Services: All Other Support Services (10-19: 1)
Health Care and Social Assistance: Services for the Elderly and Persons with Disabilities (5-9: 2)
Health Care and Social Assistance: Child Day Care Services (5-9: 1)
People in group quarters in 2010:
11 people in group homes intended for adults
People in group quarters in 2000:
8 people in homes for the physically handicapped
Fatal accident statistics in 2014:
Fatal accident count: 2
Vehicles involved in fatal accidents: 4
Fatal accidents caused by drunken drivers: 0
Fatalities: 3
Persons involved in fatal accidents: 7
Pedestrians involved in fatal accidents: 0
Fatal accident statistics in 2011:
Fatal accident count: 1
Vehicles involved in fatal accidents: 1
Fatal accidents caused by drunken drivers: 0
Fatalities: 1
Persons involved in fatal accidents: 1
Pedestrians involved in fatal accidents: 0
2003 - 2018 National Fire Incident Reporting System (NFIRS) incidents
According to the data from the years 2003 - 2018 the average number of fire incidents per year is 15. The highest number of fires - 28 took place in 2010, and the least - 7 in 2015. The data has an increasing trend.
When looking into fire subcategories, the most incidents belonged to: Outside Fires (49.4%), and Structure Fires (37.8%).
Fire incident types reported to NFIRS in Zip Code 65571

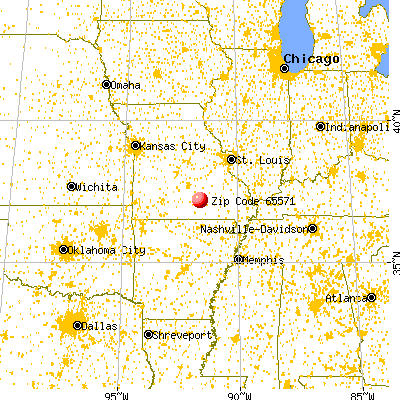


 Nearest zip codes: 65479, 65468, 65548, 65589, 65555, 65466.


 According to the data from the years 2003 - 2018 the average number of fire incidents per year is 15. The highest number of fires - 28 took place in 2010, and the least - 7 in 2015. The data has an increasing trend.
 When looking into fire subcategories, the most incidents belonged to: Outside Fires (49.4%), and Structure Fires (37.8%).