Estimated zip code population in 2022: 1,785 Zip code population in 2010: 1,354 Zip code population in 2000: 1,264
Houses and condos: 770 Renter-occupied apartments: 213
% of renters here:
27%
State:
32%
March 2022 cost of living index in zip code 65612: 77.9 (low, U.S. average is 100)
Land area: 35.4 sq. mi. Water area: 0.0 sq. mi.
Population density: 50 people per square mile
(very low).
OSM Map
General Map
Google Map
MSN Map
OSM Map
General Map
Google Map
MSN Map
OSM Map
General Map
Google Map
MSN Map
OSM Map
General Map
Google Map
MSN Map
Please wait while loading the map...
Real estate property taxes paid for housing units in 2022:
This zip code:
0.4% ($1,384)
Missouri:
0.8% ($1,810)
Median real estate property taxes paid for housing units with mortgages in 2022: $1,262 (0.4%) Median real estate property taxes paid for housing units with no mortgage in 2022: $1,696 (0.5%)
Business Search- 14 Million verified businesses
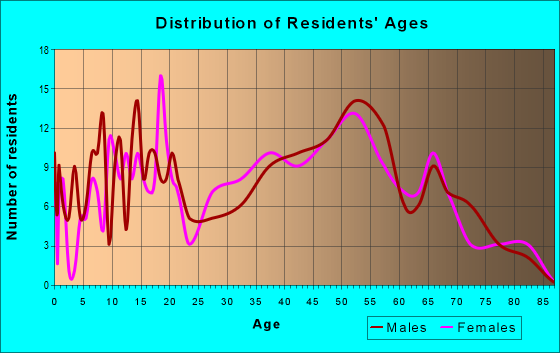
Males: 938
(52.5%)
Females: 847
(47.5%)
For population 25 years and over in 65612:
High school or higher: 88.9%
Bachelor's degree or higher: 15.7%
Graduate or professional degree: 4.9%
Mean travel time to work (commute): 24.0 minutes
For population 15 years and over in 65612:
Never married: 16.2%
Now married: 63.2%
Separated: 0.0%
Widowed: 16.4%
Divorced: 4.2%
Zip code 65612 compared to state average:
Unemployed percentage significantly below state average.
Black race population percentage significantly below state average.
Hispanic race population percentage significantly below state average.
Median age significantly above state average.
Foreign-born population percentage significantly below state average.
Length of stay since moving in significantly above state average.
Percentage of population with a bachelor's degree or higher below state average.
Averages for the 2020 tax year for zip code 65612, filed in 2021:
Average Adjusted Gross Income (AGI) in 2020: $59,120 (Individual Income Tax Returns)
Here:
$59,120
State:
$68,151
Salary/wage: $56,983 (reported on 78.3% of returns)
Here:
$56,983
State:
$56,131
(% of AGI for various income ranges: 1256.4% for AGIs below $25k, 3760.9% for AGIs $25k-50k, 7516.7% for AGIs $50k-75k, 8132.5% for AGIs $75k-100k, 26246.0% for AGIs $100k-200k)
Taxable interest for individuals: $470 (reported on 33.3% of returns)
This zip code:
$470
Missouri:
$1,586
(% of AGI for various income ranges: 25.0% for AGIs below $25k, 9.1% for AGIs $25k-50k, 41.7% for AGIs $50k-75k, 35.0% for AGIs $75k-100k, 20.0% for AGIs $100k-200k)
Ordinary dividends: $2,425 (reported on 13.3% of returns)
Here:
$2,425
State:
$10,947
(% of AGI for various income ranges: 30.0% for AGIs below $25k, 88.3% for AGIs $50k-75k, 198.0% for AGIs $100k-200k)
Net capital gain/loss in AGI: +$9,450 (reported on 16.7% of returns)
Here:
+$9,450
State:
+$18,453
(% of AGI for various income ranges: 108.2% for AGIs $25k-50k, 125.0% for AGIs $50k-75k, 1502.0% for AGIs $100k-200k)
Profit/loss from business: +$7,527 (reported on 18.3% of returns)
Here:
+$7,527
State:
+$12,260
(% of AGI for various income ranges: 104.3% for AGIs below $25k, 360.0% for AGIs $25k-50k, 283.3% for AGIs $50k-75k, 232.0% for AGIs $100k-200k)
Taxable individual retirement arrangement distribution: $10,450 (reported on 10.0% of returns)
65612:
$10,450
Missouri:
$19,719
(% of AGI for various income ranges: 194.3% for AGIs below $25k, 591.7% for AGIs $50k-75k)
Total itemized deductions: $25,775 (reported on 6.7% of returns)
Here:
$25,775
State:
$36,651
(% of AGI for various income ranges: 2062.0% for AGIs $100k-200k)
Charity contributions: $16,550 (reported on 3.3% of returns)
Here:
$16,550
State:
$15,671
(% of AGI for various income ranges: 551.7% for AGIs $50k-75k)
Taxes paid: $5,850 (reported on 6.7% of returns)
65612:
$5,850
State:
$7,608
(% of AGI for various income ranges: 468.0% for AGIs $100k-200k)
Earned income credit: $2,214 (reported on 11.7% of returns)
Here:
$2,214
State:
$2,315
(% of AGI for various income ranges: 57.9% for AGIs below $25k, 67.3% for AGIs $25k-50k)
Percentage of individuals using paid preparers for their 2020 taxes: 95.0%
Here:
95%
State:
93%
(% for various income ranges: 94.7% for AGIs below $25k, 93.3% for AGIs $25k-50k, 90.0% for AGIs $50k-75k, 100.0% for AGIs $75k-100k, 100.0% for AGIs $100k-200k)
Averages for the 2012 tax year for zip code 65612, filed in 2013:
Average Adjusted Gross Income (AGI) in 2012: $44,625 (Individual Income Tax Returns)
Here:
$44,625
State:
$55,896
Salary/wage: $39,983 (reported on 82.5% of returns)
Here:
$39,983
State:
$46,205
(% of AGI for various income ranges: 69.2% for AGIs below $25k, 79.9% for AGIs $25k-50k, 80.8% for AGIs $50k-75k, 81.9% for AGIs $75k-100k, 64.3% for AGIs $100k-200k)
Taxable interest for individuals: $505 (reported on 35.1% of returns)
This zip code:
$505
Missouri:
$1,559
(% of AGI for various income ranges: 2.1% for AGIs below $25k, 0.2% for AGIs $25k-50k, 0.2% for AGIs $50k-75k, 0.2% for AGIs $75k-100k)
Ordinary dividends: $1,033 (reported on 15.8% of returns)
Here:
$1,033
State:
$7,410
(% of AGI for various income ranges: 0.8% for AGIs below $25k, 0.8% for AGIs $25k-50k, 0.7% for AGIs $75k-100k)
Net capital gain/loss in AGI: +$2,450 (reported on 10.5% of returns)
Here:
+$2,450
State:
+$11,579
Profit/loss from business: +$5,055 (reported on 19.3% of returns)
Here:
+$5,055
State:
+$11,688
(% of AGI for various income ranges: 8.3% for AGIs below $25k, 3.3% for AGIs $25k-50k, 2.3% for AGIs $50k-75k)
Taxable individual retirement arrangement distribution: $9,620 (reported on 8.8% of returns)
65612:
$9,620
Missouri:
$14,773
Total itemized deductions: $19,931 (24% of AGI, reported on 22.8% of returns)
Here:
$19,931
State:
$22,730
Here:
23.5% of AGI
State:
19.2% of AGI
(% of AGI for various income ranges: 12.2% for AGIs $25k-50k, 11.3% for AGIs $50k-75k, 12.8% for AGIs $75k-100k, 11.2% for AGIs $100k-200k)
Charity contributions: $4,220 (reported on 17.5% of returns)
Here:
$4,220
State:
$4,745
(% of AGI for various income ranges: 2.8% for AGIs below $25k, 3.7% for AGIs $50k-75k, 1.6% for AGIs $100k-200k)
Taxes paid: $5,492 (reported on 22.8% of returns)
65612:
$5,492
State:
$8,399
(% of AGI for various income ranges: 1.9% for AGIs $25k-50k, 2.6% for AGIs $50k-75k, 3.0% for AGIs $75k-100k, 4.5% for AGIs $100k-200k)
Earned income credit: $2,638 (reported on 14.0% of returns)
Here:
$2,638
State:
$2,288
(% of AGI for various income ranges: 5.0% for AGIs below $25k, 0.9% for AGIs $25k-50k)
Percentage of individuals using paid preparers for their 2012 taxes: 57.9%
Here:
58%
State:
55%
(% for various income ranges: 48.0% for AGIs below $25k, 61.5% for AGIs $25k-50k, 62.5% for AGIs $50k-75k, 80.0% for AGIs $75k-100k, 66.7% for AGIs $100k-200k)
Averages for the 2004 tax year for zip code 65612, filed in 2005:
Average Adjusted Gross Income (AGI) in 2004: $36,886 (Individual Income Tax Returns)
Here:
$36,886
State:
$44,591
Salary/wage: $34,931 (reported on 83.4% of returns)
Here:
$34,931
State:
$38,941
(% of AGI for various income ranges: 141.4% for AGIs below $10k, 75.9% for AGIs $10k-25k, 85.0% for AGIs $25k-50k, 84.7% for AGIs $50k-75k, 80.7% for AGIs $75k-100k, 61.5% for AGIs over 100k)
Taxable interest for individuals: $1,142 (reported on 46.1% of returns)
This zip code:
$1,142
Missouri:
$1,801
(% of AGI for various income ranges: 7.3% for AGIs below $10k, 2.8% for AGIs $10k-25k, 2.0% for AGIs $25k-50k, 0.3% for AGIs $50k-75k, 0.4% for AGIs $75k-100k, 1.6% for AGIs over 100k)
Taxable dividends: $607 (reported on 20.9% of returns)
Here:
$607
State:
$3,677
(% of AGI for various income ranges: 2.6% for AGIs below $10k, 0.3% for AGIs $10k-25k, 0.4% for AGIs $25k-50k, 0.3% for AGIs $50k-75k, 0.1% for AGIs $75k-100k, 0.3% for AGIs over 100k)
Net capital gain/loss: +$3,771 (reported on 19.6% of returns)
Here:
+$3,771
State:
+$8,915
(% of AGI for various income ranges: 15.2% for AGIs below $10k, 2.3% for AGIs $25k-50k, 0.3% for AGIs $50k-75k, -0.1% for AGIs $75k-100k, 5.0% for AGIs over 100k)
Profit/loss from business: +$2,981 (reported on 19.2% of returns)
Here:
+$2,981
State:
+$9,793
(% of AGI for various income ranges: 10.2% for AGIs below $10k, 4.4% for AGIs $10k-25k, 3.0% for AGIs $25k-50k, 0.5% for AGIs $50k-75k)
Total itemized deductions: $17,183 (23% of AGI, reported on 23.5% of returns)
Here:
$17,183
State:
$18,261
Here:
23.3% of AGI
State:
20.5% of AGI
(% of AGI for various income ranges: 13.6% for AGIs $10k-25k, 6.1% for AGIs $25k-50k, 8.2% for AGIs $50k-75k, 17.1% for AGIs $75k-100k, 14.8% for AGIs over 100k)
Charity contributions deductions: $3,680 (5% of AGI, reported on 18.7% of returns)
Here:
$3,680
State:
$3,665
Here:
4.7% of AGI
State:
3.9% of AGI
(% of AGI for various income ranges: 2.0% for AGIs $10k-25k, 0.4% for AGIs $25k-50k, 0.7% for AGIs $50k-75k, 4.5% for AGIs $75k-100k, 3.1% for AGIs over 100k)
Total tax: $4,688 (reported on 71.6% of returns)
65612:
$4,688
State:
$6,999
(% of AGI for various income ranges: 5.0% for AGIs below $10k, 4.4% for AGIs $10k-25k, 5.7% for AGIs $25k-50k, 8.3% for AGIs $50k-75k, 10.6% for AGIs $75k-100k, 15.8% for AGIs over 100k)
Earned income credit: $1,870 (reported on 17.2% of returns)
Here:
$1,870
State:
$1,728
Percentage of individuals using paid preparers for their 2004 taxes: 65.9%
Here:
66%
State:
62%
(% for various income ranges: 63.2% for AGIs below $10k, 61.9% for AGIs $10k-25k, 64.7% for AGIs $25k-50k, 68.8% for AGIs $50k-75k, 76.5% for AGIs $75k-100k, 80.0% for AGIs over 100k)
Household received Food Stamps/SNAP in the past 12 months: 0 Household did not receive Food Stamps/SNAP in the past 12 months: 781
Women who did not have a birth in the past 12 months: 403 (217 now married, 185 unmarried)
Housing units in zip code 65612 with a mortgage: 272 Median monthly owner costs for units with a mortgage: $1,167 Median monthly owner costs for units without a mortgage: $559
Residents with income below the poverty level in 2022:
This zip code:
5.3%
Whole state:
13.2%
Residents with income below 50% of the poverty level in 2022:
This zip code:
5.3%
Whole state:
6.8%
Median number of rooms in houses and condos:
Here:
5.6
State:
6.4
Median number of rooms in apartments:
Here:
4.2
State:
4.4
Notable locations in this zip code not listed on our city pages
Notable locations in zip code 65612: Bois D'Arc Fire Protection District Station 2 (A), Bois D'Arc Fire Protection District Station 1 (B). Display/hide their locations on the map
Size of family households: 258 2-persons, 28 3-persons, 123 4-persons, 48 5-persons
Size of nonfamily households: 270 1-person, 49 2-persons
325 married couples with children.
0 single-parent households ().
100.2% of residents of 65612 zip code speak English at home.
Foreign born population: 0 (0.0%)
:
0.0%
Whole state:
4.1%
86%English
10%American
5%European
2%Irish
1%German
Public elementary/middle school in in zip code 65612 not listed on the city page:
BOIS D'ARC ELEM.(Students: 165, Location: 10315 W STATE HWY T, Grades: 4-6)
Facilities with environmental interests located in this zip code:
BOIS D'ARC ELEM. (T HWY in BOIS D' ARC, MO)
(National Center for Education Statistics) - STATE ID-4040039135 Organizations: ASH GROVE R-IV (SCHOOL DISTRICT)
HOGENMILLER PROPERTY (14301 HWY 266 in BOIS D ARC, MO)
Small Quantity Generators, between 100 kg and 1000 kg of hazardous waste/month (Resource Conservation and Recovery Act (tracking hazardous waste)) Organizations: ELLIS HOGENMILLER (CONTACT/OPERATOR)
51.3%Electricity
39.6%Bottled, tank, or LP gas
6.6%Solar energy
2.8%Other fuel
Population in 1990: 2,410.
Place of birth for U.S.-born residents:
This state: 1,235
Midwest: 108
South: 174
West: 276
53% of the 65612 zip code residents lived in the same house 5 years ago. Out of people who lived in different houses, 64% lived in this county. Out of people who lived in different counties, 50% lived in Missouri.
101% of the 65612 zip code residents lived in the same house 1 year ago.
Private vs. public school enrollment:
Students in private schools in grades 1 to 8 (elementary and middle school): 69
Here:
56.5%
Missouri:
15.4%
Students in private schools in grades 9 to 12 (high school):
Here:
0.0%
Missouri:
13.9%
Students in private undergraduate colleges:
Here:
0.0%
Missouri:
22.6%
Occupation by median earnings in the past 12 months ($)
43,326Office and administrative support occupations
42,271Management occupations
23,715Education, training, and library occupations
23,640Transportation occupations
Top industries in this zip code by the number of employees in 2005:
Administrative and Support and Waste Management and Remediation Services: Landscaping Services (1-4 employees: 4 establishments)
Wholesale Trade: Petroleum and Petroleum Products Merchant Wholesalers (except Bulk Stations and Terminals) (5-9: 1)
Construction: Plumbing, Heating, and Air-Conditioning Contractors (5-9: 1)
Professional, Scientific, and Technical Services: Marketing Research and Public Opinion Polling (1-4: 1)
Other Services (except Public Administration): Religious Organizations (1-4: 1)
Professional, Scientific, and Technical Services: Other Scientific and Technical Consulting Services (1-4: 1)
Fatal accident statistics in 2010:
Fatal accident count: 1
Vehicles involved in fatal accidents: 2
Fatal accidents caused by drunken drivers: 1
Fatalities: 1
Persons involved in fatal accidents: 4
Pedestrians involved in fatal accidents: 0
Home Mortgage Disclosure Act Aggregated Statistics For Year 2009 (Based on 2 partial tracts)
A) FHA, FSA/RHS & VA Home Purchase Loans
B) Conventional Home Purchase Loans
C) Refinancings
D) Home Improvement Loans
F) Non-occupant Loans on < 5 Family Dwellings (A B C & D)
G) Loans On Manufactured Home Dwelling (A B C & D)
Number
Average Value
Number
Average Value
Number
Average Value
Number
Average Value
Number
Average Value
Number
Average Value
LOANS ORIGINATED
15
$124,835
15
$154,093
116
$156,258
6
$37,798
4
$87,808
2
$68,905
APPLICATIONS APPROVED, NOT ACCEPTED
1
$65,560
1
$50,840
5
$146,778
1
$136,480
1
$53,520
1
$65,560
APPLICATIONS DENIED
3
$75,820
1
$250,880
35
$145,708
3
$50,177
1
$83,630
1
$125,100
APPLICATIONS WITHDRAWN
1
$125,100
3
$203,377
23
$171,759
0
$0
0
$0
1
$125,100
FILES CLOSED FOR INCOMPLETENESS
1
$71,580
0
$0
2
$89,980
1
$66,900
0
$0
1
$36,130
Aggregated Statistics For Year 2008 (Based on 2 partial tracts)
A) FHA, FSA/RHS & VA Home Purchase Loans
B) Conventional Home Purchase Loans
C) Refinancings
D) Home Improvement Loans
F) Non-occupant Loans on < 5 Family Dwellings (A B C & D)
G) Loans On Manufactured Home Dwelling (A B C & D)
Number
Average Value
Number
Average Value
Number
Average Value
Number
Average Value
Number
Average Value
Number
Average Value
LOANS ORIGINATED
14
$116,359
33
$153,688
81
$147,940
10
$41,612
7
$93,469
7
$73,590
APPLICATIONS APPROVED, NOT ACCEPTED
1
$225,450
1
$133,800
10
$158,219
0
$0
0
$0
0
$0
APPLICATIONS DENIED
1
$175,950
3
$152,310
39
$136,785
5
$105,970
2
$145,175
3
$103,473
APPLICATIONS WITHDRAWN
0
$0
5
$266,664
19
$163,588
1
$100,350
3
$310,640
1
$149,860
FILES CLOSED FOR INCOMPLETENESS
0
$0
1
$88,980
2
$182,635
0
$0
0
$0
0
$0
Aggregated Statistics For Year 2007 (Based on 2 partial tracts)
A) FHA, FSA/RHS & VA Home Purchase Loans
B) Conventional Home Purchase Loans
C) Refinancings
D) Home Improvement Loans
F) Non-occupant Loans on < 5 Family Dwellings (A B C & D)
G) Loans On Manufactured Home Dwelling (A B C & D)
Number
Average Value
Number
Average Value
Number
Average Value
Number
Average Value
Number
Average Value
Number
Average Value
LOANS ORIGINATED
4
$109,048
52
$131,214
89
$124,840
11
$37,343
5
$137,012
4
$53,185
APPLICATIONS APPROVED, NOT ACCEPTED
1
$131,120
3
$105,480
13
$136,065
1
$24,080
0
$0
0
$0
APPLICATIONS DENIED
0
$0
9
$130,827
50
$141,293
7
$84,963
5
$116,272
4
$87,972
APPLICATIONS WITHDRAWN
0
$0
6
$149,075
26
$148,775
4
$112,058
1
$153,870
0
$0
FILES CLOSED FOR INCOMPLETENESS
0
$0
1
$161,230
4
$166,415
1
$40,810
1
$53,520
0
$0
Aggregated Statistics For Year 2006 (Based on 2 partial tracts)
A) FHA, FSA/RHS & VA Home Purchase Loans
B) Conventional Home Purchase Loans
C) Refinancings
D) Home Improvement Loans
F) Non-occupant Loans on < 5 Family Dwellings (A B C & D)
G) Loans On Manufactured Home Dwelling (A B C & D)
Number
Average Value
Number
Average Value
Number
Average Value
Number
Average Value
Number
Average Value
Number
Average Value
LOANS ORIGINATED
11
$110,020
62
$111,594
100
$128,361
9
$35,680
7
$104,841
6
$58,203
APPLICATIONS APPROVED, NOT ACCEPTED
0
$0
6
$94,887
11
$139,213
1
$13,380
1
$213,410
1
$30,770
APPLICATIONS DENIED
1
$144,500
13
$191,128
45
$123,126
4
$82,288
3
$122,873
4
$70,412
APPLICATIONS WITHDRAWN
1
$46,160
5
$107,442
29
$114,630
1
$16,730
1
$195,350
0
$0
FILES CLOSED FOR INCOMPLETENESS
0
$0
1
$16,060
2
$112,390
0
$0
0
$0
0
$0
Aggregated Statistics For Year 2005 (Based on 2 partial tracts)
A) FHA, FSA/RHS & VA Home Purchase Loans
B) Conventional Home Purchase Loans
C) Refinancings
D) Home Improvement Loans
F) Non-occupant Loans on < 5 Family Dwellings (A B C & D)
G) Loans On Manufactured Home Dwelling (A B C & D)
Number
Average Value
Number
Average Value
Number
Average Value
Number
Average Value
Number
Average Value
Number
Average Value
LOANS ORIGINATED
16
$109,465
78
$109,321
94
$116,335
11
$64,103
11
$84,598
4
$56,030
APPLICATIONS APPROVED, NOT ACCEPTED
0
$0
7
$90,316
19
$94,364
2
$14,720
2
$117,075
3
$70,467
APPLICATIONS DENIED
1
$72,920
15
$96,470
52
$122,054
5
$38,534
6
$72,363
5
$57,132
APPLICATIONS WITHDRAWN
0
$0
9
$87,639
29
$116,683
3
$157,883
2
$50,845
0
$0
FILES CLOSED FOR INCOMPLETENESS
0
$0
3
$68,907
5
$129,118
1
$35,460
0
$0
0
$0
Aggregated Statistics For Year 2004 (Based on 2 partial tracts)
A) FHA, FSA/RHS & VA Home Purchase Loans
B) Conventional Home Purchase Loans
C) Refinancings
D) Home Improvement Loans
F) Non-occupant Loans on < 5 Family Dwellings (A B C & D)
G) Loans On Manufactured Home Dwelling (A B C & D)
Number
Average Value
Number
Average Value
Number
Average Value
Number
Average Value
Number
Average Value
Number
Average Value
LOANS ORIGINATED
13
$105,599
66
$110,608
109
$116,854
13
$44,772
7
$98,439
5
$78,274
APPLICATIONS APPROVED, NOT ACCEPTED
0
$0
7
$99,299
11
$104,364
1
$72,250
1
$39,470
2
$47,835
APPLICATIONS DENIED
1
$61,550
27
$93,635
54
$97,587
5
$43,352
5
$106,504
9
$73,962
APPLICATIONS WITHDRAWN
1
$122,430
7
$130,360
29
$102,196
1
$13,380
1
$80,950
0
$0
FILES CLOSED FOR INCOMPLETENESS
1
$64,890
3
$68,683
9
$134,916
1
$129,790
0
$0
0
$0
Aggregated Statistics For Year 2003 (Based on 2 partial tracts)
A) FHA, FSA/RHS & VA Home Purchase Loans
B) Conventional Home Purchase Loans
C) Refinancings
D) Home Improvement Loans
F) Non-occupant Loans on < 5 Family Dwellings (A B C & D)
Number
Average Value
Number
Average Value
Number
Average Value
Number
Average Value
Number
Average Value
LOANS ORIGINATED
15
$104,543
47
$104,649
248
$103,665
6
$17,952
7
$73,781
APPLICATIONS APPROVED, NOT ACCEPTED
0
$0
4
$101,855
16
$109,131
1
$20,070
0
$0
APPLICATIONS DENIED
1
$122,430
11
$87,943
50
$106,759
1
$11,370
3
$109,940
APPLICATIONS WITHDRAWN
1
$123,100
2
$63,890
33
$112,696
1
$10,700
0
$0
FILES CLOSED FOR INCOMPLETENESS
1
$58,870
0
$0
9
$95,296
0
$0
1
$31,440
Aggregated Statistics For Year 2002 (Based on 2 partial tracts)
A) FHA, FSA/RHS & VA Home Purchase Loans
B) Conventional Home Purchase Loans
C) Refinancings
D) Home Improvement Loans
F) Non-occupant Loans on < 5 Family Dwellings (A B C & D)
Number
Average Value
Number
Average Value
Number
Average Value
Number
Average Value
Number
Average Value
LOANS ORIGINATED
14
$92,131
43
$107,833
156
$97,104
7
$26,187
10
$65,763
APPLICATIONS APPROVED, NOT ACCEPTED
0
$0
6
$89,535
14
$89,694
1
$10,040
1
$157,880
APPLICATIONS DENIED
1
$103,700
11
$80,341
40
$97,540
4
$32,447
1
$131,120
APPLICATIONS WITHDRAWN
1
$49,510
2
$73,255
27
$91,554
1
$25,420
0
$0
FILES CLOSED FOR INCOMPLETENESS
1
$58,200
1
$100,350
6
$79,945
0
$0
0
$0
Aggregated Statistics For Year 2001 (Based on 2 partial tracts)
A) FHA, FSA/RHS & VA Home Purchase Loans
B) Conventional Home Purchase Loans
C) Refinancings
D) Home Improvement Loans
F) Non-occupant Loans on < 5 Family Dwellings (A B C & D)
Number
Average Value
Number
Average Value
Number
Average Value
Number
Average Value
Number
Average Value
LOANS ORIGINATED
14
$95,380
47
$89,632
131
$86,638
8
$36,042
5
$71,584
APPLICATIONS APPROVED, NOT ACCEPTED
0
$0
5
$65,026
16
$87,054
2
$63,555
1
$29,440
APPLICATIONS DENIED
0
$0
5
$87,640
25
$112,285
9
$19,401
1
$30,770
APPLICATIONS WITHDRAWN
1
$131,790
2
$55,860
23
$77,895
3
$30,773
1
$69,580
FILES CLOSED FOR INCOMPLETENESS
0
$0
0
$0
3
$65,563
0
$0
0
$0
Aggregated Statistics For Year 2000 (Based on 2 partial tracts)
A) FHA, FSA/RHS & VA Home Purchase Loans
B) Conventional Home Purchase Loans
C) Refinancings
D) Home Improvement Loans
F) Non-occupant Loans on < 5 Family Dwellings (A B C & D)
Number
Average Value
Number
Average Value
Number
Average Value
Number
Average Value
Number
Average Value
LOANS ORIGINATED
13
$88,720
35
$77,260
39
$78,891
9
$18,063
3
$71,360
APPLICATIONS APPROVED, NOT ACCEPTED
1
$98,340
3
$64,223
7
$71,870
3
$28,990
1
$29,440
APPLICATIONS DENIED
1
$48,840
9
$48,168
18
$65,116
8
$15,220
0
$0
APPLICATIONS WITHDRAWN
2
$85,300
3
$92,543
15
$60,656
3
$41,477
0
$0
FILES CLOSED FOR INCOMPLETENESS
1
$52,850
0
$0
5
$52,584
0
$0
0
$0
Aggregated Statistics For Year 1999 (Based on 1 partial tract)
A) FHA, FSA/RHS & VA Home Purchase Loans
B) Conventional Home Purchase Loans
C) Refinancings
D) Home Improvement Loans
F) Non-occupant Loans on < 5 Family Dwellings (A B C & D)
Detailed PMIC statistics for the following Tracts:0049.00
2002 - 2018 National Fire Incident Reporting System (NFIRS) incidents
Based on the data from the years 2002 - 2018 the average number of fires per year is 14. The highest number of fire incidents - 42 took place in 2011, and the least - 0 in 2005. The data has a declining trend.
When looking into fire subcategories, the most reports belonged to: Outside Fires (60.4%), and Structure Fires (28.3%).
Fire incident types reported to NFIRS in Zip Code 65612
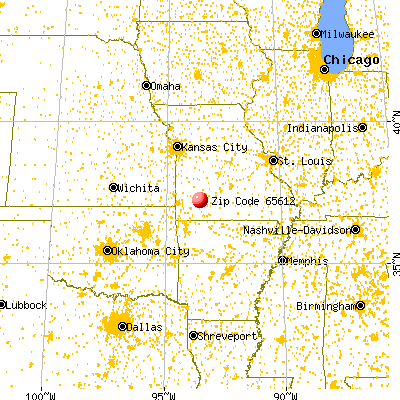


 Nearest zip codes: 65664, 65604, 65738, 65619, 65610, 65802.


 (Students: 165, Location: 10315 W STATE HWY T, Grades: 4-6)


 Based on the data from the years 2002 - 2018 the average number of fires per year is 14. The highest number of fire incidents - 42 took place in 2011, and the least - 0 in 2005. The data has a declining trend.
 When looking into fire subcategories, the most reports belonged to: Outside Fires (60.4%), and Structure Fires (28.3%).