Estimated zip code population in 2022: 1,070 Zip code population in 2010: 1,269 Zip code population in 2000: 1,176
Houses and condos: 427 Renter-occupied apartments: 87
% of renters here:
24%
State:
32%
March 2022 cost of living index in zip code 65662: 75.7 (low, U.S. average is 100)
Land area: 75.2 sq. mi. Water area: 0.1 sq. mi.
Population density: 14 people per square mile
(very low).
OSM Map
General Map
Google Map
MSN Map
OSM Map
General Map
Google Map
MSN Map
OSM Map
General Map
Google Map
MSN Map
OSM Map
General Map
Google Map
MSN Map
Please wait while loading the map...
Real estate property taxes paid for housing units in 2022:
This zip code:
0.3% ($596)
Missouri:
0.8% ($1,810)
Median real estate property taxes paid for housing units with mortgages in 2022: $786 (0.4%) Median real estate property taxes paid for housing units with no mortgage in 2022: $488 (0.3%)
Business Search- 14 Million verified businesses
Males: 673
(63.0%)
Females: 396
(37.0%)
For population 25 years and over in 65662:
High school or higher: 89.1%
Bachelor's degree or higher: 19.1%
Graduate or professional degree: 5.6%
Unemployed: 2.2%
Mean travel time to work (commute): 37.5 minutes
For population 15 years and over in 65662:
Never married: 21.1%
Now married: 53.6%
Separated: 0.0%
Widowed: 6.2%
Divorced: 19.1%
Zip code 65662 compared to state average:
Median household income significantly below state average.
Black race population percentage significantly below state average.
Hispanic race population percentage significantly below state average.
Median age significantly above state average.
Foreign-born population percentage significantly below state average.
Length of stay since moving in significantly above state average.
Percentage of population with a bachelor's degree or higher below state average.
Estimated median house/condo value in 2022: $185,702
65662:
$185,702
Missouri:
$221,200
According to our research of Missouri and other state lists, there were 5 registered sex offenders living in 65662 zip code as of May 29, 2024. The ratio of all residents to sex offenders in zip code 65662 is 283 to 1. The ratio of registered sex offenders to all residents in this zip code is near the state average.
Median resident age:
This zip code:
48.9 years
Missouri median age:
39.1 years
Average household size:
This zip code:
2.9 people
Missouri:
2.4 people
Averages for the 2020 tax year for zip code 65662, filed in 2021:
Average Adjusted Gross Income (AGI) in 2020: $40,980 (Individual Income Tax Returns)
Here:
$40,980
State:
$68,151
Salary/wage: $37,547 (reported on 76.0% of returns)
Here:
$37,547
State:
$56,131
(% of AGI for various income ranges: 1194.2% for AGIs below $25k, 3630.0% for AGIs $25k-50k, 6406.7% for AGIs $50k-75k, 9795.0% for AGIs $75k-100k, 10130.0% for AGIs $100k-200k)
Taxable interest for individuals: $1,154 (reported on 26.0% of returns)
This zip code:
$1,154
Missouri:
$1,586
(% of AGI for various income ranges: 51.7% for AGIs below $25k, 66.4% for AGIs $25k-50k, 75.0% for AGIs $75k-100k)
Ordinary dividends: $840 (reported on 10.0% of returns)
Here:
$840
State:
$10,947
(% of AGI for various income ranges: 9.2% for AGIs below $25k, 51.7% for AGIs $50k-75k)
Net capital gain/loss in AGI: +$4,112 (reported on 16.0% of returns)
Here:
+$4,112
State:
+$18,453
(% of AGI for various income ranges: 34.2% for AGIs below $25k, 97.3% for AGIs $25k-50k, 905.0% for AGIs $75k-100k)
Profit/loss from business: +$12,191 (reported on 22.0% of returns)
Here:
+$12,191
State:
+$12,260
(% of AGI for various income ranges: 468.3% for AGIs below $25k, 430.0% for AGIs $25k-50k, 510.0% for AGIs $50k-75k)
Taxable individual retirement arrangement distribution: $8,433 (reported on 6.0% of returns)
65662:
$8,433
Missouri:
$19,719
(% of AGI for various income ranges: 210.8% for AGIs below $25k)
Earned income credit: $2,467 (reported on 30.0% of returns)
Here:
$2,467
State:
$2,315
(% of AGI for various income ranges: 177.5% for AGIs below $25k, 142.7% for AGIs $25k-50k)
Percentage of individuals using paid preparers for their 2020 taxes: 96.0%
Here:
96%
State:
93%
(% for various income ranges: 95.2% for AGIs below $25k, 100.0% for AGIs $25k-50k, 100.0% for AGIs $50k-75k, 75.0% for AGIs $75k-100k, 100.0% for AGIs $100k-200k)
Averages for the 2012 tax year for zip code 65662, filed in 2013:
Average Adjusted Gross Income (AGI) in 2012: $31,633 (Individual Income Tax Returns)
Here:
$31,633
State:
$55,896
Salary/wage: $32,281 (reported on 78.3% of returns)
Here:
$32,281
State:
$46,205
(% of AGI for various income ranges: 69.4% for AGIs below $25k, 92.8% for AGIs $25k-50k, 79.5% for AGIs $50k-75k, 73.6% for AGIs $75k-100k)
Taxable interest for individuals: $777 (reported on 28.3% of returns)
This zip code:
$777
Missouri:
$1,559
(% of AGI for various income ranges: 2.0% for AGIs below $25k, 0.3% for AGIs $25k-50k, 0.4% for AGIs $50k-75k, 0.4% for AGIs $75k-100k)
Ordinary dividends: $680 (reported on 10.9% of returns)
Here:
$680
State:
$7,410
Net capital gain/loss in AGI: +$5,225 (reported on 17.4% of returns)
Here:
+$5,225
State:
+$11,579
(% of AGI for various income ranges: 8.6% for AGIs below $25k, 2.4% for AGIs $25k-50k, 1.8% for AGIs $50k-75k)
Profit/loss from business: +$6,550 (reported on 21.7% of returns)
Here:
+$6,550
State:
+$11,688
Taxable individual retirement arrangement distribution: $10,200 (reported on 4.3% of returns)
65662:
$10,200
Missouri:
$14,773
Total itemized deductions: $15,375 (24% of AGI, reported on 8.7% of returns)
Here:
$15,375
State:
$22,730
Here:
24.2% of AGI
State:
19.2% of AGI
Charity contributions: $3,500 (reported on 4.3% of returns)
Here:
$3,500
State:
$4,745
Taxes paid: $3,325 (reported on 8.7% of returns)
65662:
$3,325
State:
$8,399
Earned income credit: $2,457 (reported on 30.4% of returns)
Here:
$2,457
State:
$2,288
(% of AGI for various income ranges: 9.2% for AGIs below $25k, 1.8% for AGIs $25k-50k)
Percentage of individuals using paid preparers for their 2012 taxes: 73.9%
Here:
74%
State:
55%
(% for various income ranges: 70.8% for AGIs below $25k, 75.0% for AGIs $25k-50k, 83.3% for AGIs $50k-75k, 75.0% for AGIs $75k-100k)
Averages for the 2004 tax year for zip code 65662, filed in 2005:
Average Adjusted Gross Income (AGI) in 2004: $25,753 (Individual Income Tax Returns)
Here:
$25,753
State:
$44,591
Salary/wage: $25,746 (reported on 80.8% of returns)
Here:
$25,746
State:
$38,941
(% of AGI for various income ranges: 118.8% for AGIs below $10k, 76.9% for AGIs $10k-25k, 84.7% for AGIs $25k-50k, 89.7% for AGIs $50k-75k, 51.9% for AGIs $75k-100k)
Taxable interest for individuals: $970 (reported on 39.1% of returns)
This zip code:
$970
Missouri:
$1,801
(% of AGI for various income ranges: 4.8% for AGIs below $10k, 2.6% for AGIs $10k-25k, 1.4% for AGIs $25k-50k, 0.4% for AGIs $50k-75k, 0.7% for AGIs $75k-100k)
Taxable dividends: $595 (reported on 14.5% of returns)
Here:
$595
State:
$3,677
(% of AGI for various income ranges: 0.3% for AGIs below $10k, 0.5% for AGIs $10k-25k, 0.5% for AGIs $25k-50k, 0.2% for AGIs $50k-75k)
Net capital gain/loss: +$3,677 (reported on 18.8% of returns)
Here:
+$3,677
State:
+$8,915
(% of AGI for various income ranges: 3.1% for AGIs below $10k, 4.1% for AGIs $10k-25k, 2.7% for AGIs $25k-50k, 2.6% for AGIs $50k-75k)
Profit/loss from business: +$5,010 (reported on 19.8% of returns)
Here:
+$5,010
State:
+$9,793
(% of AGI for various income ranges: 4.5% for AGIs below $10k, 8.6% for AGIs $10k-25k, 3.9% for AGIs $25k-50k, 0.7% for AGIs $50k-75k)
Total itemized deductions: $14,083 (27% of AGI, reported on 9.4% of returns)
Here:
$14,083
State:
$18,261
Here:
27.3% of AGI
State:
20.5% of AGI
Charity contributions deductions: $2,968 (5% of AGI, reported on 6.1% of returns)
Here:
$2,968
State:
$3,665
Here:
4.9% of AGI
State:
3.9% of AGI
Total tax: $2,764 (reported on 66.3% of returns)
65662:
$2,764
State:
$6,999
(% of AGI for various income ranges: 3.6% for AGIs below $10k, 4.6% for AGIs $10k-25k, 5.6% for AGIs $25k-50k, 8.3% for AGIs $50k-75k, 15.0% for AGIs $75k-100k)
Earned income credit: $1,696 (reported on 26.4% of returns)
Here:
$1,696
State:
$1,728
Percentage of individuals using paid preparers for their 2004 taxes: 80.4%
Here:
80%
State:
62%
(% for various income ranges: 76.2% for AGIs below $10k, 84.5% for AGIs $10k-25k, 81.6% for AGIs $25k-50k, 72.0% for AGIs $50k-75k, 81.2% for AGIs $75k-100k)
Household received Food Stamps/SNAP in the past 12 months: 14 Household did not receive Food Stamps/SNAP in the past 12 months: 352
Women who had a birth in the past 12 months: 25 (18 now married, 6 unmarried) Women who did not have a birth in the past 12 months: 86 (78 now married, 7 unmarried)
Housing units in zip code 65662 with a mortgage: 145 Median monthly owner costs for units with a mortgage: $1,174 Median monthly owner costs for units without a mortgage: $406
Residents with income below the poverty level in 2022:
This zip code:
25.1%
Whole state:
13.2%
Residents with income below 50% of the poverty level in 2022:
This zip code:
21.4%
Whole state:
6.8%
Median number of rooms in houses and condos:
Here:
5.8
State:
6.4
Median number of rooms in apartments:
Here:
3.9
State:
4.4
Notable locations in this zip code not listed on our city pages
Notable locations in zip code 65662: Kindrick School (A), Grovespring Area Voluntary Fire Protection Association Station 1 (B). Display/hide their locations on the map
Churches in zip code 65662 include: Fairview Church (A), Pleasant View Church (B), Shady Church (C), Cuba Church (D). Display/hide their locations on the map
Size of family households: 146 2-persons, 64 3-persons, 24 4-persons, 30 5-persons, 10 7-or-more-persons
Size of nonfamily households: 82 1-person, 8 2-persons
206 married couples with children.
39 single-parent households (39 women).
94.1% of residents of 65662 zip code speak English at home.
4.4% of residents speak other Indo-European language at home (55% very well, 34% well, 11% not well).
0.2% of residents speak Asian or Pacific Island language at home (100% very well).
Foreign born population: 9 (0.9%) (30.2% of them are naturalized citizens)
This zip code:
0.9%
Whole state:
4.1%
33%Malaysia
36%American
22%German
18%Irish
15%European
4%English
Year of entry for the foreign-born population
02010 or later
22000 to 2009
01990 to 1999
22Before 1990
Facilities with environmental interests located in this zip code:
PITTS HOG FARM (S11, T31N, R15W in GROVE SPRING, MO)
(Integrated Compliance Information System) - ICIS-07-2003-0267, FORMAL ENFORCEMENT ACTION STATE MASTER (Missouri monitoring and compilance) - ICIS-2656411, ENFORCEMENT/COMPLIANCE ACTIVITY
FARMERS PRODUCERS EXCHANG (2135 HWY M in GROVESPRING, MO)
STATE MASTER (Missouri monitoring and compilance) - PCS-MOR240164, NPDES NON-MAJOR National Pollutant Discharge Elimination System NON-MAJOR (Tracking pollutant discharge elimination systems) - permit Business SIC classification: FARM SUPPLIES Alternative names: FARMERS PRODUCER EXCHANGE, MFA INCORPORATED
GREGS BODYWORKS (2008 HWY M in GROVESPRING, MO)
STATE MASTER (Missouri monitoring and compilance) - RCRAINFO-MOR000023804, CESQG Conditionally Exempt Small Quantity Generators, less than 100 kg/month of hazardous waste (Resource Conservation and Recovery Act (tracking hazardous waste)) - notification Business SIC classification: TOP, BODY, AND UPHOLSTERY REPAIR SHOPS AND PAINT SHOPS Business NAICS classification: AUTOMOTIVE BODY, PAINT, AND INTERIOR REPAIR AND MAINTENANCE. Organizations: GREG STILL (CONTACT/OWNER)
GROVESPRING ELEM. (9530 HWY 5 in GROVESPRING, MO)
(National Center for Education Statistics) - STATE ID-4020114113 Organizations: HARTVILLE R-II (SCHOOL DISTRICT)
Housing units lacking complete plumbing facilities: 7.3% Housing units lacking complete kitchen facilities: 5.5%
42.3%Wood
31.6%Bottled, tank, or LP gas
18.9%Electricity
5.4%Utility gas
2.8%Other fuel
Population in 1990: 2,121.
Place of birth for U.S.-born residents:
This state: 599
Northeast: 86
Midwest: 167
South: 117
West: 76
63% of the 65662 zip code residents lived in the same house 5 years ago. Out of people who lived in different houses, 44% lived in this county. Out of people who lived in different counties, 50% lived in Missouri.
97% of the 65662 zip code residents lived in the same house 1 year ago. Out of people who lived in different houses, 121% moved from different state.
Private vs. public school enrollment:
Students in private schools in grades 1 to 8 (elementary and middle school): 47
Here:
36.4%
Missouri:
15.4%
Students in private schools in grades 9 to 12 (high school):
Here:
0.0%
Missouri:
13.9%
Students in private undergraduate colleges:
Here:
0.0%
Missouri:
22.6%
Occupation by median earnings in the past 12 months ($)
57,042Education, training, and library occupations
41,823Construction and extraction occupations
35,373Transportation occupations
25,994Healthcare support occupations
16,784Production occupations
9,227Management occupations
Top industries in this zip code by the number of employees in 2005:
Accommodation and Food Services: Full-Service Restaurants (5-9 employees: 1 establishment)
Health Care and Social Assistance: Child Day Care Services (5-9: 1)
Other Services (except Public Administration): Automotive Body, Paint, and Interior Repair and Maintenance (5-9: 1)
Wholesale Trade: Motor Vehicle Supplies and New Parts Merchant Wholesalers (5-9: 1)
Construction: Painting and Wall Covering Contractors (1-4: 1)
Real Estate and Rental and Leasing: Lessors of Residential Buildings and Dwellings (1-4: 1)
Other Services (except Public Administration): General Automotive Repair (1-4: 1)
Other Services (except Public Administration): Reupholstery and Furniture Repair (1-4: 1)
Construction: Residential Remodelers (1-4: 1)
Fatal accident statistics in 2014:
Fatal accident count: 1
Vehicles involved in fatal accidents: 1
Fatal accidents caused by drunken drivers: 0
Fatalities: 1
Persons involved in fatal accidents: 1
Pedestrians involved in fatal accidents: 0
Fatal accident statistics in 2012:
Fatal accident count: 2
Vehicles involved in fatal accidents: 2
Fatal accidents caused by drunken drivers: 0
Fatalities: 2
Persons involved in fatal accidents: 3
Pedestrians involved in fatal accidents: 0
2002 - 2018 National Fire Incident Reporting System (NFIRS) incidents
Based on the data from the years 2002 - 2018 the average number of fire incidents per year is 16. The highest number of fires - 25 took place in 2005, and the least - 6 in 2013. The data has a rising trend.
When looking into fire subcategories, the most reports belonged to: Outside Fires (59.0%), and Structure Fires (29.7%).
Fire incident types reported to NFIRS in Zip Code 65662

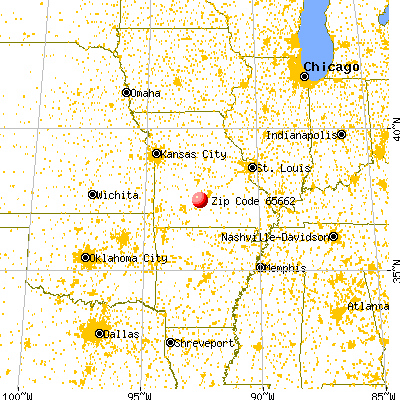


 Nearest zip codes: 65667, 65713, 65470, 65632, 65536, 65722.


 Based on the data from the years 2002 - 2018 the average number of fire incidents per year is 16. The highest number of fires - 25 took place in 2005, and the least - 6 in 2013. The data has a rising trend.
 When looking into fire subcategories, the most reports belonged to: Outside Fires (59.0%), and Structure Fires (29.7%).