Estimated zip code population in 2022: 2,790 Zip code population in 2010: 2,031 Zip code population in 2000: 1,634
Houses and condos: 1,035 Renter-occupied apartments: 123
% of renters here:
13%
State:
32%
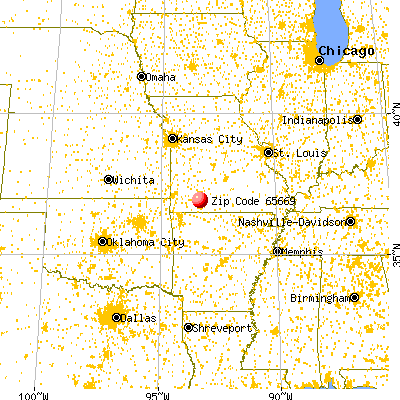
March 2022 cost of living index in zip code 65669: 77.2 (low, U.S. average is 100)
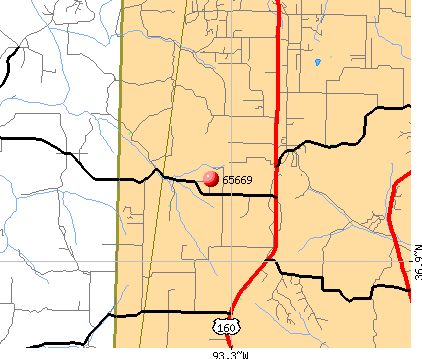
Land area: 40.9 sq. mi. Water area: 0.1 sq. mi.
Population density: 68 people per square mile
(very low).
OSM Map
General Map
Google Map
MSN Map
OSM Map
General Map
Google Map
MSN Map
OSM Map
General Map
Google Map
MSN Map
OSM Map
General Map
Google Map
MSN Map
Please wait while loading the map...
Real estate property taxes paid for housing units in 2022:
This zip code:
0.6% ($1,335)
Missouri:
0.8% ($1,810)
Median real estate property taxes paid for housing units with mortgages in 2022: $1,336 (0.6%) Median real estate property taxes paid for housing units with no mortgage in 2022: $1,330 (0.7%)
Estimated median house/condo value in 2022: $228,078
65669:
$228,078
Missouri:
$221,200
According to our research of Missouri and other state lists, there were 6 registered sex offenders living in 65669 zip code as of May 28, 2024. The ratio of all residents to sex offenders in zip code 65669 is 318 to 1. The ratio of registered sex offenders to all residents in this zip code is near the state average.
Median resident age:
This zip code:
44.6 years
Missouri median age:
39.1 years
Average household size:
This zip code:
3.0 people
Missouri:
2.4 people
Averages for the 2020 tax year for zip code 65669, filed in 2021:
Average Adjusted Gross Income (AGI) in 2020: $56,678 (Individual Income Tax Returns)
Here:
$56,678
State:
$68,151
Salary/wage: $50,746 (reported on 80.7% of returns)
Here:
$50,746
State:
$56,131
(% of AGI for various income ranges: 1162.6% for AGIs below $25k, 3501.3% for AGIs $25k-50k, 6771.4% for AGIs $50k-75k, 9272.0% for AGIs $75k-100k, 16852.5% for AGIs $100k-200k)
Taxable interest for individuals: $686 (reported on 29.4% of returns)
This zip code:
$686
Missouri:
$1,586
(% of AGI for various income ranges: 9.3% for AGIs below $25k, 33.3% for AGIs $25k-50k, 17.9% for AGIs $50k-75k, 44.0% for AGIs $75k-100k, 82.5% for AGIs $100k-200k)
Ordinary dividends: $1,558 (reported on 16.0% of returns)
Here:
$1,558
State:
$10,947
(% of AGI for various income ranges: 15.2% for AGIs below $25k, 31.2% for AGIs $25k-50k, 49.3% for AGIs $50k-75k, 43.0% for AGIs $75k-100k, 85.0% for AGIs $100k-200k)
Net capital gain/loss in AGI: +$7,400 (reported on 15.1% of returns)
Here:
+$7,400
State:
+$18,453
(% of AGI for various income ranges: 3.3% for AGIs below $25k, 27.9% for AGIs $25k-50k, 83.6% for AGIs $50k-75k, 468.0% for AGIs $75k-100k, 838.7% for AGIs $100k-200k)
Profit/loss from business: +$9,269 (reported on 21.8% of returns)
Here:
+$9,269
State:
+$12,260
(% of AGI for various income ranges: 140.4% for AGIs below $25k, 298.8% for AGIs $25k-50k, 512.9% for AGIs $50k-75k, 213.0% for AGIs $75k-100k, 478.7% for AGIs $100k-200k)
Taxable individual retirement arrangement distribution: $14,245 (reported on 9.2% of returns)
65669:
$14,245
Missouri:
$19,719
(% of AGI for various income ranges: 52.6% for AGIs below $25k, 112.5% for AGIs $25k-50k, 190.0% for AGIs $50k-75k, 889.0% for AGIs $75k-100k)
Total itemized deductions: $35,940 (reported on 4.2% of returns)
Here:
$35,940
State:
$36,651
(% of AGI for various income ranges: 2246.2% for AGIs $100k-200k)
Charity contributions: $14,000 (reported on 3.4% of returns)
Here:
$14,000
State:
$15,671
(% of AGI for various income ranges: 700.0% for AGIs $100k-200k)
Taxes paid: $6,880 (reported on 4.2% of returns)
65669:
$6,880
State:
$7,608
(% of AGI for various income ranges: 430.0% for AGIs $100k-200k)
Earned income credit: $2,142 (reported on 16.0% of returns)
Here:
$2,142
State:
$2,315
(% of AGI for various income ranges: 87.4% for AGIs below $25k, 71.2% for AGIs $25k-50k)
Percentage of individuals using paid preparers for their 2020 taxes: 94.1%
Here:
94%
State:
93%
(% for various income ranges: 92.1% for AGIs below $25k, 93.5% for AGIs $25k-50k, 100.0% for AGIs $50k-75k, 92.9% for AGIs $75k-100k, 92.9% for AGIs $100k-200k, 100.0% for AGIs over 200k)
Averages for the 2012 tax year for zip code 65669, filed in 2013:
Average Adjusted Gross Income (AGI) in 2012: $41,211 (Individual Income Tax Returns)
Here:
$41,211
State:
$55,896
Salary/wage: $37,892 (reported on 81.6% of returns)
Here:
$37,892
State:
$46,205
(% of AGI for various income ranges: 68.6% for AGIs below $25k, 80.5% for AGIs $25k-50k, 76.2% for AGIs $50k-75k, 78.3% for AGIs $75k-100k, 69.0% for AGIs $100k-200k)
Taxable interest for individuals: $584 (reported on 36.9% of returns)
This zip code:
$584
Missouri:
$1,559
(% of AGI for various income ranges: 1.3% for AGIs below $25k, 0.4% for AGIs $25k-50k, 0.3% for AGIs $50k-75k, 0.2% for AGIs $75k-100k, 0.7% for AGIs $100k-200k)
Ordinary dividends: $1,423 (reported on 12.6% of returns)
Here:
$1,423
State:
$7,410
(% of AGI for various income ranges: 0.2% for AGIs $25k-50k, 1.1% for AGIs $50k-75k, 0.4% for AGIs $100k-200k)
Net capital gain/loss in AGI: +$1,200 (reported on 11.7% of returns)
Here:
+$1,200
State:
+$11,579
(% of AGI for various income ranges: 0.2% for AGIs below $25k, 0.4% for AGIs $25k-50k, 1.0% for AGIs $100k-200k)
Profit/loss from business: +$8,996 (reported on 22.3% of returns)
Here:
+$8,996
State:
+$11,688
(% of AGI for various income ranges: 10.4% for AGIs below $25k, 3.9% for AGIs $25k-50k, 3.8% for AGIs $50k-75k, 10.7% for AGIs $75k-100k)
Taxable individual retirement arrangement distribution: $10,956 (reported on 8.7% of returns)
65669:
$10,956
Missouri:
$14,773
(% of AGI for various income ranges: 3.9% for AGIs below $25k, 3.5% for AGIs $25k-50k, 6.3% for AGIs $75k-100k)
Total itemized deductions: $17,393 (25% of AGI, reported on 27.2% of returns)
Here:
$17,393
State:
$22,730
Here:
25.1% of AGI
State:
19.2% of AGI
(% of AGI for various income ranges: 10.5% for AGIs below $25k, 9.2% for AGIs $25k-50k, 11.4% for AGIs $50k-75k, 13.7% for AGIs $75k-100k, 12.8% for AGIs $100k-200k)
Charity contributions: $4,822 (reported on 17.5% of returns)
Here:
$4,822
State:
$4,745
(% of AGI for various income ranges: 1.2% for AGIs below $25k, 1.5% for AGIs $25k-50k, 2.1% for AGIs $50k-75k, 1.9% for AGIs $75k-100k, 3.1% for AGIs $100k-200k)
Taxes paid: $4,261 (reported on 27.2% of returns)
65669:
$4,261
State:
$8,399
(% of AGI for various income ranges: 1.2% for AGIs below $25k, 1.9% for AGIs $25k-50k, 2.4% for AGIs $50k-75k, 3.3% for AGIs $75k-100k, 4.8% for AGIs $100k-200k)
Earned income credit: $1,835 (reported on 22.3% of returns)
Here:
$1,835
State:
$2,288
(% of AGI for various income ranges: 5.2% for AGIs below $25k, 1.5% for AGIs $25k-50k)
Percentage of individuals using paid preparers for their 2012 taxes: 64.1%
Here:
64%
State:
55%
(% for various income ranges: 56.8% for AGIs below $25k, 67.9% for AGIs $25k-50k, 70.6% for AGIs $50k-75k, 62.5% for AGIs $75k-100k, 83.3% for AGIs $100k-200k)
Averages for the 2004 tax year for zip code 65669, filed in 2005:
Average Adjusted Gross Income (AGI) in 2004: $35,321 (Individual Income Tax Returns)
Here:
$35,321
State:
$44,591
Salary/wage: $32,919 (reported on 83.9% of returns)
Here:
$32,919
State:
$38,941
(% of AGI for various income ranges: 99.3% for AGIs below $10k, 82.2% for AGIs $10k-25k, 82.2% for AGIs $25k-50k, 87.3% for AGIs $50k-75k, 77.2% for AGIs $75k-100k, 59.7% for AGIs over 100k)
Taxable interest for individuals: $1,462 (reported on 41.3% of returns)
This zip code:
$1,462
Missouri:
$1,801
(% of AGI for various income ranges: 18.1% for AGIs below $10k, 2.0% for AGIs $10k-25k, 1.2% for AGIs $25k-50k, 0.2% for AGIs $50k-75k, 0.6% for AGIs $75k-100k, 3.0% for AGIs over 100k)
Taxable dividends: $1,000 (reported on 16.0% of returns)
Here:
$1,000
State:
$3,677
(% of AGI for various income ranges: 3.7% for AGIs below $10k, 0.2% for AGIs $10k-25k, 0.2% for AGIs $25k-50k, 0.4% for AGIs $50k-75k, 0.2% for AGIs $75k-100k, 0.9% for AGIs over 100k)
Net capital gain/loss: +$5,366 (reported on 14.8% of returns)
Here:
+$5,366
State:
+$8,915
(% of AGI for various income ranges: 3.2% for AGIs below $10k, -0.2% for AGIs $10k-25k, 1.5% for AGIs $25k-50k, -0.0% for AGIs $50k-75k, 4.6% for AGIs $75k-100k, 5.7% for AGIs over 100k)
Profit/loss from business: +$4,832 (reported on 23.4% of returns)
Here:
+$4,832
State:
+$9,793
(% of AGI for various income ranges: -7.4% for AGIs below $10k, 7.1% for AGIs $10k-25k, 5.2% for AGIs $25k-50k, 0.5% for AGIs $50k-75k, 2.6% for AGIs $75k-100k, 1.8% for AGIs over 100k)
IRA payment deduction: $1,818 (reported on 1.2% of returns)
65669:
$1,818
Missouri:
$2,972
Total itemized deductions: $15,699 (25% of AGI, reported on 26.6% of returns)
Here:
$15,699
State:
$18,261
Here:
25.3% of AGI
State:
20.5% of AGI
(% of AGI for various income ranges: 11.1% for AGIs $10k-25k, 9.3% for AGIs $25k-50k, 14.8% for AGIs $50k-75k, 15.1% for AGIs $75k-100k, 11.9% for AGIs over 100k)
Charity contributions deductions: $3,208 (5% of AGI, reported on 22.2% of returns)
Here:
$3,208
State:
$3,665
Here:
5.0% of AGI
State:
3.9% of AGI
(% of AGI for various income ranges: 1.0% for AGIs $10k-25k, 1.2% for AGIs $25k-50k, 2.8% for AGIs $50k-75k, 3.2% for AGIs $75k-100k, 2.4% for AGIs over 100k)
Total tax: $4,295 (reported on 72.7% of returns)
65669:
$4,295
State:
$6,999
(% of AGI for various income ranges: 4.1% for AGIs below $10k, 4.1% for AGIs $10k-25k, 6.1% for AGIs $25k-50k, 8.0% for AGIs $50k-75k, 10.4% for AGIs $75k-100k, 16.0% for AGIs over 100k)
Earned income credit: $1,617 (reported on 18.3% of returns)
Here:
$1,617
State:
$1,728
Percentage of individuals using paid preparers for their 2004 taxes: 71.1%
Here:
71%
State:
62%
(% for various income ranges: 61.8% for AGIs below $10k, 70.7% for AGIs $10k-25k, 74.9% for AGIs $25k-50k, 65.8% for AGIs $50k-75k, 89.1% for AGIs $75k-100k, 86.8% for AGIs over 100k)
Likely homosexual households (counted as self-reported same-sex unmarried-partner households)
Lesbian couples: 0.6% of all households
Gay men: 0.0% of all households
Household received Food Stamps/SNAP in the past 12 months: 106 Household did not receive Food Stamps/SNAP in the past 12 months: 827
Women who had a birth in the past 12 months: 17 (16 now married, 0 unmarried) Women who did not have a birth in the past 12 months: 684 (375 now married, 306 unmarried)
Housing units in zip code 65669 with a mortgage: 470 (36 second mortgage, 23 both second mortgage and home equity loan) Median monthly owner costs for units with a mortgage: $1,320 Median monthly owner costs for units without a mortgage: $439
Residents with income below the poverty level in 2022:
This zip code:
12.9%
Whole state:
13.2%
Residents with income below 50% of the poverty level in 2022:
This zip code:
9.4%
Whole state:
6.8%
Median number of rooms in houses and condos:
Here:
5.9
State:
6.4
Median number of rooms in apartments:
Here:
4.9
State:
4.4
Notable locations in this zip code not listed on our city pages
Cemeteries: Lebow Cemetery (1), Martin Cemetery (2), Mayberry Cemetery (3), Flood Cemetery (4), Tory Cemetery (5), Highlandville Independent Order of Odd Fellows Cemetery (6). Display/hide their locations on the map
Size of family households: 366 2-persons, 156 3-persons, 165 4-persons, 93 5-persons, 15 6-persons, 9 7-or-more-persons
Size of nonfamily households: 110 1-person, 10 2-persons
296 married couples with children.
180 single-parent households (115 men, 65 women).
97.8% of residents of 65669 zip code speak English at home.
1.7% of residents speak Spanish at home (100% very well).
0.6% of residents speak other language at home (100% very well).
Foreign born population: 1 (0.1%) (100.0% of them are naturalized citizens)
This zip code:
0.1%
Whole state:
4.1%
100%Romania
34%English
28%American
10%German
7%Norwegian
4%Irish
2%French Canadian
2%European
Year of entry for the foreign-born population
02010 or later
02000 to 2009
11990 to 1999
16Before 1990
Facilities with environmental interests located in this zip code:
APAC MO INC-MASTER-JACKSO (HWY 65 SOUTH in HIGHLANDVILLE, MO)
STATE MASTER (Missouri monitoring and compilance) - PCS-MOG490574, NPDES NON-MAJOR National Pollutant Discharge Elimination System NON-MAJOR (Tracking pollutant discharge elimination systems) - permit Business SIC classification: CRUSHED AND BROKEN LIMESTONE Alternative names: APAC,MASTERS-JACKSON-BUSI, MASTERS-JACKSON DIV-BUSIE
HIGHLANDVILLE ELEM. (223 KENTLING AVE in HIGHLANDVILLE, MO)
(National Center for Education Statistics) - STATE ID-4020022094 Organizations: SPOKANE R-VII (SCHOOL DISTRICT)
GRAND RIDGE ESTATES SUBDI (WOODS FORK RD in HIGHLANDVILLE, MO)
National Pollutant Discharge Elimination System NON-MAJOR (Tracking pollutant discharge elimination systems) - permit National Pollutant Discharge Elimination System NON-MAJOR (Tracking pollutant discharge elimination systems) - permit Business SIC classification: HEAVY CONSTRUCTION Organizations: MARK MATHES (CONTACT/OWNER)
Alternative names: MARK MATHES, WOODS FORK RIDGE SUBDIVIS
HIGHLANDVILLE (462 KENTLING AVE in HIGHLANDVILLE, MO)
National Pollutant Discharge Elimination System NON-MAJOR (Tracking pollutant discharge elimination systems) - permit Business SIC classification: SEWERAGE SYSTEMS Alternative names: HIGHLANDVILLE WWTF
CITY OF HIGHLANDVILLE (FLEA MARKET RD in HIGHLANDVILLE, MO)
National Pollutant Discharge Elimination System NON-MAJOR (Tracking pollutant discharge elimination systems) - permit Business SIC classification: HEAVY CONSTRUCTION
Housing units lacking complete plumbing facilities: 2.3% Housing units lacking complete kitchen facilities: 0.3%
44.4%Electricity
35.1%Bottled, tank, or LP gas
14.0%Wood
5.6%Utility gas
0.9%No fuel used
Population in 1990: 2,106.
Place of birth for U.S.-born residents:
This state: 1,481
Northeast: 32
Midwest: 552
South: 502
West: 210
50% of the 65669 zip code residents lived in the same house 5 years ago. Out of people who lived in different houses, 42% lived in this county. Out of people who lived in different counties, 50% lived in Missouri.
95% of the 65669 zip code residents lived in the same house 1 year ago. Out of people who lived in different houses, 21% moved from this county. Out of people who lived in different houses, 69% moved from different county within same state. Out of people who lived in different houses, 16% moved from different state.
Private vs. public school enrollment:
Students in private schools in grades 1 to 8 (elementary and middle school): 90
Here:
32.2%
Missouri:
15.4%
Students in private schools in grades 9 to 12 (high school): 15
Here:
6.7%
Missouri:
13.9%
Students in private undergraduate colleges: 32
Here:
19.6%
Missouri:
22.6%
Occupation by median earnings in the past 12 months ($)
85,313Management occupations
62,510Education, training, and library occupations
57,826Office and administrative support occupations
55,529Transportation occupations
54,434Business and financial operations occupations
49,534Community and social service occupations
Top industries in this zip code by the number of employees in 2005:
Professional, Scientific, and Technical Services: Other Accounting Services (5-9 employees: 1 establishment)
Construction: Electrical Contractors (5-9: 1)
Construction: Commercial and Institutional Building Construction (1-4: 2)
Other Services (except Public Administration): Religious Organizations (1-4: 2)
Construction: Plumbing, Heating, and Air-Conditioning Contractors (1-4: 2)
Construction: Site Preparation Contractors (1-4: 2)
Finance and Insurance: Insurance Agencies and Brokerages (1-4: 1)
Fatal accident statistics in 2014:
Fatal accident count: 1
Vehicles involved in fatal accidents: 1
Fatal accidents caused by drunken drivers: 0
Fatalities: 4
Persons involved in fatal accidents: 8
Pedestrians involved in fatal accidents: 0
Fatal accident statistics in 2013:
Fatal accident count: 1
Vehicles involved in fatal accidents: 2
Fatal accidents caused by drunken drivers: 0
Fatalities: 1
Persons involved in fatal accidents: 6
Pedestrians involved in fatal accidents: 0
Home Mortgage Disclosure Act Aggregated Statistics For Year 2009 (Based on 2 partial tracts)
A) FHA, FSA/RHS & VA Home Purchase Loans
B) Conventional Home Purchase Loans
C) Refinancings
D) Home Improvement Loans
F) Non-occupant Loans on < 5 Family Dwellings (A B C & D)
G) Loans On Manufactured Home Dwelling (A B C & D)
Number
Average Value
Number
Average Value
Number
Average Value
Number
Average Value
Number
Average Value
Number
Average Value
LOANS ORIGINATED
8
$120,032
9
$150,148
59
$151,549
2
$103,455
5
$143,844
2
$45,980
APPLICATIONS APPROVED, NOT ACCEPTED
0
$0
0
$0
4
$192,875
0
$0
0
$0
0
$0
APPLICATIONS DENIED
2
$95,710
1
$74,050
15
$165,028
0
$0
0
$0
1
$52,510
APPLICATIONS WITHDRAWN
0
$0
1
$91,720
13
$161,786
0
$0
0
$0
0
$0
FILES CLOSED FOR INCOMPLETENESS
0
$0
0
$0
0
$0
0
$0
0
$0
0
$0
Aggregated Statistics For Year 2008 (Based on 2 partial tracts)
A) FHA, FSA/RHS & VA Home Purchase Loans
B) Conventional Home Purchase Loans
C) Refinancings
D) Home Improvement Loans
F) Non-occupant Loans on < 5 Family Dwellings (A B C & D)
G) Loans On Manufactured Home Dwelling (A B C & D)
Number
Average Value
Number
Average Value
Number
Average Value
Number
Average Value
Number
Average Value
Number
Average Value
LOANS ORIGINATED
6
$130,640
19
$153,428
38
$152,065
3
$86,637
5
$136,100
4
$47,190
APPLICATIONS APPROVED, NOT ACCEPTED
0
$0
1
$151,980
2
$180,530
0
$0
0
$0
0
$0
APPLICATIONS DENIED
1
$102,610
4
$109,020
23
$169,200
3
$75,100
2
$62,555
5
$48,012
APPLICATIONS WITHDRAWN
1
$97,530
2
$165,770
6
$150,080
0
$0
0
$0
1
$44,770
FILES CLOSED FOR INCOMPLETENESS
0
$0
0
$0
1
$205,460
0
$0
0
$0
0
$0
Aggregated Statistics For Year 2007 (Based on 2 partial tracts)
A) FHA, FSA/RHS & VA Home Purchase Loans
B) Conventional Home Purchase Loans
C) Refinancings
D) Home Improvement Loans
F) Non-occupant Loans on < 5 Family Dwellings (A B C & D)
G) Loans On Manufactured Home Dwelling (A B C & D)
Number
Average Value
Number
Average Value
Number
Average Value
Number
Average Value
Number
Average Value
Number
Average Value
LOANS ORIGINATED
4
$135,762
33
$148,581
39
$149,506
4
$30,310
8
$124,660
4
$67,578
APPLICATIONS APPROVED, NOT ACCEPTED
0
$0
3
$100,993
7
$109,350
1
$37,510
0
$0
2
$40,050
APPLICATIONS DENIED
0
$0
11
$183,854
29
$164,009
4
$57,052
2
$164,680
3
$50,820
APPLICATIONS WITHDRAWN
0
$0
1
$307,100
8
$145,896
1
$114,710
0
$0
1
$35,570
FILES CLOSED FOR INCOMPLETENESS
0
$0
0
$0
4
$133,282
0
$0
0
$0
0
$0
Aggregated Statistics For Year 2006 (Based on 2 partial tracts)
A) FHA, FSA/RHS & VA Home Purchase Loans
B) Conventional Home Purchase Loans
C) Refinancings
D) Home Improvement Loans
F) Non-occupant Loans on < 5 Family Dwellings (A B C & D)
G) Loans On Manufactured Home Dwelling (A B C & D)
Number
Average Value
Number
Average Value
Number
Average Value
Number
Average Value
Number
Average Value
Number
Average Value
LOANS ORIGINATED
2
$153,550
40
$124,340
45
$132,110
6
$49,085
7
$150,524
3
$57,273
APPLICATIONS APPROVED, NOT ACCEPTED
0
$0
6
$112,328
9
$117,289
2
$25,045
1
$108,170
1
$63,400
APPLICATIONS DENIED
1
$60,740
11
$124,630
28
$146,548
4
$43,620
0
$0
4
$58,988
APPLICATIONS WITHDRAWN
0
$0
7
$106,411
15
$130,019
1
$17,670
0
$0
0
$0
FILES CLOSED FOR INCOMPLETENESS
0
$0
1
$47,920
3
$171,093
0
$0
0
$0
0
$0
Aggregated Statistics For Year 2005 (Based on 2 partial tracts)
A) FHA, FSA/RHS & VA Home Purchase Loans
B) Conventional Home Purchase Loans
C) Refinancings
D) Home Improvement Loans
F) Non-occupant Loans on < 5 Family Dwellings (A B C & D)
G) Loans On Manufactured Home Dwelling (A B C & D)
Number
Average Value
Number
Average Value
Number
Average Value
Number
Average Value
Number
Average Value
Number
Average Value
LOANS ORIGINATED
3
$147,540
38
$116,045
40
$131,745
4
$38,418
4
$132,615
4
$57,475
APPLICATIONS APPROVED, NOT ACCEPTED
0
$0
5
$104,302
5
$107,496
0
$0
0
$0
1
$53,970
APPLICATIONS DENIED
2
$89,300
13
$83,472
30
$114,418
3
$37,913
3
$86,557
5
$64,566
APPLICATIONS WITHDRAWN
0
$0
5
$121,290
15
$145,765
1
$69,700
1
$139,630
1
$56,870
FILES CLOSED FOR INCOMPLETENESS
0
$0
1
$118,820
2
$140,965
0
$0
0
$0
0
$0
Aggregated Statistics For Year 2004 (Based on 2 partial tracts)
A) FHA, FSA/RHS & VA Home Purchase Loans
B) Conventional Home Purchase Loans
C) Refinancings
D) Home Improvement Loans
F) Non-occupant Loans on < 5 Family Dwellings (A B C & D)
G) Loans On Manufactured Home Dwelling (A B C & D)
Number
Average Value
Number
Average Value
Number
Average Value
Number
Average Value
Number
Average Value
Number
Average Value
LOANS ORIGINATED
5
$128,648
31
$100,336
47
$114,116
3
$31,943
4
$106,058
7
$46,153
APPLICATIONS APPROVED, NOT ACCEPTED
0
$0
3
$74,373
7
$82,730
1
$37,510
0
$0
2
$48,035
APPLICATIONS DENIED
0
$0
13
$80,977
30
$106,956
4
$44,285
0
$0
6
$68,607
APPLICATIONS WITHDRAWN
0
$0
4
$136,308
14
$105,131
0
$0
0
$0
1
$47,670
FILES CLOSED FOR INCOMPLETENESS
0
$0
0
$0
4
$90,388
0
$0
0
$0
0
$0
Aggregated Statistics For Year 2003 (Based on 2 partial tracts)
A) FHA, FSA/RHS & VA Home Purchase Loans
B) Conventional Home Purchase Loans
C) Refinancings
D) Home Improvement Loans
F) Non-occupant Loans on < 5 Family Dwellings (A B C & D)
Number
Average Value
Number
Average Value
Number
Average Value
Number
Average Value
Number
Average Value
LOANS ORIGINATED
4
$103,698
28
$94,112
81
$100,914
3
$27,347
5
$66,066
APPLICATIONS APPROVED, NOT ACCEPTED
0
$0
3
$65,583
8
$86,061
0
$0
0
$0
APPLICATIONS DENIED
0
$0
9
$72,708
31
$105,535
3
$39,687
1
$69,210
APPLICATIONS WITHDRAWN
0
$0
3
$133,180
12
$96,719
0
$0
0
$0
FILES CLOSED FOR INCOMPLETENESS
0
$0
1
$127,050
3
$143,667
0
$0
0
$0
Aggregated Statistics For Year 2002 (Based on 2 partial tracts)
A) FHA, FSA/RHS & VA Home Purchase Loans
B) Conventional Home Purchase Loans
C) Refinancings
D) Home Improvement Loans
F) Non-occupant Loans on < 5 Family Dwellings (A B C & D)
Number
Average Value
Number
Average Value
Number
Average Value
Number
Average Value
Number
Average Value
LOANS ORIGINATED
4
$109,262
23
$84,237
62
$100,118
2
$42,470
4
$70,785
APPLICATIONS APPROVED, NOT ACCEPTED
0
$0
4
$71,935
5
$94,186
0
$0
0
$0
APPLICATIONS DENIED
0
$0
9
$71,174
22
$85,173
2
$15,125
0
$0
APPLICATIONS WITHDRAWN
0
$0
2
$102,610
13
$126,156
0
$0
0
$0
FILES CLOSED FOR INCOMPLETENESS
0
$0
1
$56,630
2
$103,215
0
$0
0
$0
Aggregated Statistics For Year 2001 (Based on 2 partial tracts)
A) FHA, FSA/RHS & VA Home Purchase Loans
B) Conventional Home Purchase Loans
C) Refinancings
D) Home Improvement Loans
F) Non-occupant Loans on < 5 Family Dwellings (A B C & D)
Number
Average Value
Number
Average Value
Number
Average Value
Number
Average Value
Number
Average Value
LOANS ORIGINATED
6
$98,897
20
$74,694
51
$89,255
7
$22,886
3
$95,993
APPLICATIONS APPROVED, NOT ACCEPTED
0
$0
4
$69,695
6
$80,385
0
$0
0
$0
APPLICATIONS DENIED
0
$0
13
$69,547
19
$84,484
3
$11,373
1
$114,220
APPLICATIONS WITHDRAWN
0
$0
1
$139,390
11
$96,998
1
$14,520
0
$0
FILES CLOSED FOR INCOMPLETENESS
0
$0
0
$0
2
$133,825
0
$0
0
$0
Aggregated Statistics For Year 2000 (Based on 2 partial tracts)
A) FHA, FSA/RHS & VA Home Purchase Loans
B) Conventional Home Purchase Loans
C) Refinancings
D) Home Improvement Loans
F) Non-occupant Loans on < 5 Family Dwellings (A B C & D)
Number
Average Value
Number
Average Value
Number
Average Value
Number
Average Value
Number
Average Value
LOANS ORIGINATED
4
$75,322
21
$73,487
19
$77,861
5
$17,520
3
$61,063
APPLICATIONS APPROVED, NOT ACCEPTED
1
$59,050
5
$55,322
5
$76,230
1
$21,780
0
$0
APPLICATIONS DENIED
1
$99,700
17
$50,976
14
$81,416
4
$34,485
1
$121,000
APPLICATIONS WITHDRAWN
0
$0
2
$45,860
7
$74,536
1
$6,530
0
$0
FILES CLOSED FOR INCOMPLETENESS
0
$0
1
$63,890
1
$143,510
0
$0
0
$0
Aggregated Statistics For Year 1999 (Based on 1 partial tract)
A) FHA, FSA/RHS & VA Home Purchase Loans
B) Conventional Home Purchase Loans
C) Refinancings
D) Home Improvement Loans
F) Non-occupant Loans on < 5 Family Dwellings (A B C & D)
Detailed PMIC statistics for the following Tracts:0205.00
2002 - 2018 National Fire Incident Reporting System (NFIRS) incidents
Based on the data from the years 2002 - 2018 the average number of fire incidents per year is 23. The highest number of fires - 62 took place in 2006, and the least - 0 in 2003. The data has a declining trend.
When looking into fire subcategories, the most reports belonged to: Outside Fires (42.4%), and Structure Fires (38.8%).
Fire incident types reported to NFIRS in Zip Code 65669


 Nearest zip codes: 65728, 65754, 65721, 65630, 65714, 65631.


 Based on the data from the years 2002 - 2018 the average number of fire incidents per year is 23. The highest number of fires - 62 took place in 2006, and the least - 0 in 2003. The data has a declining trend.
 When looking into fire subcategories, the most reports belonged to: Outside Fires (42.4%), and Structure Fires (38.8%).