Estimated zip code population in 2022: 1,729 Zip code population in 2010: 2,014 Zip code population in 2000: 1,889
Houses and condos: 603 Renter-occupied apartments: 118
% of renters here:
22%
State:
32%
March 2022 cost of living index in zip code 65789: 75.8 (low, U.S. average is 100)
Land area: 79.7 sq. mi. Water area: 0.0 sq. mi.
Population density: 22 people per square mile
(very low).
OSM Map
General Map
Google Map
MSN Map
OSM Map
General Map
Google Map
MSN Map
OSM Map
General Map
Google Map
MSN Map
OSM Map
General Map
Google Map
MSN Map
Please wait while loading the map...
Real estate property taxes paid for housing units in 2022:
This zip code:
0.4% ($578)
Missouri:
0.8% ($1,810)
Median real estate property taxes paid for housing units with mortgages in 2022: $564 (0.3%) Median real estate property taxes paid for housing units with no mortgage in 2022: $654 (0.7%)
Business Search- 14 Million verified businesses
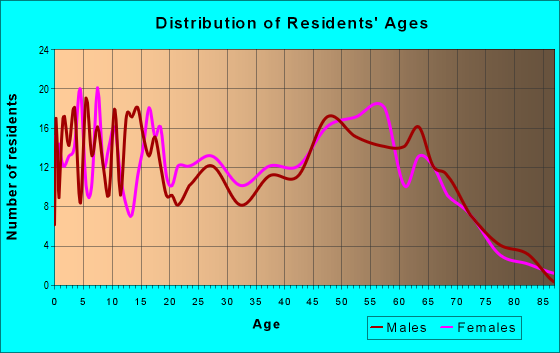
Males: 1,061
(61.4%)
Females: 667
(38.6%)
For population 25 years and over in 65789:
High school or higher: 90.3%
Bachelor's degree or higher: 16.8%
Graduate or professional degree: 7.8%
Unemployed: 7.9%
Mean travel time to work (commute): 22.9 minutes
For population 15 years and over in 65789:
Never married: 18.3%
Now married: 54.4%
Separated: 0.6%
Widowed: 11.9%
Divorced: 14.7%
Zip code 65789 compared to state average:
Median house value below state average.
Unemployed percentage above state average.
Black race population percentage significantly below state average.
Foreign-born population percentage significantly below state average.
Length of stay since moving in below state average.
House age below state average.
Number of college students below state average.
Percentage of population with a bachelor's degree or higher below state average.
Estimated median house/condo value in 2022: $138,666
65789:
$138,666
Missouri:
$221,200
According to our research of Missouri and other state lists, there were 7 registered sex offenders living in 65789 zip code as of May 28, 2024. The ratio of all residents to sex offenders in zip code 65789 is 278 to 1. The ratio of registered sex offenders to all residents in this zip code is near the state average.
Median resident age:
This zip code:
39.0 years
Missouri median age:
39.1 years
Average household size:
This zip code:
3.2 people
Missouri:
2.4 people
Averages for the 2020 tax year for zip code 65789, filed in 2021:
Average Adjusted Gross Income (AGI) in 2020: $45,699 (Individual Income Tax Returns)
Here:
$45,699
State:
$68,151
Salary/wage: $44,393 (reported on 75.3% of returns)
Here:
$44,393
State:
$56,131
(% of AGI for various income ranges: 1147.4% for AGIs below $25k, 3458.2% for AGIs $25k-50k, 6395.0% for AGIs $50k-75k, 11557.5% for AGIs $75k-100k, 16545.0% for AGIs $100k-200k)
Taxable interest for individuals: $604 (reported on 32.9% of returns)
This zip code:
$604
Missouri:
$1,586
(% of AGI for various income ranges: 7.9% for AGIs below $25k, 10.6% for AGIs $25k-50k, 23.8% for AGIs $50k-75k, 22.5% for AGIs $75k-100k, 210.0% for AGIs $100k-200k)
Ordinary dividends: $3,250 (reported on 13.7% of returns)
Here:
$3,250
State:
$10,947
(% of AGI for various income ranges: 4.2% for AGIs below $25k, 22.9% for AGIs $25k-50k, 227.5% for AGIs $75k-100k, 467.5% for AGIs $100k-200k)
Net capital gain/loss in AGI: +$7,627 (reported on 15.1% of returns)
Here:
+$7,627
State:
+$18,453
(% of AGI for various income ranges: 48.4% for AGIs below $25k, 277.5% for AGIs $50k-75k, 1312.5% for AGIs $100k-200k)
Profit/loss from business: +$9,042 (reported on 16.4% of returns)
Here:
+$9,042
State:
+$12,260
(% of AGI for various income ranges: 200.5% for AGIs below $25k, 373.5% for AGIs $25k-50k, 66.2% for AGIs $50k-75k, 40.0% for AGIs $75k-100k)
Taxable individual retirement arrangement distribution: $11,680 (reported on 6.8% of returns)
65789:
$11,680
Missouri:
$19,719
(% of AGI for various income ranges: 343.5% for AGIs $25k-50k)
Earned income credit: $2,462 (reported on 21.9% of returns)
Here:
$2,462
State:
$2,315
(% of AGI for various income ranges: 121.1% for AGIs below $25k, 96.5% for AGIs $25k-50k)
Percentage of individuals using paid preparers for their 2020 taxes: 94.5%
Here:
95%
State:
93%
(% for various income ranges: 92.9% for AGIs below $25k, 95.2% for AGIs $25k-50k, 90.9% for AGIs $50k-75k, 100.0% for AGIs $75k-100k, 100.0% for AGIs $100k-200k)
Averages for the 2012 tax year for zip code 65789, filed in 2013:
Average Adjusted Gross Income (AGI) in 2012: $36,763 (Individual Income Tax Returns)
Here:
$36,763
State:
$55,896
Salary/wage: $35,702 (reported on 83.1% of returns)
Here:
$35,702
State:
$46,205
(% of AGI for various income ranges: 79.6% for AGIs below $25k, 81.1% for AGIs $25k-50k, 81.1% for AGIs $50k-75k, 84.6% for AGIs $75k-100k, 77.6% for AGIs $100k-200k)
Taxable interest for individuals: $587 (reported on 32.4% of returns)
This zip code:
$587
Missouri:
$1,559
(% of AGI for various income ranges: 0.5% for AGIs below $25k, 0.6% for AGIs $25k-50k, 1.0% for AGIs $50k-75k, 0.2% for AGIs $75k-100k, 0.2% for AGIs $100k-200k)
Ordinary dividends: $1,020 (reported on 14.1% of returns)
Here:
$1,020
State:
$7,410
(% of AGI for various income ranges: 0.3% for AGIs below $25k, 0.9% for AGIs $25k-50k, 0.6% for AGIs $75k-100k)
Net capital gain/loss in AGI: +$5,878 (reported on 12.7% of returns)
Here:
+$5,878
State:
+$11,579
(% of AGI for various income ranges: 1.5% for AGIs below $25k, 3.7% for AGIs $25k-50k, 5.0% for AGIs $75k-100k)
Profit/loss from business: +$5,921 (reported on 19.7% of returns)
Here:
+$5,921
State:
+$11,688
(% of AGI for various income ranges: 8.5% for AGIs below $25k, 4.2% for AGIs $25k-50k, 2.4% for AGIs $50k-75k)
Taxable individual retirement arrangement distribution: $8,000 (reported on 7.0% of returns)
65789:
$8,000
Missouri:
$14,773
Total itemized deductions: $21,489 (26% of AGI, reported on 12.7% of returns)
Here:
$21,489
State:
$22,730
Here:
26.0% of AGI
State:
19.2% of AGI
(% of AGI for various income ranges: 8.4% for AGIs below $25k, 8.2% for AGIs $50k-75k, 12.3% for AGIs $75k-100k, 13.3% for AGIs $100k-200k)
Charity contributions: $4,329 (reported on 9.9% of returns)
Here:
$4,329
State:
$4,745
Taxes paid: $4,889 (reported on 12.7% of returns)
65789:
$4,889
State:
$8,399
(% of AGI for various income ranges: 1.1% for AGIs below $25k, 1.5% for AGIs $50k-75k, 2.6% for AGIs $75k-100k, 4.4% for AGIs $100k-200k)
Earned income credit: $2,330 (reported on 28.2% of returns)
Here:
$2,330
State:
$2,288
(% of AGI for various income ranges: 8.2% for AGIs below $25k, 1.4% for AGIs $25k-50k)
Percentage of individuals using paid preparers for their 2012 taxes: 69.0%
Here:
69%
State:
55%
(% for various income ranges: 63.6% for AGIs below $25k, 66.7% for AGIs $25k-50k, 80.0% for AGIs $50k-75k, 75.0% for AGIs $75k-100k, 100.0% for AGIs $100k-200k)
Averages for the 2004 tax year for zip code 65789, filed in 2005:
Average Adjusted Gross Income (AGI) in 2004: $28,985 (Individual Income Tax Returns)
Here:
$28,985
State:
$44,591
Salary/wage: $28,071 (reported on 85.8% of returns)
Here:
$28,071
State:
$38,941
(% of AGI for various income ranges: 127.1% for AGIs below $10k, 84.1% for AGIs $10k-25k, 84.2% for AGIs $25k-50k, 79.8% for AGIs $50k-75k, 81.2% for AGIs $75k-100k, 76.5% for AGIs over 100k)
Taxable interest for individuals: $704 (reported on 34.1% of returns)
This zip code:
$704
Missouri:
$1,801
(% of AGI for various income ranges: 2.5% for AGIs below $10k, 2.0% for AGIs $10k-25k, 0.7% for AGIs $25k-50k, 0.3% for AGIs $50k-75k, 0.1% for AGIs $75k-100k, 0.4% for AGIs over 100k)
Taxable dividends: $588 (reported on 14.1% of returns)
Here:
$588
State:
$3,677
(% of AGI for various income ranges: 0.4% for AGIs below $10k, 0.4% for AGIs $10k-25k, 0.3% for AGIs $25k-50k, 0.3% for AGIs $50k-75k, 0.2% for AGIs over 100k)
Net capital gain/loss: +$4,447 (reported on 14.2% of returns)
Here:
+$4,447
State:
+$8,915
(% of AGI for various income ranges: 5.3% for AGIs below $10k, 0.6% for AGIs $10k-25k, 2.3% for AGIs $25k-50k, 4.1% for AGIs $50k-75k, 2.4% for AGIs over 100k)
Profit/loss from business: +$4,391 (reported on 18.4% of returns)
Here:
+$4,391
State:
+$9,793
(% of AGI for various income ranges: 12.2% for AGIs below $10k, 7.8% for AGIs $10k-25k, 2.5% for AGIs $25k-50k, 0.0% for AGIs $50k-75k)
IRA payment deduction: $2,467 (reported on 2.1% of returns)
65789:
$2,467
Missouri:
$2,972
Total itemized deductions: $16,340 (28% of AGI, reported on 13.8% of returns)
Here:
$16,340
State:
$18,261
Here:
27.6% of AGI
State:
20.5% of AGI
(% of AGI for various income ranges: 4.5% for AGIs $10k-25k, 6.3% for AGIs $25k-50k, 9.0% for AGIs $50k-75k, 13.4% for AGIs $75k-100k, 12.5% for AGIs over 100k)
Charity contributions deductions: $2,513 (4% of AGI, reported on 10.8% of returns)
Here:
$2,513
State:
$3,665
Here:
4.0% of AGI
State:
3.9% of AGI
(% of AGI for various income ranges: 0.6% for AGIs $10k-25k, 0.7% for AGIs $25k-50k, 1.1% for AGIs $50k-75k, 1.5% for AGIs $75k-100k, 1.7% for AGIs over 100k)
Total tax: $3,092 (reported on 67.4% of returns)
65789:
$3,092
State:
$6,999
(% of AGI for various income ranges: 3.6% for AGIs below $10k, 3.5% for AGIs $10k-25k, 5.4% for AGIs $25k-50k, 7.8% for AGIs $50k-75k, 9.9% for AGIs $75k-100k, 16.0% for AGIs over 100k)
Earned income credit: $1,880 (reported on 24.2% of returns)
Here:
$1,880
State:
$1,728
Percentage of individuals using paid preparers for their 2004 taxes: 73.3%
Here:
73%
State:
62%
(% for various income ranges: 68.8% for AGIs below $10k, 70.2% for AGIs $10k-25k, 79.8% for AGIs $25k-50k, 74.3% for AGIs $50k-75k, 76.0% for AGIs $75k-100k, 84.2% for AGIs over 100k)
Household received Food Stamps/SNAP in the past 12 months: 86 Household did not receive Food Stamps/SNAP in the past 12 months: 453
Women who had a birth in the past 12 months: 31 (30 now married, 0 unmarried) Women who did not have a birth in the past 12 months: 222 (157 now married, 64 unmarried)
Housing units in zip code 65789 with a mortgage: 252 (2 second mortgage, 2 both second mortgage and home equity loan) Median monthly owner costs for units with a mortgage: $1,026 Median monthly owner costs for units without a mortgage: $420
Residents with income below the poverty level in 2022:
This zip code:
26.5%
Whole state:
13.2%
Residents with income below 50% of the poverty level in 2022:
This zip code:
13.1%
Whole state:
6.8%
Median number of rooms in houses and condos:
Here:
5.9
State:
6.4
Median number of rooms in apartments:
Here:
5.9
State:
4.4
Notable locations in this zip code not listed on our city pages
Notable locations in zip code 65789: Peace Valley - White Church Volunteer Station 1 Headquarters (A), Pomona Fire Protection District 2 (B), Eleven Point Rural Fire Department Station 3 (C). Display/hide their locations on the map
Churches in zip code 65789 include: Mount Zion Church (A), White Church Church (B), Antioch Church (C), Lost Camp Church (D), New Liberty Church (E), Antioch Church (F), Mount Zion Church (G). Display/hide their locations on the map
Cemeteries: Lost Camp Cemetery (1), Burnham Cemetery (2), Pleasant View Cemetery (3), Epps Cemetery (4), New Liberty Cemetery (5). Display/hide their locations on the map
Size of family households: 205 2-persons, 92 3-persons, 102 4-persons, 11 5-persons, 26 7-or-more-persons
Size of nonfamily households: 76 1-person, 8 2-persons, 9 3-persons
283 married couples with children.
66 single-parent households (66 men).
97.6% of residents of 65789 zip code speak English at home.
0.9% of residents speak Spanish at home (100% very well).
1.6% of residents speak other Indo-European language at home (100% very well).
Foreign born population: 8 (0.5%) (0.0% of them are naturalized citizens)
:
0.5%
Whole state:
4.1%
112%France
18%Irish
15%English
11%American
10%German
2%Scotch-Irish
1%European
1%Scottish
Year of entry for the foreign-born population
02010 or later
02000 to 2009
01990 to 1999
8Before 1990
Facilities with environmental interests located in this zip code:
BURLINGTON NORTHERN SANTA FE (MILEPOST 306.1 in POMONA, MO)
STATE MASTER (Missouri monitoring and compilance) - RCRAINFO-MOP000502302, NOT IN A UNIVERSE (Resource Conservation and Recovery Act (tracking hazardous waste))
Housing units lacking complete plumbing facilities: 2.2% Housing units lacking complete kitchen facilities: 5.2%
46.1%Bottled, tank, or LP gas
25.4%Electricity
15.3%Wood
9.3%Utility gas
3.6%Other fuel
0.6%No fuel used
Population in 1990: 1,309. Population change in the 1990s: +580 (+44.3%).
Place of birth for U.S.-born residents:
This state: 945
Northeast: 72
Midwest: 178
South: 140
West: 401
54% of the 65789 zip code residents lived in the same house 5 years ago. Out of people who lived in different houses, 59% lived in this county. Out of people who lived in different counties, 50% lived in Missouri.
91% of the 65789 zip code residents lived in the same house 1 year ago. Out of people who lived in different houses, 96% moved from this county.
Private vs. public school enrollment:
Students in private schools in grades 1 to 8 (elementary and middle school): 55
Here:
23.0%
Missouri:
15.4%
Students in private schools in grades 9 to 12 (high school):
Here:
0.0%
Missouri:
13.9%
Students in private undergraduate colleges:
Here:
0.0%
Missouri:
22.6%
Occupation by median earnings in the past 12 months ($)
59,847Health diagnosing and treating practitioners and other technical occupations
46,285Sales and related occupations
39,859Installation, maintenance, and repair occupations
39,038Transportation occupations
28,884Office and administrative support occupations
25,783Construction and extraction occupations
Top industries in this zip code by the number of employees in 2005:
Wholesale Trade: Other Grocery and Related Products Merchant Wholesalers (20-49 employees: 1 establishment)
Construction: Glass and Glazing Contractors (5-9: 1)
Construction: Commercial and Institutional Building Construction (5-9: 1)
Health Care and Social Assistance: Vocational Rehabilitation Services (5-9: 1)
Other Services (except Public Administration): Other Similar Organizations (except Business, Professional, Labor, and Political Organizations) (5-9: 1)
Construction: All Other Specialty Trade Contractors (1-4: 1)
Fatal accident statistics in 2014:
Fatal accident count: 1
Vehicles involved in fatal accidents: 2
Fatal accidents caused by drunken drivers: 0
Fatalities: 1
Persons involved in fatal accidents: 2
Pedestrians involved in fatal accidents: 0
Fatal accident statistics in 2012:
Fatal accident count: 1
Vehicles involved in fatal accidents: 1
Fatal accidents caused by drunken drivers: 1
Fatalities: 2
Persons involved in fatal accidents: 2
Pedestrians involved in fatal accidents: 0
2002 - 2017 National Fire Incident Reporting System (NFIRS) incidents
Based on the data from the years 2002 - 2017 the average number of fires per year is 17. The highest number of reported fire incidents - 41 took place in 2007, and the least - 3 in 2014. The data has a rising trend.
When looking into fire subcategories, the most reports belonged to: Outside Fires (38.4%), and Structure Fires (29.1%).
Fire incident types reported to NFIRS in Zip Code 65789


 Nearest zip codes: 65793, 65775, 65788, 65548, 65790, 65464.


 Based on the data from the years 2002 - 2017 the average number of fires per year is 17. The highest number of reported fire incidents - 41 took place in 2007, and the least - 3 in 2014. The data has a rising trend.
 When looking into fire subcategories, the most reports belonged to: Outside Fires (38.4%), and Structure Fires (29.1%).