Estimated zip code population in 2022: 2,973 Zip code population in 2010: 3,335 Zip code population in 2000: 2,913
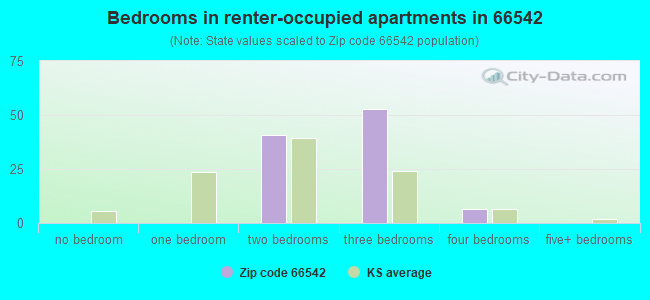
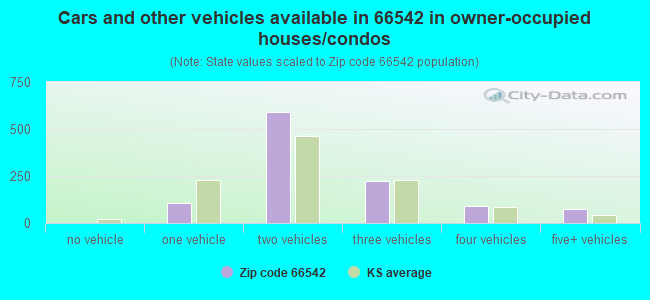
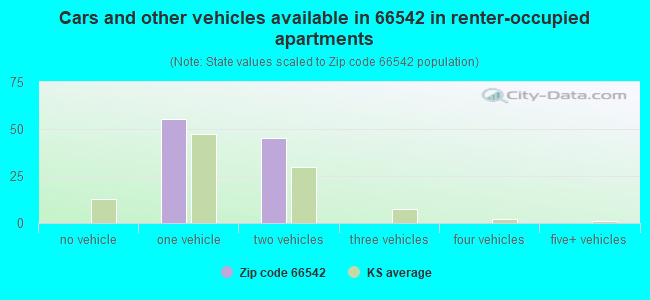
Houses and condos: 1,181 Renter-occupied apartments: 100
% of renters here:
9%
State:
32%
March 2022 cost of living index in zip code 66542: 79.3 (low, U.S. average is 100)
Land area: 32.5 sq. mi. Water area: 1.0 sq. mi.
Population density: 91 people per square mile
(very low).
OSM Map
General Map
Google Map
MSN Map
OSM Map
General Map
Google Map
MSN Map
OSM Map
General Map
Google Map
MSN Map
OSM Map
General Map
Google Map
MSN Map
Please wait while loading the map...
Real estate property taxes paid for housing units in 2022:
This zip code:
1.4% ($2,900)
Kansas:
1.2% ($2,578)
Median real estate property taxes paid for housing units with mortgages in 2022: $3,290 (1.5%) Median real estate property taxes paid for housing units with no mortgage in 2022: $2,608 (1.7%)
Business Search- 14 Million verified businesses
Males: 1,548
(52.1%)
Females: 1,424
(47.9%)
For population 25 years and over in 66542:
High school or higher: 99.0%
Bachelor's degree or higher: 42.4%
Graduate or professional degree: 14.1%
Unemployed: 0.5%
Mean travel time to work (commute): 22.1 minutes
For population 15 years and over in 66542:
Never married: 10.7%
Now married: 74.6%
Separated: 0.3%
Widowed: 4.2%
Divorced: 10.2%
Zip code 66542 compared to state average:
Median household income above state average.
Unemployed percentage significantly below state average.
Black race population percentage significantly below state average.
Median age significantly above state average.
Foreign-born population percentage significantly below state average.
Renting percentage significantly below state average.
Length of stay since moving in significantly above state average.
Estimated median house/condo value in 2022: $207,473
66542:
$207,473
Kansas:
$206,600
According to our research of Kansas and other state lists, there were 9 registered sex offenders living in 66542 zip code as of May 23, 2024. The ratio of all residents to sex offenders in zip code 66542 is 374 to 1. The ratio of registered sex offenders to all residents in this zip code is lower than the state average.
Median resident age:
This zip code:
47.7 years
Kansas median age:
37.6 years
Average household size:
This zip code:
2.5 people
Kansas:
2.4 people
Averages for the 2020 tax year for zip code 66542, filed in 2021:
Average Adjusted Gross Income (AGI) in 2020: $74,177 (Individual Income Tax Returns)
Here:
$74,177
State:
$72,721
Salary/wage: $63,951 (reported on 77.0% of returns)
Here:
$63,951
State:
$58,641
(% of AGI for various income ranges: 1033.6% for AGIs below $25k, 3432.6% for AGIs $25k-50k, 6039.4% for AGIs $50k-75k, 8574.4% for AGIs $75k-100k, 16275.4% for AGIs $100k-200k)
Taxable interest for individuals: $1,153 (reported on 44.3% of returns)
This zip code:
$1,153
Kansas:
$1,625
(% of AGI for various income ranges: 43.2% for AGIs below $25k, 85.9% for AGIs $25k-50k, 52.8% for AGIs $50k-75k, 49.4% for AGIs $75k-100k, 116.3% for AGIs $100k-200k)
Ordinary dividends: $5,243 (reported on 21.3% of returns)
Here:
$5,243
State:
$7,290
(% of AGI for various income ranges: 36.1% for AGIs below $25k, 38.9% for AGIs $25k-50k, 66.1% for AGIs $50k-75k, 88.1% for AGIs $75k-100k, 167.9% for AGIs $100k-200k)
Net capital gain/loss in AGI: +$6,117 (reported on 20.1% of returns)
Here:
+$6,117
State:
+$20,511
(% of AGI for various income ranges: 9.3% for AGIs below $25k, 44.4% for AGIs $25k-50k, 96.7% for AGIs $50k-75k, 122.5% for AGIs $75k-100k, 215.0% for AGIs $100k-200k)
Profit/loss from business: +$19,444 (reported on 14.4% of returns)
Here:
+$19,444
State:
+$13,852
(% of AGI for various income ranges: 79.3% for AGIs below $25k, 146.3% for AGIs $25k-50k, 132.8% for AGIs $50k-75k, 158.8% for AGIs $75k-100k, 1562.9% for AGIs $100k-200k)
Taxable individual retirement arrangement distribution: $24,080 (reported on 17.2% of returns)
66542:
$24,080
Kansas:
$19,921
(% of AGI for various income ranges: 122.5% for AGIs below $25k, 222.6% for AGIs $25k-50k, 475.6% for AGIs $50k-75k, 436.9% for AGIs $75k-100k, 1968.8% for AGIs $100k-200k)
Total itemized deductions: $31,233 (reported on 5.2% of returns)
Here:
$31,233
State:
$36,939
(% of AGI for various income ranges: 617.8% for AGIs $50k-75k, 707.9% for AGIs $100k-200k)
Charity contributions: $9,814 (reported on 4.0% of returns)
Here:
$9,814
State:
$15,443
(% of AGI for various income ranges: 46.3% for AGIs $25k-50k, 234.2% for AGIs $100k-200k)
Taxes paid: $7,544 (reported on 5.2% of returns)
66542:
$7,544
State:
$8,001
(% of AGI for various income ranges: 130.6% for AGIs $50k-75k, 185.0% for AGIs $100k-200k)
Earned income credit: $1,929 (reported on 8.0% of returns)
Here:
$1,929
State:
$2,267
(% of AGI for various income ranges: 42.1% for AGIs below $25k, 56.3% for AGIs $25k-50k)
Percentage of individuals using paid preparers for their 2020 taxes: 95.4%
Here:
95%
State:
95%
(% for various income ranges: 92.9% for AGIs below $25k, 97.2% for AGIs $25k-50k, 96.3% for AGIs $50k-75k, 95.5% for AGIs $75k-100k, 95.1% for AGIs $100k-200k, 100.0% for AGIs over 200k)
Averages for the 2012 tax year for zip code 66542, filed in 2013:
Average Adjusted Gross Income (AGI) in 2012: $63,961 (Individual Income Tax Returns)
Here:
$63,961
State:
$60,095
Salary/wage: $56,143 (reported on 81.2% of returns)
Here:
$56,143
State:
$48,770
(% of AGI for various income ranges: 67.1% for AGIs below $25k, 64.2% for AGIs $25k-50k, 72.8% for AGIs $50k-75k, 78.4% for AGIs $75k-100k, 74.4% for AGIs $100k-200k, 58.1% for AGIs over 200k)
Taxable interest for individuals: $1,204 (reported on 48.8% of returns)
This zip code:
$1,204
Kansas:
$1,506
(% of AGI for various income ranges: 2.6% for AGIs below $25k, 1.1% for AGIs $25k-50k, 0.5% for AGIs $50k-75k, 0.6% for AGIs $75k-100k, 0.3% for AGIs $100k-200k, 2.7% for AGIs over 200k)
Ordinary dividends: $2,761 (reported on 25.9% of returns)
Here:
$2,761
State:
$6,093
(% of AGI for various income ranges: 1.2% for AGIs below $25k, 1.1% for AGIs $25k-50k, 1.0% for AGIs $50k-75k, 0.9% for AGIs $75k-100k, 1.1% for AGIs $100k-200k, 1.7% for AGIs over 200k)
Net capital gain/loss in AGI: +$10,597 (reported on 18.8% of returns)
Here:
+$10,597
State:
+$14,598
(% of AGI for various income ranges: 0.7% for AGIs $50k-75k, 0.6% for AGIs $75k-100k, 1.6% for AGIs $100k-200k, 18.5% for AGIs over 200k)
Profit/loss from business: +$9,320 (reported on 14.7% of returns)
Here:
+$9,320
State:
+$12,554
(% of AGI for various income ranges: 4.9% for AGIs below $25k, 2.7% for AGIs $25k-50k, 2.6% for AGIs $50k-75k, 2.2% for AGIs $75k-100k, 2.0% for AGIs $100k-200k)
Taxable individual retirement arrangement distribution: $11,670 (reported on 15.9% of returns)
66542:
$11,670
Kansas:
$14,098
(% of AGI for various income ranges: 5.6% for AGIs below $25k, 4.3% for AGIs $25k-50k, 2.5% for AGIs $50k-75k, 2.8% for AGIs $75k-100k, 3.3% for AGIs $100k-200k)
Total itemized deductions: $20,313 (20% of AGI, reported on 41.2% of returns)
Here:
$20,313
State:
$23,678
Here:
20.2% of AGI
State:
18.9% of AGI
(% of AGI for various income ranges: 14.1% for AGIs below $25k, 12.4% for AGIs $25k-50k, 14.6% for AGIs $50k-75k, 11.7% for AGIs $75k-100k, 13.3% for AGIs $100k-200k, 12.9% for AGIs over 200k)
Charity contributions: $3,379 (reported on 32.9% of returns)
Here:
$3,379
State:
$5,321
(% of AGI for various income ranges: 0.9% for AGIs below $25k, 1.4% for AGIs $25k-50k, 1.3% for AGIs $50k-75k, 1.8% for AGIs $75k-100k, 1.9% for AGIs $100k-200k, 2.5% for AGIs over 200k)
Taxes paid: $8,086 (reported on 41.2% of returns)
66542:
$8,086
State:
$9,548
(% of AGI for various income ranges: 2.8% for AGIs below $25k, 3.3% for AGIs $25k-50k, 4.5% for AGIs $50k-75k, 4.6% for AGIs $75k-100k, 6.4% for AGIs $100k-200k, 6.5% for AGIs over 200k)
Earned income credit: $1,693 (reported on 8.8% of returns)
Here:
$1,693
State:
$2,212
(% of AGI for various income ranges: 3.0% for AGIs below $25k, 0.6% for AGIs $25k-50k)
Percentage of individuals using paid preparers for their 2012 taxes: 52.4%
Here:
52%
State:
56%
(% for various income ranges: 44.0% for AGIs below $25k, 54.3% for AGIs $25k-50k, 60.7% for AGIs $50k-75k, 52.0% for AGIs $75k-100k, 62.1% for AGIs $100k-200k)
Averages for the 2004 tax year for zip code 66542, filed in 2005:
Average Adjusted Gross Income (AGI) in 2004: $50,450 (Individual Income Tax Returns)
Here:
$50,450
State:
$45,726
Salary/wage: $46,798 (reported on 84.1% of returns)
Here:
$46,798
State:
$40,112
(% of AGI for various income ranges: 115.3% for AGIs below $10k, 67.0% for AGIs $10k-25k, 70.3% for AGIs $25k-50k, 82.3% for AGIs $50k-75k, 83.9% for AGIs $75k-100k, 74.6% for AGIs over 100k)
Taxable interest for individuals: $945 (reported on 59.8% of returns)
This zip code:
$945
Kansas:
$1,749
(% of AGI for various income ranges: 5.9% for AGIs below $10k, 3.9% for AGIs $10k-25k, 1.7% for AGIs $25k-50k, 0.5% for AGIs $50k-75k, 0.6% for AGIs $75k-100k, 0.9% for AGIs over 100k)
Taxable dividends: $1,679 (reported on 31.7% of returns)
Here:
$1,679
State:
$3,066
(% of AGI for various income ranges: 2.9% for AGIs below $10k, 1.0% for AGIs $10k-25k, 1.1% for AGIs $25k-50k, 0.4% for AGIs $50k-75k, 0.8% for AGIs $75k-100k, 1.7% for AGIs over 100k)
Net capital gain/loss: +$4,654 (reported on 22.3% of returns)
Here:
+$4,654
State:
+$7,555
(% of AGI for various income ranges: -3.2% for AGIs below $10k, 0.0% for AGIs $10k-25k, 0.9% for AGIs $25k-50k, 0.1% for AGIs $50k-75k, 0.1% for AGIs $75k-100k, 6.2% for AGIs over 100k)
Profit/loss from business: +$7,653 (reported on 18.2% of returns)
Here:
+$7,653
State:
+$9,571
(% of AGI for various income ranges: 2.3% for AGIs below $10k, 1.5% for AGIs $10k-25k, 5.0% for AGIs $25k-50k, 4.5% for AGIs $50k-75k, 1.9% for AGIs $75k-100k, 1.2% for AGIs over 100k)
IRA payment deduction: $2,786 (reported on 2.6% of returns)
66542:
$2,786
Kansas:
$2,922
Self-employed pension: $8,000 (reported on 0.9% of returns)
Here:
$8,000
Kansas:
$14,209
Total itemized deductions: $16,218 (20% of AGI, reported on 42.3% of returns)
Here:
$16,218
State:
$18,779
Here:
19.8% of AGI
State:
20.5% of AGI
(% of AGI for various income ranges: 12.4% for AGIs below $10k, 11.4% for AGIs $10k-25k, 12.1% for AGIs $25k-50k, 14.6% for AGIs $50k-75k, 14.6% for AGIs $75k-100k, 13.2% for AGIs over 100k)
Charity contributions deductions: $2,680 (3% of AGI, reported on 37.6% of returns)
Here:
$2,680
State:
$3,892
Here:
3.2% of AGI
State:
4.0% of AGI
(% of AGI for various income ranges: 1.7% for AGIs $10k-25k, 1.5% for AGIs $25k-50k, 2.1% for AGIs $50k-75k, 2.0% for AGIs $75k-100k, 2.3% for AGIs over 100k)
Total tax: $6,784 (reported on 80.6% of returns)
66542:
$6,784
State:
$7,203
(% of AGI for various income ranges: 2.5% for AGIs below $10k, 4.1% for AGIs $10k-25k, 7.1% for AGIs $25k-50k, 8.1% for AGIs $50k-75k, 10.5% for AGIs $75k-100k, 16.7% for AGIs over 100k)
Earned income credit: $1,367 (reported on 5.6% of returns)
Here:
$1,367
State:
$1,674
Percentage of individuals using paid preparers for their 2004 taxes: 57.9%
Here:
58%
State:
63%
(% for various income ranges: 47.7% for AGIs below $10k, 56.9% for AGIs $10k-25k, 62.6% for AGIs $25k-50k, 61.3% for AGIs $50k-75k, 59.0% for AGIs $75k-100k, 61.1% for AGIs over 100k)
Likely homosexual households (counted as self-reported same-sex unmarried-partner households)
Lesbian couples: 1.0% of all households
Gay men: 0.0% of all households
Household received Food Stamps/SNAP in the past 12 months: 9 Household did not receive Food Stamps/SNAP in the past 12 months: 1,161
Women who had a birth in the past 12 months: 25 (26 now married, 0 unmarried) Women who did not have a birth in the past 12 months: 503 (385 now married, 116 unmarried)
Housing units in zip code 66542 with a mortgage: 625 (81 second mortgage, 42 both second mortgage and home equity loan) Houses without a mortgage: 34
Median monthly owner costs for units with a mortgage: $1,578 Median monthly owner costs for units without a mortgage: $615
Residents with income below the poverty level in 2022:
This zip code:
1.0%
Whole state:
12.0%
Residents with income below 50% of the poverty level in 2022:
This zip code:
1.0%
Whole state:
6.4%
Median number of rooms in houses and condos:
Here:
7.1
State:
6.9
Median number of rooms in apartments:
Here:
5.7
State:
4.4
Notable locations in this zip code not listed on our city pages
Notable locations in zip code 66542: Topeka Service Area (A), Shawnee Heights Unified School District 450 Police Office (B), KMAJ - AM (Topeka) (C), Shawnee Heights Fire Protection District Station 21 (D). Display/hide their locations on the map
Churches in zip code 66542 include: Tecumseh United Methodist Church (A), Shawnee Heights United Methodist Church (B), Highland Heights Christian Church (C). Display/hide their locations on the map
Size of family households: 449 2-persons, 252 3-persons, 136 4-persons, 41 5-persons, 52 6-persons
Size of nonfamily households: 184 1-person, 52 2-persons
584 married couples with children.
0 single-parent households ().
97.3% of residents of 66542 zip code speak English at home.
0.9% of residents speak Spanish at home (26% very well, 74% not well).
1.7% of residents speak other Indo-European language at home (71% very well, 29% well).
Foreign born population: 8 (0.3%) (0.0% of them are naturalized citizens)
:
0.3%
Whole state:
7.1%
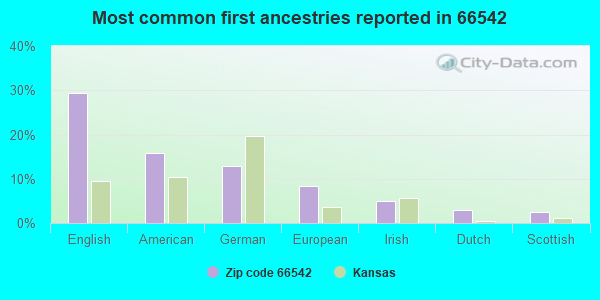
29%English
16%American
13%German
8%European
5%Irish
3%Dutch
3%Scottish
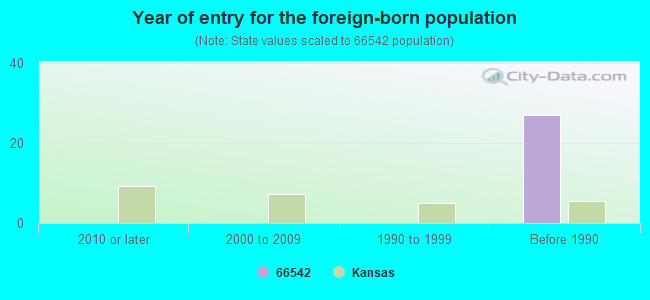
Year of entry for the foreign-born population
02010 or later
02000 to 2009
01990 to 1999
27Before 1990
Public high school in in zip code 66542 not listed on the city page:
TECUMSEH NORTH ELEM(Students: 393, Location: 314 SE STANTON ROAD, Grades: PK-6)
Facilities with environmental interests located in this zip code:
UCB FILMS INCORPORATED (6000 S.E. 2ND ST. in TECUMSEH, KS)
AIR MAJOR (AIRS/AFS) ENFORCEMENT/COMPLIANCE ACTIVITY (Integrated Compliance Information System) - ICIS-07-1996-0233, FORMAL ENFORCEMENT ACTION, ICIS-07-1998-0296, ICIS-07-1998-0368, ICIS-07-1999-0293, ICIS-07-1997-0391, ICIS-07-2004-0055, (Integrated Compliance Information System) - ICIS-07-1996-0233, FORMAL ENFORCEMENT ACTION, ICIS-07-1998-0296, ICIS-07-1998-0368, ICIS-07-1999-0293, ICIS-07-1997-0391, ICIS-07-2004-0055, STATE MASTER (Kansas Facility Profiler) - SOLWASTE-65, REFUSE DISPOSAL, TANKS-25730, UNDERGROUND STORAGE TANK PROGRAM, WWT-I-KS72-PO09, WASTEWATER FACILITY, ISL-C408900414, STATE CLEANUP SITE, ISTEPS-17700035, AIR MAJOR, RTK-SN00028, EPCRA CRITERIA AND HAZARDOUS AIR POLLUTANT INVENTORY (Inventory of air pollution sources) National Pollutant Discharge Elimination System MAJOR (Tracking pollutant discharge elimination systems) - permit HAZARDOUS WASTE BIENNIAL REPORTER (Resource Conservation and Recovery Act (tracking hazardous waste)) Large Quantity Generators, more that 1000 kg of hazardous waste/month (Resource Conservation and Recovery Act (tracking hazardous waste)) - notification TSD (Resource Conservation and Recovery Act (tracking hazardous waste)) TRI REPORTER (Tracking of toxic chemicals releasing facilities) Business SIC classification: PACKAGING PAPER AND PLASTICS FILM, COATED AND LAMINATED; COATED AND LAMINATED PAPER; PLASTICS, FOIL, AND COATED PAPER BAGS; UNSUPPORTED PLASTICS FILM AND SHEET; PLASTICS PRODUCTS Business NAICS classification: CELLULOSIC ORGANIC FIBER MANUFACTURING. Organizations: INNOVIA FILMS INC, FLEXEL, INC. (CONTACT/OPERATOR)
, SURFACE SPECIALTIES INC (CONTACT/OPERATOR)
, INNOVIA FILMS INC (CONTACT/OPERATOR)
, SURFACE SPECIALTIES INC (CONTACT/OWNER)
, INNOVIA FILMS INC (CONTACT/OWNER)
, INNOVIA FILMS, INC. (CONTACT/OWNER)
, SURFACE SPECIALTIES INC (CONTACT/OWNER)
, INNOVIA FILMS, INC. (OWNER/OPERATOR)
Alternative names: 4, E.I. DUPONT DENEMOURS & CO., FLEXEL, INCORPORATED, INNOVIA FILMS INC, SURFACE SPECIALTIES INC
CAMP HAMMOND (6320 S.E. STUBBS ROAD in TECUMSEH, KS)
STATE MASTER (Kansas Facility Profiler) - WWT-C-KS98-NO01, WASTEWATER FACILITY National Pollutant Discharge Elimination System NON-MAJOR (Tracking pollutant discharge elimination systems) - permit Business SIC classification: SPORTING AND RECREATIONAL CAMPS Organizations: YMCA OF TOPEKA (CONTACT/OWNER)
Alternative names: CAMP HAMMOND WASTEWATER PLANT, YMCA OF TOPEKA
UNIFIED SCHOOL DISTRICT 450 SHAWNEE HEIGHTS (4401 SOUTHEAST SHAWNEE HEIGHTS ROAD in TECUMSEH, KS)
COMPLIANCE ACTIVITY (Tracking inspections of insecticide, fungicide, and rodenticide, and toxic substances) National Pollutant Discharge Elimination System NON-MAJOR (Tracking pollutant discharge elimination systems) - permit (Resource Conservation and Recovery Act (tracking hazardous waste)) Business SIC classification: ELEMENTARY AND SECONDARY SCHOOLS Organizations: USD 450 SHAWNEE HEIGHTS (CONTACT/OPERATOR)
, USD #450 SHAWNEE HEIGHTS JR-SR (CONTACT/OWNER)
Alternative names: SHAWNEE HEIGHTS JR-SR HGH SCHL, SHAWNEE HEIGHTS USD 450, SHAWNEE HEIGHTSD 450, SHAWNEE HGTS HS USD450, USD 450 SHAWNEE HEIGHTS
IWIG DAIRY (3320 SE TECUMSEH RD in TECUMSEH, KS)
STATE MASTER (Kansas Facility Profiler) - CAFO-09477, LIVE STOCK WASTE CONTROL National Pollutant Discharge Elimination System NON-MAJOR (Tracking pollutant discharge elimination systems) - permit Business SIC classification: DAIRY FARMS
MCPHERSON WRECKING (5341 SOUTHEAST 29TH STREET in TECUMSEH, KS)
(Resource Conservation and Recovery Act (tracking hazardous waste)) Organizations: MARTIN MARIETTA CORP (CONTACT/OWNER)
Alternative names: MARTIN MARIETTA CORP
MARTIN MARIETTA (5341 SOUTHEAST 29TH STREET in TECUMSEH, KS)
AIR SYNTHETIC MINOR (AIRS/AFS) Business SIC classification: CRUSHED AND BROKEN LIMESTONE
Housing units lacking complete kitchen facilities: 0.6%
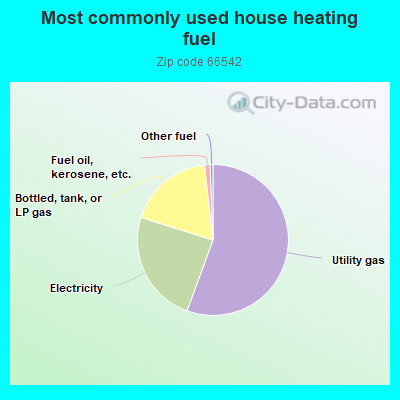
55.7%Utility gas
24.3%Electricity
18.4%Bottled, tank, or LP gas
1.2%Fuel oil, kerosene, etc.
0.6%Other fuel
Population in 1990: 1,059. Population change in the 1990s: +1,854 (+175.1%).
Place of birth for U.S.-born residents:
This state: 2,318
Northeast: 63
Midwest: 337
South: 113
West: 107
68% of the 66542 zip code residents lived in the same house 5 years ago. Out of people who lived in different houses, 71% lived in this county. Out of people who lived in different counties, 50% lived in Kansas.
92% of the 66542 zip code residents lived in the same house 1 year ago. Out of people who lived in different houses, 86% moved from this county. Out of people who lived in different houses, 14% moved from different county within same state.
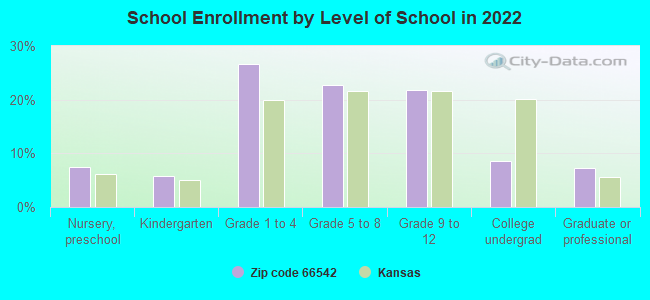
Private vs. public school enrollment:
Students in private schools in grades 1 to 8 (elementary and middle school): 72
Here:
19.8%
Kansas:
14.1%
Students in private schools in grades 9 to 12 (high school):
Here:
0.0%
Kansas:
10.8%
Students in private undergraduate colleges: 18
Here:
29.9%
Kansas:
15.4%
Occupation by median earnings in the past 12 months ($)
246,810Installation, maintenance, and repair occupations
122,268Health diagnosing and treating practitioners and other technical occupations
87,425Computer and mathematical occupations
56,121Business and financial operations occupations
53,440Education, training, and library occupations
53,347Production occupations
Top industries in this zip code by the number of employees in 2005:
Utilities: Electric Power Distribution (50-99 employees: 1 establishment)
Accommodation and Food Services: Limited-Service Restaurants (20-49: 2)
Health Care and Social Assistance: Child Day Care Services (20-49: 1)
Accommodation and Food Services: Full-Service Restaurants (20-49: 1)
Construction: Commercial and Institutional Building Construction (10-19: 1, 1-4: 2)
Construction: Plumbing, Heating, and Air-Conditioning Contractors (10-19: 1, 1-4: 1)
Other Services (except Public Administration): Religious Organizations (5-9: 2, 1-4: 1)
Fatal accident statistics in 2014:
Fatal accident count: 1
Vehicles involved in fatal accidents: 1
Fatal accidents caused by drunken drivers: 1
Fatalities: 1
Persons involved in fatal accidents: 1
Pedestrians involved in fatal accidents: 0
Fatal accident statistics in 2013:
Fatal accident count: 1
Vehicles involved in fatal accidents: 1
Fatal accidents caused by drunken drivers: 0
Fatalities: 1
Persons involved in fatal accidents: 2
Pedestrians involved in fatal accidents: 0
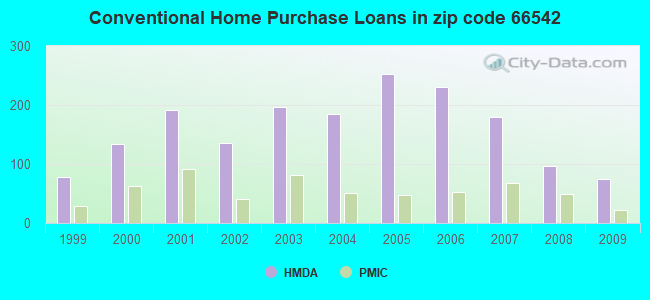
Home Mortgage Disclosure Act Aggregated Statistics For Year 2009 (Based on 2 partial tracts)
A) FHA, FSA/RHS & VA Home Purchase Loans
B) Conventional Home Purchase Loans
C) Refinancings
D) Home Improvement Loans
F) Non-occupant Loans on < 5 Family Dwellings (A B C & D)
G) Loans On Manufactured Home Dwelling (A B C & D)
Number
Average Value
Number
Average Value
Number
Average Value
Number
Average Value
Number
Average Value
Number
Average Value
LOANS ORIGINATED
66
$144,990
75
$125,715
363
$135,075
25
$37,748
20
$138,988
7
$35,950
APPLICATIONS APPROVED, NOT ACCEPTED
2
$162,250
5
$114,898
46
$133,888
3
$9,933
0
$0
0
$0
APPLICATIONS DENIED
3
$181,563
12
$142,519
84
$137,927
10
$32,946
0
$0
3
$119,757
APPLICATIONS WITHDRAWN
12
$153,281
8
$129,136
63
$136,364
7
$100,281
5
$78,806
0
$0
FILES CLOSED FOR INCOMPLETENESS
0
$0
0
$0
13
$147,858
2
$830
2
$46,355
2
$830
Aggregated Statistics For Year 2008 (Based on 2 partial tracts)
A) FHA, FSA/RHS & VA Home Purchase Loans
B) Conventional Home Purchase Loans
C) Refinancings
D) Home Improvement Loans
F) Non-occupant Loans on < 5 Family Dwellings (A B C & D)
G) Loans On Manufactured Home Dwelling (A B C & D)
Number
Average Value
Number
Average Value
Number
Average Value
Number
Average Value
Number
Average Value
Number
Average Value
LOANS ORIGINATED
38
$141,989
96
$138,415
167
$128,909
31
$37,919
12
$161,007
2
$88,575
APPLICATIONS APPROVED, NOT ACCEPTED
2
$145,695
8
$123,135
31
$128,549
10
$16,225
2
$42,220
2
$42,220
APPLICATIONS DENIED
3
$149,557
13
$102,520
81
$141,462
26
$57,500
3
$126,930
3
$20,970
APPLICATIONS WITHDRAWN
0
$0
10
$113,574
33
$129,839
2
$8,280
3
$110,373
0
$0
FILES CLOSED FOR INCOMPLETENESS
0
$0
2
$115,065
5
$150,328
0
$0
0
$0
0
$0
Aggregated Statistics For Year 2007 (Based on 2 partial tracts)
A) FHA, FSA/RHS & VA Home Purchase Loans
B) Conventional Home Purchase Loans
C) Refinancings
D) Home Improvement Loans
F) Non-occupant Loans on < 5 Family Dwellings (A B C & D)
G) Loans On Manufactured Home Dwelling (A B C & D)
Number
Average Value
Number
Average Value
Number
Average Value
Number
Average Value
Number
Average Value
Number
Average Value
LOANS ORIGINATED
25
$134,368
180
$127,702
187
$119,708
43
$41,005
17
$97,388
2
$101,820
APPLICATIONS APPROVED, NOT ACCEPTED
0
$0
15
$116,665
33
$139,522
7
$11,353
0
$0
0
$0
APPLICATIONS DENIED
2
$93,540
22
$132,222
111
$119,397
23
$58,666
5
$121,190
0
$0
APPLICATIONS WITHDRAWN
3
$88,850
17
$91,058
70
$122,964
2
$169,700
8
$77,399
0
$0
FILES CLOSED FOR INCOMPLETENESS
0
$0
3
$135,760
22
$118,902
2
$33,110
3
$114,237
0
$0
Aggregated Statistics For Year 2006 (Based on 2 partial tracts)
A) FHA, FSA/RHS & VA Home Purchase Loans
B) Conventional Home Purchase Loans
C) Refinancings
D) Home Improvement Loans
F) Non-occupant Loans on < 5 Family Dwellings (A B C & D)
G) Loans On Manufactured Home Dwelling (A B C & D)
Number
Average Value
Number
Average Value
Number
Average Value
Number
Average Value
Number
Average Value
Number
Average Value
LOANS ORIGINATED
22
$133,351
230
$113,358
190
$102,926
56
$38,522
23
$159,370
2
$91,060
APPLICATIONS APPROVED, NOT ACCEPTED
2
$122,515
41
$107,372
10
$108,442
5
$23,178
3
$59,600
0
$0
APPLICATIONS DENIED
0
$0
17
$91,740
124
$110,111
15
$57,505
3
$98,233
7
$35,004
APPLICATIONS WITHDRAWN
5
$137,746
10
$105,462
73
$119,271
3
$137,967
0
$0
0
$0
FILES CLOSED FOR INCOMPLETENESS
0
$0
0
$0
20
$131,040
3
$38,630
0
$0
0
$0
Aggregated Statistics For Year 2005 (Based on 2 partial tracts)
A) FHA, FSA/RHS & VA Home Purchase Loans
B) Conventional Home Purchase Loans
C) Refinancings
D) Home Improvement Loans
F) Non-occupant Loans on < 5 Family Dwellings (A B C & D)
G) Loans On Manufactured Home Dwelling (A B C & D)
Number
Average Value
Number
Average Value
Number
Average Value
Number
Average Value
Number
Average Value
Number
Average Value
LOANS ORIGINATED
20
$121,024
252
$107,469
253
$107,228
46
$46,969
26
$108,378
3
$77,260
APPLICATIONS APPROVED, NOT ACCEPTED
0
$0
18
$104,395
35
$92,855
7
$17,029
0
$0
0
$0
APPLICATIONS DENIED
0
$0
25
$117,812
144
$117,053
25
$59,999
3
$99,337
3
$76,157
APPLICATIONS WITHDRAWN
0
$0
17
$119,398
108
$125,090
7
$52,506
5
$169,202
3
$143,487
FILES CLOSED FOR INCOMPLETENESS
0
$0
7
$119,913
26
$128,946
3
$55,740
0
$0
0
$0
Aggregated Statistics For Year 2004 (Based on 2 partial tracts)
A) FHA, FSA/RHS & VA Home Purchase Loans
B) Conventional Home Purchase Loans
C) Refinancings
D) Home Improvement Loans
F) Non-occupant Loans on < 5 Family Dwellings (A B C & D)
G) Loans On Manufactured Home Dwelling (A B C & D)
Number
Average Value
Number
Average Value
Number
Average Value
Number
Average Value
Number
Average Value
Number
Average Value
LOANS ORIGINATED
20
$118,872
185
$116,447
286
$104,610
51
$35,774
7
$75,684
2
$94,370
APPLICATIONS APPROVED, NOT ACCEPTED
0
$0
12
$116,582
36
$119,387
3
$30,353
0
$0
0
$0
APPLICATIONS DENIED
3
$136,310
20
$101,488
118
$118,095
18
$59,050
2
$52,980
3
$28,697
APPLICATIONS WITHDRAWN
5
$166,884
17
$124,657
96
$114,150
17
$66,614
3
$84,987
0
$0
FILES CLOSED FOR INCOMPLETENESS
2
$127,480
3
$144,590
66
$123,016
3
$21,523
0
$0
0
$0
Aggregated Statistics For Year 2003 (Based on 2 partial tracts)
A) FHA, FSA/RHS & VA Home Purchase Loans
B) Conventional Home Purchase Loans
C) Refinancings
D) Home Improvement Loans
F) Non-occupant Loans on < 5 Family Dwellings (A B C & D)
Number
Average Value
Number
Average Value
Number
Average Value
Number
Average Value
Number
Average Value
LOANS ORIGINATED
43
$126,942
197
$114,152
742
$98,484
40
$17,756
18
$98,876
APPLICATIONS APPROVED, NOT ACCEPTED
2
$96,025
8
$155,212
65
$99,540
0
$0
2
$126,655
APPLICATIONS DENIED
2
$87,745
12
$62,085
156
$113,377
8
$39,528
2
$52,980
APPLICATIONS WITHDRAWN
2
$92,715
18
$123,158
121
$118,328
5
$52,980
2
$16,555
FILES CLOSED FOR INCOMPLETENESS
0
$0
3
$125,273
20
$119,700
0
$0
0
$0
Aggregated Statistics For Year 2002 (Based on 2 partial tracts)
A) FHA, FSA/RHS & VA Home Purchase Loans
B) Conventional Home Purchase Loans
C) Refinancings
D) Home Improvement Loans
E) Loans on Dwellings For 5+ Families
F) Non-occupant Loans on < 5 Family Dwellings (A B C & D)
Number
Average Value
Number
Average Value
Number
Average Value
Number
Average Value
Number
Average Value
Number
Average Value
LOANS ORIGINATED
23
$108,478
136
$102,148
493
$93,567
18
$40,102
2
$38,905
10
$83,608
APPLICATIONS APPROVED, NOT ACCEPTED
0
$0
8
$113,201
50
$105,495
12
$24,696
0
$0
0
$0
APPLICATIONS DENIED
2
$105,130
20
$100,164
121
$97,721
7
$17,029
0
$0
3
$110,373
APPLICATIONS WITHDRAWN
0
$0
22
$104,077
94
$95,039
15
$41,942
0
$0
0
$0
FILES CLOSED FOR INCOMPLETENESS
0
$0
3
$108,717
46
$110,025
0
$0
0
$0
2
$28,975
Aggregated Statistics For Year 2001 (Based on 2 partial tracts)
A) FHA, FSA/RHS & VA Home Purchase Loans
B) Conventional Home Purchase Loans
C) Refinancings
D) Home Improvement Loans
F) Non-occupant Loans on < 5 Family Dwellings (A B C & D)
Number
Average Value
Number
Average Value
Number
Average Value
Number
Average Value
Number
Average Value
LOANS ORIGINATED
35
$110,027
192
$103,673
320
$97,127
63
$24,466
7
$69,536
APPLICATIONS APPROVED, NOT ACCEPTED
0
$0
17
$79,371
40
$92,093
2
$15,730
5
$104,634
APPLICATIONS DENIED
2
$81,950
12
$100,716
81
$96,577
15
$11,699
8
$118,375
APPLICATIONS WITHDRAWN
2
$78,640
12
$82,642
70
$103,499
5
$14,900
7
$58,183
FILES CLOSED FOR INCOMPLETENESS
0
$0
7
$102,410
22
$94,520
2
$8,280
0
$0
Aggregated Statistics For Year 2000 (Based on 2 partial tracts)
A) FHA, FSA/RHS & VA Home Purchase Loans
B) Conventional Home Purchase Loans
C) Refinancings
D) Home Improvement Loans
E) Loans on Dwellings For 5+ Families
F) Non-occupant Loans on < 5 Family Dwellings (A B C & D)
Number
Average Value
Number
Average Value
Number
Average Value
Number
Average Value
Number
Average Value
Number
Average Value
LOANS ORIGINATED
43
$102,647
134
$90,539
109
$84,998
70
$21,854
2
$161,420
10
$96,025
APPLICATIONS APPROVED, NOT ACCEPTED
3
$126,930
20
$41,307
28
$76,099
12
$18,902
0
$0
2
$18,210
APPLICATIONS DENIED
0
$0
20
$73,922
56
$89,609
18
$34,768
0
$0
0
$0
APPLICATIONS WITHDRAWN
0
$0
18
$100,532
22
$91,510
5
$30,794
0
$0
2
$56,290
FILES CLOSED FOR INCOMPLETENESS
2
$61,255
7
$71,427
17
$92,616
0
$0
0
$0
0
$0
Aggregated Statistics For Year 1999 (Based on 1 partial tract)
A) FHA, FSA/RHS & VA Home Purchase Loans
B) Conventional Home Purchase Loans
C) Refinancings
D) Home Improvement Loans
F) Non-occupant Loans on < 5 Family Dwellings (A B C & D)
Detailed PMIC statistics for the following Tracts:0039.01
2002 - 2018 National Fire Incident Reporting System (NFIRS) incidents
Based on the data from the years 2002 - 2018 the average number of fire incidents per year is 49. The highest number of fires - 108 took place in 2002, and the least - 24 in 2013. The data has a declining trend.
When looking into fire subcategories, the most reports belonged to: Outside Fires (69.8%), and Mobile Property/Vehicle Fires (13.1%).
Fire incident types reported to NFIRS in Zip Code 66542

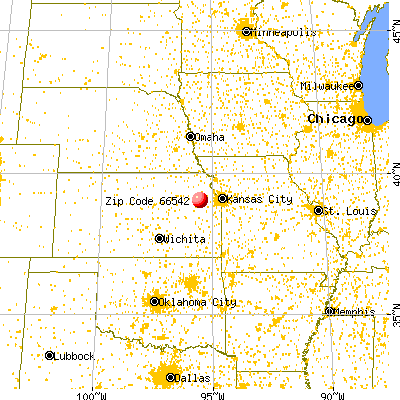


 Nearest zip codes: 66429, 66409, 66605, 66607, 66616, 66050.


 (Students: 1,189, Location: 4201 SE SHAWNEE HEIGHTS RD, Grades: 9-12)


 Based on the data from the years 2002 - 2018 the average number of fire incidents per year is 49. The highest number of fires - 108 took place in 2002, and the least - 24 in 2013. The data has a declining trend.
 When looking into fire subcategories, the most reports belonged to: Outside Fires (69.8%), and Mobile Property/Vehicle Fires (13.1%).