Estimated zip code population in 2022: 40
Zip code population in 2010: 61
Zip code population in 2000: 94
March 2022 cost of living index in zip code 67012: 78.6
(low, U.S. average is 100)
Land area: 9.7
sq. mi.
Water area: 0.0
sq. mi.
| Population density: 4 people per square mile | | (very low). |
![Age and Sex of Residents in zip code 67012]()
- OSM Map
- General Map
- Google Map
- MSN Map
- OSM Map
- General Map
- Google Map
- MSN Map
- OSM Map
- General Map
- Google Map
- MSN Map
- OSM Map
- General Map
- Google Map
- MSN Map
Please wait while loading the map...
Business Search - 14 Million verified businesses
| Males: 23 |  (59.9%) (59.9%) |
| Females: 16 |  (40.1%) (40.1%) |
For population 25 years and over in 67012:
- High school or higher: 98.9%
- Bachelor's degree or higher: 0.0%
- Graduate or professional degree: 0.0%
For population 15 years and over in 67012:
- Never married: 0.0%
- Now married: 60.3%
- Separated: 0.0%
- Widowed: 0.0%
- Divorced: 39.7%
Zip code 67012 compared to state average:
- Median household income significantly below state average.
- Median house value significantly below state average.
- Unemployed percentage significantly above state average.
- Black race population percentage significantly below state average.
- Hispanic race population percentage significantly below state average.
- Median age significantly above state average.
- Foreign-born population percentage significantly below state average.
- Renting percentage significantly below state average.
- Length of stay since moving in below state average.
- Number of rooms per house significantly below state average.
- House age significantly above state average.
- Number of college students significantly below state average.
- Percentage of population with a bachelor's degree or higher significantly below state average.
Data:
100%
rural population.
Median resident age:| This zip code: | 66.6 years |
| Kansas median age: | 37.6 years |
Average household size:| This zip code: | 2.3 people |
| Kansas: | 2.4 people |
Averages for the 2004 tax year for zip code 67012, filed in 2005:
Average Adjusted Gross Income (AGI) in 2004: $30,043 (Individual Income Tax Returns)
| Here: | $30,043 |
| State: | $45,726 |
Salary/wage: $25,389 (reported on 78.3% of returns)
| Here: | $25,389 |
| State: | $40,112 |
Total tax: $1,429 (reported on 60.9% of returns)
Percentage of individuals using paid preparers for their 2004 taxes: 91.3%
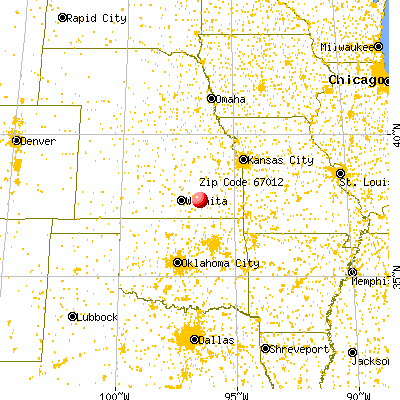
![67012 map]() Nearest zip codes: 67122
Nearest zip codes: 67122,
67072,
67074,
67132,
67045,
67042.
Percentage of family households:| This zip code: | 0.0% |
| Kansas: | 45.7% |
Percentage of households with unmarried partners:| This zip code: | 0.0% |
| Kansas: | 48.9% |
No gay or lesbian households reported
Household received Food Stamps/SNAP in the past 12 months: 0
Household did not receive Food Stamps/SNAP in the past 12 months: 17
Women who did not have a birth in the past 12 months: 7 (6 now married, 0 unmarried)
Residents with income below the poverty level in 2022:
| This zip code: | 22.7% |
| Whole state: | 12.0% |
| This zip code: | 22.7% |
| Whole state: | 6.4% |

- Year house built (houses)
- 02020 or later
- 02010 to 2019
- 02000 to 2009
- 01990 to 1999
- 01980 to 1989
- 01970 to 1979
- 01960 to 1969
- 71950 to 1959
- 01940 to 1949
- 101939 or earlier
![Zip code 67012 satellite photo by USGS]()
- Bedrooms in owner-occupied houses and condos in 67012
- 0no bedroom
- 01 bedroom
- 72 bedrooms
- 103 bedrooms
- 04 bedrooms
- 05+ bedrooms
- Cars and other vehicles available in 67012 in owner-occupied houses/condos
- 0no vehicle
- 01 vehicle
- 102 vehicles
- 73 vehicles
- 04 vehicles
- 05+ vehicles
Zip code 67012 household income distribution in 2022
![Zip code 67012 household income distribution in 2022]()
- 9$35,000 to $39,999
- 7$100,000 to $124,999
Estimated median house (or condo) value in 2022 for:
- White Non-Hispanic householders: $206,600
Housing units in structures:
Household type by relationship:
Households: 40
- Male householders: 17 (0 living alone), Female householders: 0 (0 living alone)
0 spouses (0 opposite-sex spouses), 0 unmarried partners, (0 opposite-sex unmarried partners), 7 children (7 natural, 0 adopted, 0 stepchildren), 0 grandchildren, 0 brothers or sisters, 0 parents, 0 foster children, 6 other relatives, 8 non-relatives
Size of family households: 7 3-persons
Size of nonfamily households: 10 2-persons
102.5% of residents of 67012 zip code speak English at home.
Foreign born population: 0 (0.0%)
![Zip code 67012 topographic map]()
Facilities with environmental interests located in this zip code:
- MCCONNELL (EX) TITAN II -4 (6 MILES W OF BEAUMONT ON HWY 96 in BEAUMONT, KS)

SUPERFUND (Superfund database)

- 60.2%Bottled, tank, or LP gas
- 42.1%Electricity
Population in 1990: 85. Population change in the 1990s: +9 (+10.6%).
Place of birth for U.S.-born residents:
100% of the 67012 zip code residents lived in the same house 5 years ago.
48% of the 67012 zip code residents lived in the same house 1 year ago.
Out of people who lived in different houses, 90% moved from this county.
Top industries in this zip code by the number of employees in 2005:
- Other Services (except Public Administration): Other Grantmaking and Giving Services (1-4 employees: 1 establishment)
Fatal accident statistics in 2013:
- Fatal accident count: 1
- Vehicles involved in fatal accidents: 2
- Fatal accidents caused by drunken drivers: 0
- Fatalities: 1
- Persons involved in fatal accidents: 2
- Pedestrians involved in fatal accidents: 0
Home Mortgage Disclosure Act Aggregated Statistics For Year 2009
(Based on 2 partial tracts)
|
| C) Refinancings
|
|---|
| Number | Average Value |
|---|
| LOANS ORIGINATED | 1 | $148,560 |
| APPLICATIONS APPROVED, NOT ACCEPTED | 0 | $0 |
| APPLICATIONS DENIED | 1 | $95,130 |
| APPLICATIONS WITHDRAWN | 0 | $0 |
| FILES CLOSED FOR INCOMPLETENESS | 0 | $0 |
Aggregated Statistics For Year 2008
(Based on 2 partial tracts)
|
| A) FHA, FSA/RHS & VA
Home Purchase Loans | B) Conventional
Home Purchase Loans | C) Refinancings
| D) Home Improvement Loans
| G) Loans On Manufactured
Home Dwelling (A B C & D) |
|---|
| Number | Average Value | Number | Average Value | Number | Average Value | Number | Average Value | Number | Average Value |
|---|
| LOANS ORIGINATED | 1 | $57,830 | 1 | $85,490 | 2 | $247,130 | 1 | $18,830 | 1 | $53,950 |
| APPLICATIONS APPROVED, NOT ACCEPTED | 0 | $0 | 0 | $0 | 0 | $0 | 0 | $0 | 0 | $0 |
| APPLICATIONS DENIED | 0 | $0 | 0 | $0 | 1 | $78,140 | 0 | $0 | 0 | $0 |
| APPLICATIONS WITHDRAWN | 0 | $0 | 0 | $0 | 0 | $0 | 0 | $0 | 0 | $0 |
| FILES CLOSED FOR INCOMPLETENESS | 0 | $0 | 0 | $0 | 0 | $0 | 0 | $0 | 0 | $0 |
Aggregated Statistics For Year 2007
(Based on 2 partial tracts)
|
| B) Conventional
Home Purchase Loans | C) Refinancings
| D) Home Improvement Loans
|
|---|
| Number | Average Value | Number | Average Value | Number | Average Value |
|---|
| LOANS ORIGINATED | 1 | $111,310 | 1 | $77,920 | 1 | $19,540 |
| APPLICATIONS APPROVED, NOT ACCEPTED | 0 | $0 | 0 | $0 | 0 | $0 |
| APPLICATIONS DENIED | 1 | $39,140 | 1 | $105,380 | 0 | $0 |
| APPLICATIONS WITHDRAWN | 0 | $0 | 0 | $0 | 0 | $0 |
| FILES CLOSED FOR INCOMPLETENESS | 0 | $0 | 0 | $0 | 0 | $0 |
Aggregated Statistics For Year 2006
(Based on 2 partial tracts)
|
| B) Conventional
Home Purchase Loans | C) Refinancings
|
|---|
| Number | Average Value | Number | Average Value |
|---|
| LOANS ORIGINATED | 1 | $93,220 | 1 | $97,700 |
| APPLICATIONS APPROVED, NOT ACCEPTED | 0 | $0 | 0 | $0 |
| APPLICATIONS DENIED | 1 | $34,340 | 1 | $116,280 |
| APPLICATIONS WITHDRAWN | 0 | $0 | 1 | $46,150 |
| FILES CLOSED FOR INCOMPLETENESS | 0 | $0 | 0 | $0 |
Aggregated Statistics For Year 2005
(Based on 2 partial tracts)
|
| B) Conventional
Home Purchase Loans | C) Refinancings
| D) Home Improvement Loans
|
|---|
| Number | Average Value | Number | Average Value | Number | Average Value |
|---|
| LOANS ORIGINATED | 1 | $79,410 | 2 | $68,000 | 1 | $17,490 |
| APPLICATIONS APPROVED, NOT ACCEPTED | 0 | $0 | 0 | $0 | 0 | $0 |
| APPLICATIONS DENIED | 1 | $38,830 | 2 | $89,300 | 0 | $0 |
| APPLICATIONS WITHDRAWN | 0 | $0 | 1 | $99,680 | 0 | $0 |
| FILES CLOSED FOR INCOMPLETENESS | 0 | $0 | 0 | $0 | 0 | $0 |
Aggregated Statistics For Year 2004
(Based on 2 partial tracts)
|
| B) Conventional
Home Purchase Loans | C) Refinancings
| D) Home Improvement Loans
| G) Loans On Manufactured
Home Dwelling (A B C & D) |
|---|
| Number | Average Value | Number | Average Value | Number | Average Value | Number | Average Value |
|---|
| LOANS ORIGINATED | 1 | $90,150 | 2 | $98,455 | 1 | $19,560 | 0 | $0 |
| APPLICATIONS APPROVED, NOT ACCEPTED | 0 | $0 | 0 | $0 | 0 | $0 | 0 | $0 |
| APPLICATIONS DENIED | 0 | $0 | 2 | $74,680 | 0 | $0 | 1 | $36,940 |
| APPLICATIONS WITHDRAWN | 0 | $0 | 1 | $63,000 | 0 | $0 | 0 | $0 |
| FILES CLOSED FOR INCOMPLETENESS | 0 | $0 | 0 | $0 | 0 | $0 | 0 | $0 |
Aggregated Statistics For Year 2003
(Based on 2 partial tracts)
|
| B) Conventional
Home Purchase Loans | C) Refinancings
|
|---|
| Number | Average Value | Number | Average Value |
|---|
| LOANS ORIGINATED | 1 | $94,970 | 3 | $92,693 |
| APPLICATIONS APPROVED, NOT ACCEPTED | 0 | $0 | 1 | $53,880 |
| APPLICATIONS DENIED | 1 | $33,590 | 2 | $79,610 |
| APPLICATIONS WITHDRAWN | 0 | $0 | 1 | $68,000 |
| FILES CLOSED FOR INCOMPLETENESS | 0 | $0 | 0 | $0 |
Aggregated Statistics For Year 2002
(Based on 2 partial tracts)
|
| B) Conventional
Home Purchase Loans | C) Refinancings
|
|---|
| Number | Average Value | Number | Average Value |
|---|
| LOANS ORIGINATED | 1 | $83,160 | 3 | $71,737 |
| APPLICATIONS APPROVED, NOT ACCEPTED | 0 | $0 | 1 | $60,070 |
| APPLICATIONS DENIED | 1 | $25,370 | 1 | $101,170 |
| APPLICATIONS WITHDRAWN | 0 | $0 | 1 | $46,600 |
| FILES CLOSED FOR INCOMPLETENESS | 0 | $0 | 0 | $0 |
Aggregated Statistics For Year 2001
(Based on 2 partial tracts)
|
| B) Conventional
Home Purchase Loans | C) Refinancings
| D) Home Improvement Loans
|
|---|
| Number | Average Value | Number | Average Value | Number | Average Value |
|---|
| LOANS ORIGINATED | 1 | $66,930 | 3 | $79,040 | 1 | $10,860 |
| APPLICATIONS APPROVED, NOT ACCEPTED | 0 | $0 | 0 | $0 | 0 | $0 |
| APPLICATIONS DENIED | 1 | $34,280 | 1 | $71,080 | 0 | $0 |
| APPLICATIONS WITHDRAWN | 0 | $0 | 1 | $68,090 | 0 | $0 |
| FILES CLOSED FOR INCOMPLETENESS | 0 | $0 | 0 | $0 | 0 | $0 |
Aggregated Statistics For Year 2000
(Based on 2 partial tracts)
|
| B) Conventional
Home Purchase Loans | C) Refinancings
|
|---|
| Number | Average Value | Number | Average Value |
|---|
| LOANS ORIGINATED | 1 | $62,140 | 1 | $69,710 |
| APPLICATIONS APPROVED, NOT ACCEPTED | 0 | $0 | 0 | $0 |
| APPLICATIONS DENIED | 1 | $40,890 | 1 | $41,050 |
| APPLICATIONS WITHDRAWN | 0 | $0 | 0 | $0 |
| FILES CLOSED FOR INCOMPLETENESS | 0 | $0 | 0 | $0 |
Aggregated Statistics For Year 1999
(Based on 1 partial tract)
|
| B) Conventional
Home Purchase Loans | C) Refinancings
|
|---|
| Number | Average Value | Number | Average Value |
|---|
| LOANS ORIGINATED | 0 | $0 | 1 | $53,040 |
| APPLICATIONS APPROVED, NOT ACCEPTED | 0 | $0 | 0 | $0 |
| APPLICATIONS DENIED | 1 | $38,020 | 1 | $32,800 |
| APPLICATIONS WITHDRAWN | 0 | $0 | 0 | $0 |
| FILES CLOSED FOR INCOMPLETENESS | 0 | $0 | 0 | $0 |
Private Mortgage Insurance Companies Aggregated Statistics For Year 2003
(Based on 2 partial tracts)
|
| B) Refinancings
|
|---|
| Number | Average Value |
|---|
| LOANS ORIGINATED | 1 | $66,690 |
| APPLICATIONS APPROVED, NOT ACCEPTED | 0 | $0 |
| APPLICATIONS DENIED | 0 | $0 |
| APPLICATIONS WITHDRAWN | 0 | $0 |
| FILES CLOSED FOR INCOMPLETENESS | 0 | $0 |
| Most common first names in zip code 67012 among deceased individuals |
| Name | Count | Lived (average) |
|---|
| John | 3 | 74.7 years |
| Alice | 2 | 71.0 years |
| Fred | 2 | 78.0 years |
| Garland | 2 | 81.5 years |
| Chester | 2 | 73.0 years |
| James | 2 | 84.0 years |
| William | 2 | 75.0 years |
| Most common last names in zip code 67012 among deceased individuals |
| Last name | Count | Lived (average) |
|---|
| Eastin | 5 | 76.8 years |
| Franks | 3 | 64.7 years |
| Mailen | 3 | 76.3 years |
| Squier | 3 | 83.3 years |
| Brown | 2 | 73.0 years |
| Davis | 2 | 80.5 years |
| Ferrell | 2 | 81.5 years |
| Hart | 2 | 86.5 years |
| Knox | 2 | 73.5 years |
| Mitchell | 2 | 86.5 years |
 100% rural population.


 Nearest zip codes: 67122, 67072, 67074, 67132, 67045, 67042.


