Estimated median house/condo value in 2022: $167,747
67106:
$167,747
Kansas:
$206,600
Median resident age:
This zip code:
39.2 years
Kansas median age:
37.6 years
Average household size:
This zip code:
2.9 people
Kansas:
2.4 people
Averages for the 2020 tax year for zip code 67106, filed in 2021:
Average Adjusted Gross Income (AGI) in 2020: $70,516 (Individual Income Tax Returns)
Here:
$70,516
State:
$72,721
Salary/wage: $63,588 (reported on 84.2% of returns)
Here:
$63,588
State:
$58,641
(% of AGI for various income ranges: 1147.5% for AGIs below $25k, 4033.3% for AGIs $25k-50k, 4323.3% for AGIs $50k-75k, 27440.0% for AGIs $100k-200k)
Taxable interest for individuals: $450 (reported on 42.1% of returns)
This zip code:
$450
Kansas:
$1,625
(% of AGI for various income ranges: 15.0% for AGIs below $25k, 13.3% for AGIs $50k-75k, 130.0% for AGIs $100k-200k)
Ordinary dividends: $825 (reported on 21.1% of returns)
Here:
$825
State:
$7,290
(% of AGI for various income ranges: 110.0% for AGIs $50k-75k)
Net capital gain/loss in AGI: +$4,975 (reported on 21.1% of returns)
Here:
+$4,975
State:
+$20,511
(% of AGI for various income ranges: )
Earned income credit: $2,600 (reported on 10.5% of returns)
Here:
$2,600
State:
$2,267
(% of AGI for various income ranges: 130.0% for AGIs below $25k)
Percentage of individuals using paid preparers for their 2020 taxes: 100.0%
Here:
100%
State:
95%
(% for various income ranges: 100.0% for AGIs below $25k, 100.0% for AGIs $25k-50k, 100.0% for AGIs $50k-75k, 100.0% for AGIs $75k-100k, 100.0% for AGIs $100k-200k)
Averages for the 2012 tax year for zip code 67106, filed in 2013:
Average Adjusted Gross Income (AGI) in 2012: $60,659 (Individual Income Tax Returns)
Here:
$60,659
State:
$60,095
Salary/wage: $46,820 (reported on 88.2% of returns)
Here:
$46,820
State:
$48,770
(% of AGI for various income ranges: 72.1% for AGIs below $25k, 78.0% for AGIs $25k-50k, 78.5% for AGIs $50k-75k, 82.4% for AGIs $75k-100k, 51.0% for AGIs $100k-200k)
Taxable interest for individuals: $475 (reported on 47.1% of returns)
This zip code:
$475
Kansas:
$1,506
(% of AGI for various income ranges: 1.2% for AGIs below $25k, 0.3% for AGIs $50k-75k, 0.6% for AGIs $100k-200k)
Ordinary dividends: $675 (reported on 23.5% of returns)
Here:
$675
State:
$6,093
Net capital gain/loss in AGI: +$1,533 (reported on 17.6% of returns)
Here:
+$1,533
State:
+$14,598
Total itemized deductions: $20,983 (23% of AGI, reported on 35.3% of returns)
Here:
$20,983
State:
$23,678
Here:
22.8% of AGI
State:
18.9% of AGI
Charity contributions: $3,975 (reported on 23.5% of returns)
Here:
$3,975
State:
$5,321
(% of AGI for various income ranges: 2.0% for AGIs $25k-50k, 5.0% for AGIs $75k-100k)
Taxes paid: $6,833 (reported on 35.3% of returns)
67106:
$6,833
State:
$9,548
Earned income credit: $1,900 (reported on 11.8% of returns)
Here:
$1,900
State:
$2,212
(% of AGI for various income ranges: 6.3% for AGIs below $25k)
Percentage of individuals using paid preparers for their 2012 taxes: 64.7%
Here:
65%
State:
56%
(% for various income ranges: 60.0% for AGIs below $25k, 80.0% for AGIs $25k-50k, 66.7% for AGIs $75k-100k, 100.0% for AGIs $100k-200k)
Averages for the 2004 tax year for zip code 67106, filed in 2005:
Average Adjusted Gross Income (AGI) in 2004: $45,534 (Individual Income Tax Returns)
Here:
$45,534
State:
$45,726
Salary/wage: $42,384 (reported on 84.7% of returns)
Here:
$42,384
State:
$40,112
(% of AGI for various income ranges: 101.7% for AGIs below $10k, 78.7% for AGIs $10k-25k, 81.5% for AGIs $25k-50k, 87.8% for AGIs $50k-75k, 67.6% for AGIs $75k-100k)
Taxable interest for individuals: $484 (reported on 57.1% of returns)
This zip code:
$484
Kansas:
$1,749
(% of AGI for various income ranges: 0.9% for AGIs below $10k, 4.1% for AGIs $10k-25k, 0.5% for AGIs $25k-50k, 0.3% for AGIs $50k-75k, 0.4% for AGIs $75k-100k)
Taxable dividends: $235 (reported on 20.9% of returns)
Here:
$235
State:
$3,066
Net capital gain/loss: +$4,065 (reported on 19.0% of returns)
Here:
+$4,065
State:
+$7,555
Profit/loss from business: +$3,654 (reported on 16.0% of returns)
Here:
+$3,654
State:
+$9,571
Total itemized deductions: $16,517 (23% of AGI, reported on 36.8% of returns)
Here:
$16,517
State:
$18,779
Here:
23.4% of AGI
State:
20.5% of AGI
Charity contributions deductions: $2,273 (4% of AGI, reported on 33.7% of returns)
Here:
$2,273
State:
$3,892
Here:
3.5% of AGI
State:
4.0% of AGI
Total tax: $4,828 (reported on 82.2% of returns)
67106:
$4,828
State:
$7,203
(% of AGI for various income ranges: 1.7% for AGIs below $10k, 4.7% for AGIs $10k-25k, 6.1% for AGIs $25k-50k, 7.6% for AGIs $50k-75k, 12.3% for AGIs $75k-100k)
Earned income credit: $1,545 (reported on 6.7% of returns)
Here:
$1,545
State:
$1,674
Percentage of individuals using paid preparers for their 2004 taxes: 72.4%
Here:
72%
State:
63%
(% for various income ranges: 73.1% for AGIs below $10k, 57.1% for AGIs $10k-25k, 75.0% for AGIs $25k-50k, 69.0% for AGIs $50k-75k, 88.9% for AGIs $75k-100k)
Household received Food Stamps/SNAP in the past 12 months: 0 Household did not receive Food Stamps/SNAP in the past 12 months: 101
Women who did not have a birth in the past 12 months: 81 (46 now married, 34 unmarried)
Housing units in zip code 67106 with a mortgage: 39 Median monthly owner costs for units with a mortgage: $1,675 Median monthly owner costs for units without a mortgage: $647
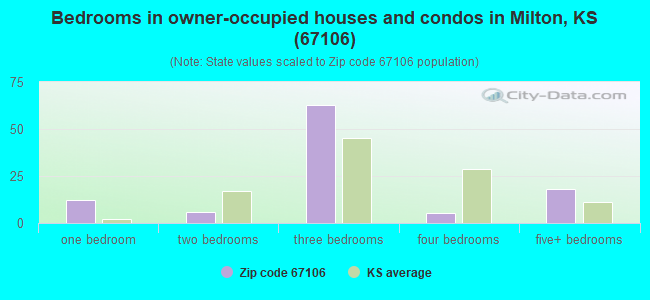
Median number of rooms in houses and condos:
Here:
6.9
State:
6.9
Notable locations in this zip code not listed on our city pages
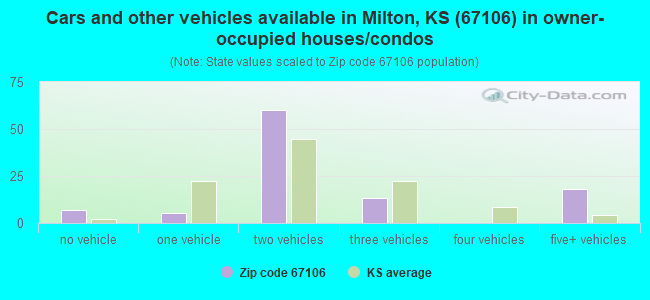
Size of family households: 33 2-persons, 16 4-persons, 15 5-persons
Size of nonfamily households: 33 1-person
85 married couples with children.
0 single-parent households ().
99.7% of residents of 67106 zip code speak English at home.
Foreign born population: 0 (0.0%)
:
0.0%
Whole state:
7.1%
47%European
26%American
9%German
5%Eastern European
2%English
1%Swiss
Year of entry for the foreign-born population
02010 or later
02000 to 2009
01990 to 1999
17Before 1990
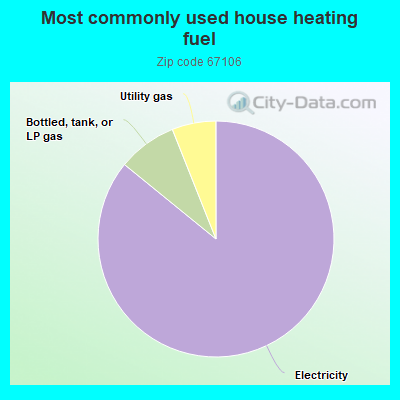
87.0%Electricity
8.2%Bottled, tank, or LP gas
6.1%Utility gas
Population in 1990: 353. Population change in the 1990s: +100 (+28.3%).
Place of birth for U.S.-born residents:
This state: 258
Midwest: 16
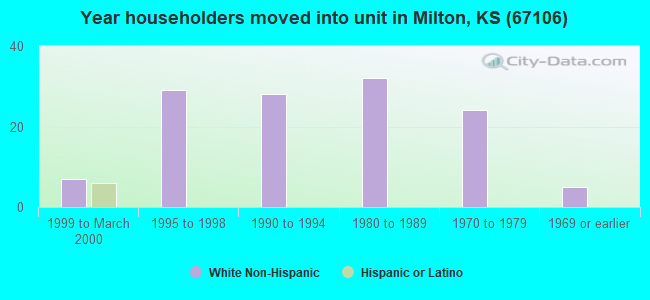
75% of the 67106 zip code residents lived in the same house 5 years ago. Out of people who lived in different houses, 16% lived in this county. Out of people who lived in different counties, 50% lived in Kansas.
101% of the 67106 zip code residents lived in the same house 1 year ago.
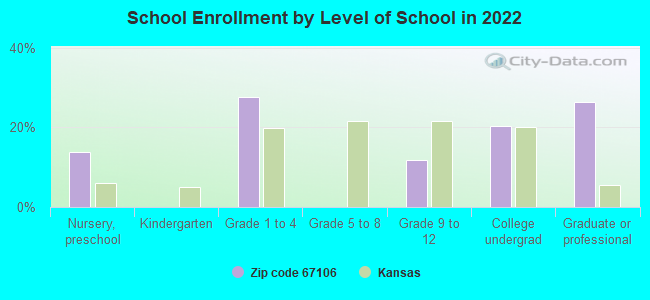
Private vs. public school enrollment:
Students in private schools in grades 1 to 8 (elementary and middle school):
Here:
0.0%
Kansas:
14.1%
Students in private schools in grades 9 to 12 (high school):
Here:
0.0%
Kansas:
10.8%
Students in private undergraduate colleges:
Here:
0.0%
Kansas:
15.4%
Companies with federal contracts located in this zip code:
WILLIAM F RUCKLE (9150 S 375TH ST W in MILTON, KS; small business) : $79,511 in 7 contractsfrom 2000 to 2006
Contracts for Aircraft Ground Servicing Equipment, Engine Electrical System Components, Aircraft Prime Moving, Airfield Specialized Trucks and Trailers, Vehicular Brake, Steering, Axle, Wheel, and Track Components by Defense Logistics Agency Signed by year:2000: $28,424; 2001: $0; 2002: $0; 2003: $28,490; 2004: $0; 2005: $19,849; 2006: $2,748.
Biggest contracts:
$28,490 with Defense Logistics Agency for Aircraft Ground Servicing Equipment. Signed on 2003-10-14. Completion date: 2004-03-12.
$28,424, same as above.Signed on 2000-08-11. Completion date: 2001-02-07.
$7,224, same as above.Signed on 2005-07-22. Completion date: 2005-11-23.
$4,921 with Defense Logistics Agency for Engine Electrical System Components, Aircraft Prime Moving. Signed on 2005-10-27. Completion date: 2006-01-12.
Top industries in this zip code by the number of employees in 2005:
Wholesale Trade: Grain and Field Bean Merchant Wholesalers (10-19 employees: 1 establishment)
Construction: Site Preparation Contractors (5-9: 1)
Wholesale Trade: Farm and Garden Machinery and Equipment Merchant Wholesalers (1-4: 1)
Health Care and Social Assistance: Offices of Chiropractors (1-4: 1)
Real Estate and Rental and Leasing: Other Activities Related to Real Estate (1-4: 1)
Arts, Entertainment, and Recreation: Fitness and Recreational Sports Centers (1-4: 1)
People in group quarters in 2000:
4 people in nursing homes
Fatal accident statistics in 2014:
Fatal accident count: 1
Vehicles involved in fatal accidents: 1
Fatal accidents caused by drunken drivers: 0
Fatalities: 1
Persons involved in fatal accidents: 1
Pedestrians involved in fatal accidents: 0
Fatal accident statistics in 2010:
Fatal accident count: 1
Vehicles involved in fatal accidents: 2
Fatal accidents caused by drunken drivers: 0
Fatalities: 1
Persons involved in fatal accidents: 2
Pedestrians involved in fatal accidents: 0
Home Mortgage Disclosure Act Aggregated Statistics For Year 2009 (Based on 2 partial tracts)
A) FHA, FSA/RHS & VA Home Purchase Loans
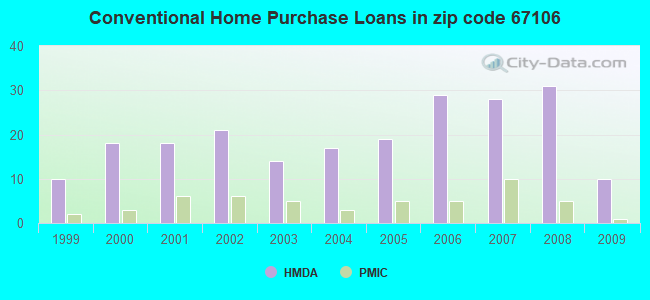
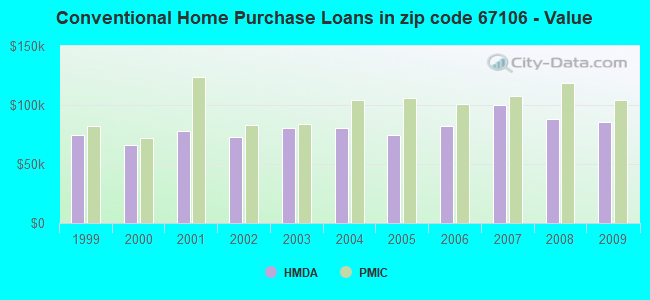
B) Conventional Home Purchase Loans
C) Refinancings
D) Home Improvement Loans
F) Non-occupant Loans on < 5 Family Dwellings (A B C & D)
G) Loans On Manufactured Home Dwelling (A B C & D)
Number
Average Value
Number
Average Value
Number
Average Value
Number
Average Value
Number
Average Value
Number
Average Value
LOANS ORIGINATED
12
$108,360
10
$85,406
48
$106,758
6
$21,312
9
$42,528
7
$32,647
APPLICATIONS APPROVED, NOT ACCEPTED
0
$0
1
$107,570
1
$225,500
0
$0
0
$0
0
$0
APPLICATIONS DENIED
2
$112,970
1
$75,600
13
$140,002
1
$24,620
0
$0
2
$88,560
APPLICATIONS WITHDRAWN
1
$161,140
1
$132,620
6
$149,183
0
$0
0
$0
0
$0
FILES CLOSED FOR INCOMPLETENESS
0
$0
0
$0
2
$84,025
0
$0
0
$0
0
$0
Aggregated Statistics For Year 2008 (Based on 2 partial tracts)
A) FHA, FSA/RHS & VA Home Purchase Loans
B) Conventional Home Purchase Loans
C) Refinancings
D) Home Improvement Loans
F) Non-occupant Loans on < 5 Family Dwellings (A B C & D)
G) Loans On Manufactured Home Dwelling (A B C & D)
Number
Average Value
Number
Average Value
Number
Average Value
Number
Average Value
Number
Average Value
Number
Average Value
LOANS ORIGINATED
10
$85,925
31
$87,807
19
$108,455
7
$21,353
7
$56,469
7
$62,209
APPLICATIONS APPROVED, NOT ACCEPTED
0
$0
1
$60,050
2
$106,055
0
$0
0
$0
1
$73,010
APPLICATIONS DENIED
4
$122,148
4
$65,772
7
$112,259
2
$66,530
0
$0
1
$115,340
APPLICATIONS WITHDRAWN
0
$0
2
$90,070
5
$135,302
0
$0
0
$0
0
$0
FILES CLOSED FOR INCOMPLETENESS
1
$136,940
0
$0
0
$0
0
$0
0
$0
0
$0
Aggregated Statistics For Year 2007 (Based on 2 partial tracts)
A) FHA, FSA/RHS & VA Home Purchase Loans
B) Conventional Home Purchase Loans
C) Refinancings
D) Home Improvement Loans
E) Loans on Dwellings For 5+ Families
F) Non-occupant Loans on < 5 Family Dwellings (A B C & D)
G) Loans On Manufactured Home Dwelling (A B C & D)
Number
Average Value
Number
Average Value
Number
Average Value
Number
Average Value
Number
Average Value
Number
Average Value
Number
Average Value
LOANS ORIGINATED
6
$99,288
28
$99,854
15
$101,175
5
$35,338
1
$59,620
4
$50,868
7
$54,803
APPLICATIONS APPROVED, NOT ACCEPTED
0
$0
2
$77,110
3
$204,913
1
$11,230
0
$0
0
$0
0
$0
APPLICATIONS DENIED
1
$100,660
2
$89,425
13
$76,995
3
$77,903
0
$0
0
$0
2
$70,200
APPLICATIONS WITHDRAWN
0
$0
2
$111,670
2
$141,910
0
$0
0
$0
0
$0
0
$0
FILES CLOSED FOR INCOMPLETENESS
0
$0
0
$0
0
$0
0
$0
0
$0
0
$0
0
$0
Aggregated Statistics For Year 2006 (Based on 2 partial tracts)
A) FHA, FSA/RHS & VA Home Purchase Loans
B) Conventional Home Purchase Loans
C) Refinancings
D) Home Improvement Loans
F) Non-occupant Loans on < 5 Family Dwellings (A B C & D)
G) Loans On Manufactured Home Dwelling (A B C & D)
Number
Average Value
Number
Average Value
Number
Average Value
Number
Average Value
Number
Average Value
Number
Average Value
LOANS ORIGINATED
3
$72,000
29
$81,812
26
$77,876
8
$33,966
7
$44,249
5
$43,718
APPLICATIONS APPROVED, NOT ACCEPTED
0
$0
1
$70,850
3
$113,473
0
$0
0
$0
1
$66,530
APPLICATIONS DENIED
0
$0
5
$93,572
12
$105,192
5
$49,334
0
$0
1
$61,780
APPLICATIONS WITHDRAWN
0
$0
1
$47,520
4
$91,475
2
$46,440
0
$0
0
$0
FILES CLOSED FOR INCOMPLETENESS
0
$0
0
$0
2
$59,400
0
$0
0
$0
0
$0
Aggregated Statistics For Year 2005 (Based on 2 partial tracts)
A) FHA, FSA/RHS & VA Home Purchase Loans
B) Conventional Home Purchase Loans
C) Refinancings
D) Home Improvement Loans
F) Non-occupant Loans on < 5 Family Dwellings (A B C & D)
G) Loans On Manufactured Home Dwelling (A B C & D)
Number
Average Value
Number
Average Value
Number
Average Value
Number
Average Value
Number
Average Value
Number
Average Value
LOANS ORIGINATED
3
$101,087
19
$74,782
27
$91,472
7
$45,854
4
$37,475
3
$74,880
APPLICATIONS APPROVED, NOT ACCEPTED
0
$0
5
$74,650
4
$104,112
0
$0
0
$0
0
$0
APPLICATIONS DENIED
0
$0
6
$43,992
22
$106,881
3
$48,673
0
$0
5
$59,876
APPLICATIONS WITHDRAWN
0
$0
2
$38,880
7
$142,621
2
$63,505
0
$0
1
$57,890
FILES CLOSED FOR INCOMPLETENESS
0
$0
1
$78,190
1
$107,570
0
$0
0
$0
0
$0
Aggregated Statistics For Year 2004 (Based on 2 partial tracts)
A) FHA, FSA/RHS & VA Home Purchase Loans
B) Conventional Home Purchase Loans
C) Refinancings
D) Home Improvement Loans
F) Non-occupant Loans on < 5 Family Dwellings (A B C & D)
G) Loans On Manufactured Home Dwelling (A B C & D)
Number
Average Value
Number
Average Value
Number
Average Value
Number
Average Value
Number
Average Value
Number
Average Value
LOANS ORIGINATED
5
$105,580
17
$80,199
34
$99,068
6
$36,577
5
$55,988
3
$63,647
APPLICATIONS APPROVED, NOT ACCEPTED
0
$0
2
$115,345
6
$87,840
0
$0
0
$0
2
$76,680
APPLICATIONS DENIED
0
$0
6
$59,112
21
$83,150
3
$59,040
1
$22,460
6
$44,783
APPLICATIONS WITHDRAWN
1
$86,400
1
$76,900
9
$103,728
1
$106,270
0
$0
1
$89,860
FILES CLOSED FOR INCOMPLETENESS
0
$0
0
$0
3
$99,793
0
$0
0
$0
0
$0
Aggregated Statistics For Year 2003 (Based on 2 partial tracts)
A) FHA, FSA/RHS & VA Home Purchase Loans
B) Conventional Home Purchase Loans
C) Refinancings
D) Home Improvement Loans
F) Non-occupant Loans on < 5 Family Dwellings (A B C & D)
Number
Average Value
Number
Average Value
Number
Average Value
Number
Average Value
Number
Average Value
LOANS ORIGINATED
4
$75,275
14
$80,136
65
$95,711
8
$19,386
7
$49,989
APPLICATIONS APPROVED, NOT ACCEPTED
0
$0
0
$0
7
$106,827
0
$0
0
$0
APPLICATIONS DENIED
0
$0
3
$91,153
23
$87,884
3
$17,280
0
$0
APPLICATIONS WITHDRAWN
0
$0
3
$106,127
13
$98,164
0
$0
0
$0
FILES CLOSED FOR INCOMPLETENESS
0
$0
0
$0
4
$89,100
0
$0
0
$0
Aggregated Statistics For Year 2002 (Based on 2 partial tracts)
A) FHA, FSA/RHS & VA Home Purchase Loans
B) Conventional Home Purchase Loans
C) Refinancings
D) Home Improvement Loans
F) Non-occupant Loans on < 5 Family Dwellings (A B C & D)
Number
Average Value
Number
Average Value
Number
Average Value
Number
Average Value
Number
Average Value
LOANS ORIGINATED
5
$88,474
21
$72,473
40
$95,720
4
$24,300
5
$37,498
APPLICATIONS APPROVED, NOT ACCEPTED
0
$0
5
$56,074
5
$81,476
1
$44,500
0
$0
APPLICATIONS DENIED
0
$0
3
$68,977
10
$70,200
2
$28,730
0
$0
APPLICATIONS WITHDRAWN
0
$0
1
$55,730
3
$90,863
1
$11,660
0
$0
FILES CLOSED FOR INCOMPLETENESS
0
$0
0
$0
2
$102,600
0
$0
0
$0
Aggregated Statistics For Year 2001 (Based on 2 partial tracts)
A) FHA, FSA/RHS & VA Home Purchase Loans
B) Conventional Home Purchase Loans
C) Refinancings
D) Home Improvement Loans
F) Non-occupant Loans on < 5 Family Dwellings (A B C & D)
Number
Average Value
Number
Average Value
Number
Average Value
Number
Average Value
Number
Average Value
LOANS ORIGINATED
6
$79,128
18
$77,880
42
$89,177
12
$20,052
3
$38,017
APPLICATIONS APPROVED, NOT ACCEPTED
0
$0
2
$44,280
3
$51,983
2
$17,280
0
$0
APPLICATIONS DENIED
0
$0
3
$59,183
17
$62,259
2
$9,290
0
$0
APPLICATIONS WITHDRAWN
1
$63,070
1
$104,980
9
$97,200
1
$34,130
0
$0
FILES CLOSED FOR INCOMPLETENESS
0
$0
0
$0
2
$135,000
0
$0
0
$0
Aggregated Statistics For Year 2000 (Based on 2 partial tracts)
A) FHA, FSA/RHS & VA Home Purchase Loans
B) Conventional Home Purchase Loans
C) Refinancings
D) Home Improvement Loans
F) Non-occupant Loans on < 5 Family Dwellings (A B C & D)
Number
Average Value
Number
Average Value
Number
Average Value
Number
Average Value
Number
Average Value
LOANS ORIGINATED
4
$65,988
18
$66,120
19
$70,416
10
$15,120
8
$34,290
APPLICATIONS APPROVED, NOT ACCEPTED
0
$0
2
$69,770
2
$100,010
0
$0
0
$0
APPLICATIONS DENIED
0
$0
9
$55,680
10
$64,973
5
$11,146
0
$0
APPLICATIONS WITHDRAWN
0
$0
2
$47,520
6
$81,863
1
$19,010
0
$0
FILES CLOSED FOR INCOMPLETENESS
0
$0
0
$0
1
$25,920
0
$0
0
$0
Aggregated Statistics For Year 1999 (Based on 1 partial tract)
A) FHA, FSA/RHS & VA Home Purchase Loans
B) Conventional Home Purchase Loans
C) Refinancings
D) Home Improvement Loans
F) Non-occupant Loans on < 5 Family Dwellings (A B C & D)

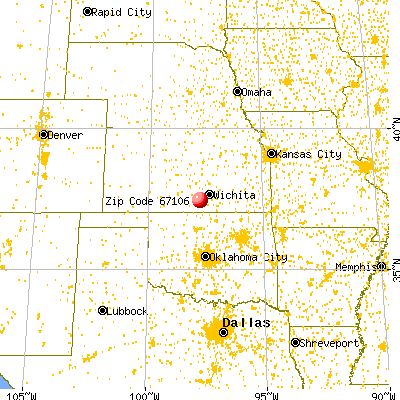


 Nearest zip codes: 67118, 67031, 67149, 67025, 67004, 67036.


 : $79,511 in 7 contracts from 2000 to 2006