Estimated zip code population in 2022: 857 Zip code population in 2010: 1,358 Zip code population in 2000: 1,340
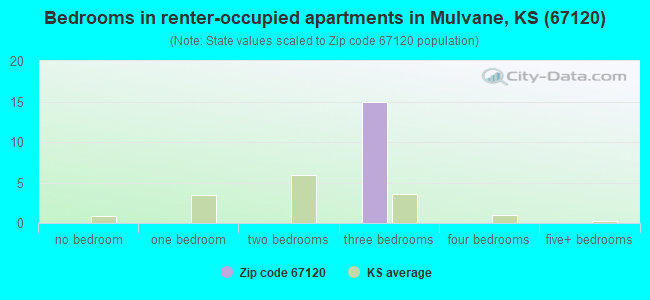
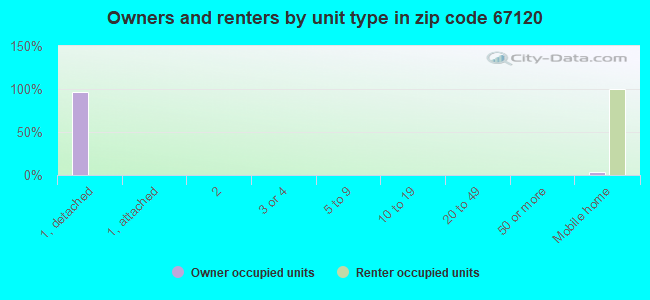
Houses and condos: 555 Renter-occupied apartments: 14
% of renters here:
4%
State:
32%
March 2022 cost of living index in zip code 67120: 76.8 (low, U.S. average is 100)
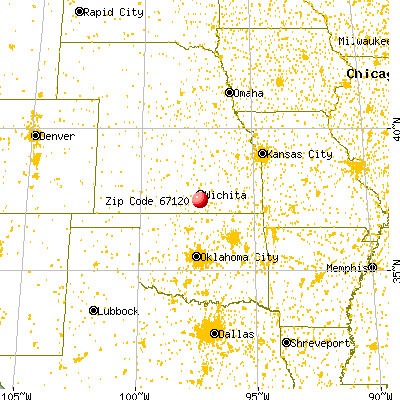
Land area: 40.6 sq. mi. Water area: 0.3 sq. mi.
Population density: 21 people per square mile
(very low).
OSM Map
General Map
Google Map
MSN Map
OSM Map
General Map
Google Map
MSN Map
OSM Map
General Map
Google Map
MSN Map
OSM Map
General Map
Google Map
MSN Map
Please wait while loading the map...
Real estate property taxes paid for housing units in 2022:
This zip code:
1.2% ($2,891)
Kansas:
1.2% ($2,578)
Median real estate property taxes paid for housing units with mortgages in 2022: $2,814 (1.1%) Median real estate property taxes paid for housing units with no mortgage in 2022: $3,152 (1.4%)
Business Search- 14 Million verified businesses
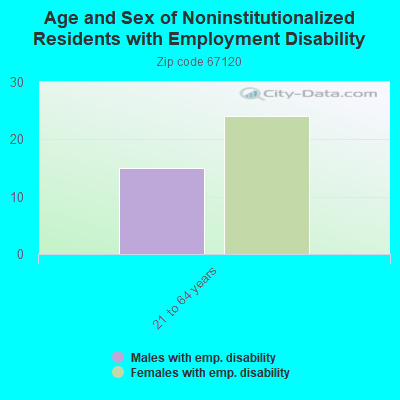
Males: 463
(54.1%)
Females: 393
(45.9%)
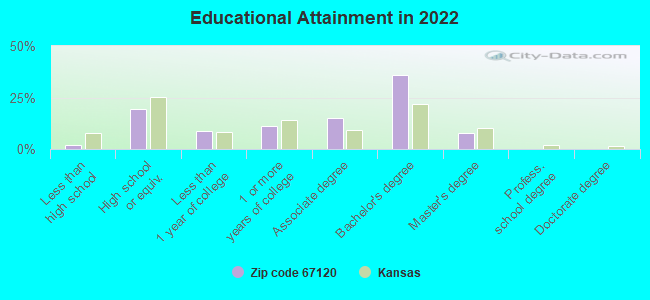
For population 25 years and over in 67120:
High school or higher: 98.5%
Bachelor's degree or higher: 43.7%
Graduate or professional degree: 7.8%
Mean travel time to work (commute): 31.6 minutes
For population 15 years and over in 67120:
Never married: 18.8%
Now married: 69.6%
Separated: 0.0%
Widowed: 6.2%
Divorced: 5.4%
Zip code 67120 compared to state average:
Unemployed percentage significantly below state average.
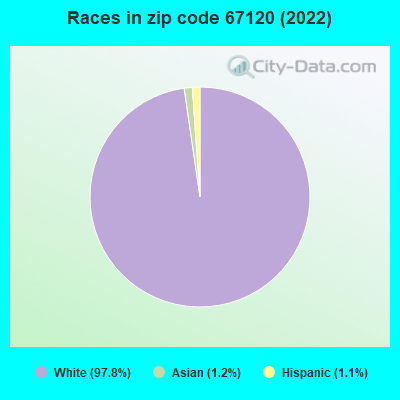
Black race population percentage significantly below state average.
Hispanic race population percentage significantly below state average.
Median age significantly above state average.
Foreign-born population percentage significantly below state average.
Renting percentage significantly below state average.
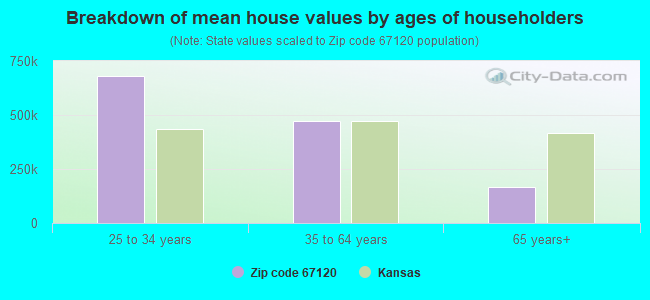
Estimated median house/condo value in 2022: $241,634
67120:
$241,634
Kansas:
$206,600
According to our research of Kansas and other state lists, there were 2 registered sex offenders living in 67120 zip code as of May 12, 2024. The ratio of all residents to sex offenders in zip code 67120 is 639 to 1. The ratio of registered sex offenders to all residents in this zip code is lower than the state average.
Median resident age:
This zip code:
55.4 years
Kansas median age:
37.6 years
Average household size:
This zip code:
2.2 people
Kansas:
2.4 people
Averages for the 2020 tax year for zip code 67120, filed in 2021:
Average Adjusted Gross Income (AGI) in 2020: $79,397 (Individual Income Tax Returns)
Here:
$79,397
State:
$72,721
Salary/wage: $62,430 (reported on 77.9% of returns)
Here:
$62,430
State:
$58,641
(% of AGI for various income ranges: 1082.3% for AGIs below $25k, 3360.0% for AGIs $25k-50k, 7090.0% for AGIs $50k-75k, 8185.7% for AGIs $75k-100k, 15228.9% for AGIs $100k-200k)
Taxable interest for individuals: $519 (reported on 38.2% of returns)
This zip code:
$519
Kansas:
$1,625
(% of AGI for various income ranges: 8.5% for AGIs below $25k, 24.0% for AGIs $25k-50k, 28.6% for AGIs $50k-75k, 42.9% for AGIs $75k-100k, 55.6% for AGIs $100k-200k)
Ordinary dividends: $1,782 (reported on 16.2% of returns)
Here:
$1,782
State:
$7,290
(% of AGI for various income ranges: 88.0% for AGIs $25k-50k, 40.0% for AGIs $75k-100k, 88.9% for AGIs $100k-200k)
Net capital gain/loss in AGI: +$5,120 (reported on 14.7% of returns)
Here:
+$5,120
State:
+$20,511
(% of AGI for various income ranges: 15.4% for AGIs below $25k, 254.3% for AGIs $50k-75k, 348.9% for AGIs $100k-200k)
Profit/loss from business: +$8,667 (reported on 13.2% of returns)
Here:
+$8,667
State:
+$13,852
(% of AGI for various income ranges: 86.2% for AGIs below $25k, 156.0% for AGIs $25k-50k, 390.0% for AGIs $50k-75k, 265.6% for AGIs $100k-200k)
Taxable individual retirement arrangement distribution: $15,988 (reported on 11.8% of returns)
67120:
$15,988
Kansas:
$19,921
(% of AGI for various income ranges: 246.0% for AGIs $25k-50k, 681.4% for AGIs $50k-75k, 617.8% for AGIs $100k-200k)
Total itemized deductions: $26,020 (reported on 7.4% of returns)
Here:
$26,020
State:
$36,939
(% of AGI for various income ranges: 458.0% for AGIs $25k-50k, 936.7% for AGIs $100k-200k)
Charity contributions: $9,025 (reported on 5.9% of returns)
Here:
$9,025
State:
$15,443
(% of AGI for various income ranges: 401.1% for AGIs $100k-200k)
Taxes paid: $7,020 (reported on 7.4% of returns)
67120:
$7,020
State:
$8,001
(% of AGI for various income ranges: 132.0% for AGIs $25k-50k, 243.3% for AGIs $100k-200k)
Earned income credit: $1,688 (reported on 11.8% of returns)
Here:
$1,688
State:
$2,267
(% of AGI for various income ranges: 53.1% for AGIs below $25k, 66.0% for AGIs $25k-50k)
Percentage of individuals using paid preparers for their 2020 taxes: 97.1%
Here:
97%
State:
95%
(% for various income ranges: 94.7% for AGIs below $25k, 92.9% for AGIs $25k-50k, 100.0% for AGIs $50k-75k, 100.0% for AGIs $75k-100k, 100.0% for AGIs $100k-200k, 100.0% for AGIs over 200k)
Averages for the 2012 tax year for zip code 67120, filed in 2013:
Average Adjusted Gross Income (AGI) in 2012: $58,285 (Individual Income Tax Returns)
Here:
$58,285
State:
$60,095
Salary/wage: $54,000 (reported on 82.3% of returns)
Here:
$54,000
State:
$48,770
(% of AGI for various income ranges: 68.5% for AGIs below $25k, 72.4% for AGIs $25k-50k, 83.7% for AGIs $50k-75k, 78.3% for AGIs $75k-100k, 74.4% for AGIs $100k-200k)
Taxable interest for individuals: $559 (reported on 46.8% of returns)
This zip code:
$559
Kansas:
$1,506
(% of AGI for various income ranges: 1.2% for AGIs below $25k, 0.6% for AGIs $25k-50k, 0.2% for AGIs $50k-75k, 0.3% for AGIs $75k-100k, 0.4% for AGIs $100k-200k)
Ordinary dividends: $1,531 (reported on 21.0% of returns)
Here:
$1,531
State:
$6,093
(% of AGI for various income ranges: 1.5% for AGIs below $25k, 0.3% for AGIs $50k-75k, 0.4% for AGIs $75k-100k, 0.8% for AGIs $100k-200k)
Net capital gain/loss in AGI: +$236 (reported on 17.7% of returns)
Here:
+$236
State:
+$14,598
(% of AGI for various income ranges: 0.1% for AGIs below $25k, 0.2% for AGIs $50k-75k)
Profit/loss from business: +$5,178 (reported on 14.5% of returns)
Here:
+$5,178
State:
+$12,554
(% of AGI for various income ranges: 12.4% for AGIs below $25k, 1.2% for AGIs $50k-75k, 0.8% for AGIs $100k-200k)
Taxable individual retirement arrangement distribution: $10,950 (reported on 12.9% of returns)
67120:
$10,950
Kansas:
$14,098
Total itemized deductions: $17,896 (20% of AGI, reported on 37.1% of returns)
Here:
$17,896
State:
$23,678
Here:
20.0% of AGI
State:
18.9% of AGI
(% of AGI for various income ranges: 12.2% for AGIs $25k-50k, 10.1% for AGIs $50k-75k, 12.7% for AGIs $75k-100k, 12.6% for AGIs $100k-200k)
Charity contributions: $3,489 (reported on 29.0% of returns)
Here:
$3,489
State:
$5,321
(% of AGI for various income ranges: 3.0% for AGIs below $25k, 1.5% for AGIs $50k-75k, 1.9% for AGIs $75k-100k, 2.1% for AGIs $100k-200k)
Taxes paid: $7,283 (reported on 37.1% of returns)
67120:
$7,283
State:
$9,548
(% of AGI for various income ranges: 3.1% for AGIs $25k-50k, 3.2% for AGIs $50k-75k, 4.9% for AGIs $75k-100k, 6.2% for AGIs $100k-200k)
Earned income credit: $2,186 (reported on 11.3% of returns)
Here:
$2,186
State:
$2,212
(% of AGI for various income ranges: 5.2% for AGIs below $25k, 0.8% for AGIs $25k-50k)
Percentage of individuals using paid preparers for their 2012 taxes: 58.1%
Here:
58%
State:
56%
(% for various income ranges: 47.4% for AGIs below $25k, 58.3% for AGIs $25k-50k, 70.0% for AGIs $50k-75k, 55.6% for AGIs $75k-100k, 66.7% for AGIs $100k-200k)
Averages for the 2004 tax year for zip code 67120, filed in 2005:
Average Adjusted Gross Income (AGI) in 2004: $46,629 (Individual Income Tax Returns)
Here:
$46,629
State:
$45,726
Salary/wage: $42,835 (reported on 88.6% of returns)
Here:
$42,835
State:
$40,112
(% of AGI for various income ranges: 101.8% for AGIs below $10k, 80.6% for AGIs $10k-25k, 84.4% for AGIs $25k-50k, 85.5% for AGIs $50k-75k, 87.8% for AGIs $75k-100k, 64.9% for AGIs over 100k)
Taxable interest for individuals: $809 (reported on 51.3% of returns)
This zip code:
$809
Kansas:
$1,749
(% of AGI for various income ranges: 4.1% for AGIs below $10k, 0.9% for AGIs $10k-25k, 1.2% for AGIs $25k-50k, 0.3% for AGIs $50k-75k, 0.1% for AGIs $75k-100k, 2.0% for AGIs over 100k)
Taxable dividends: $407 (reported on 28.8% of returns)
Here:
$407
State:
$3,066
(% of AGI for various income ranges: 0.4% for AGIs $10k-25k, 0.2% for AGIs $25k-50k, 0.4% for AGIs $50k-75k, 0.0% for AGIs $75k-100k, 0.3% for AGIs over 100k)
Net capital gain/loss: +$858 (reported on 17.9% of returns)
Here:
+$858
State:
+$7,555
(% of AGI for various income ranges: 2.5% for AGIs below $10k, -0.6% for AGIs $10k-25k, -0.2% for AGIs $25k-50k, 0.9% for AGIs $50k-75k, -0.1% for AGIs $75k-100k, 0.8% for AGIs over 100k)
Profit/loss from business: +$4,674 (reported on 14.1% of returns)
Here:
+$4,674
State:
+$9,571
(% of AGI for various income ranges: 13.2% for AGIs below $10k, 2.4% for AGIs $25k-50k, 0.8% for AGIs $50k-75k, 2.4% for AGIs $75k-100k)
IRA payment deduction: $2,800 (reported on 3.2% of returns)
67120:
$2,800
Kansas:
$2,922
Total itemized deductions: $15,655 (21% of AGI, reported on 37.2% of returns)
Here:
$15,655
State:
$18,779
Here:
20.8% of AGI
State:
20.5% of AGI
(% of AGI for various income ranges: 11.0% for AGIs $10k-25k, 11.1% for AGIs $25k-50k, 11.3% for AGIs $50k-75k, 15.0% for AGIs $75k-100k, 13.9% for AGIs over 100k)
Charity contributions deductions: $2,782 (4% of AGI, reported on 32.6% of returns)
Here:
$2,782
State:
$3,892
Here:
3.6% of AGI
State:
4.0% of AGI
(% of AGI for various income ranges: 6.1% for AGIs below $10k, 1.6% for AGIs $25k-50k, 1.6% for AGIs $50k-75k, 2.8% for AGIs $75k-100k, 2.1% for AGIs over 100k)
Total tax: $5,691 (reported on 79.6% of returns)
67120:
$5,691
State:
$7,203
(% of AGI for various income ranges: 1.3% for AGIs below $10k, 3.3% for AGIs $10k-25k, 6.9% for AGIs $25k-50k, 8.1% for AGIs $50k-75k, 9.7% for AGIs $75k-100k, 17.0% for AGIs over 100k)
Earned income credit: $1,532 (reported on 7.4% of returns)
Here:
$1,532
State:
$1,674
Percentage of individuals using paid preparers for their 2004 taxes: 57.8%
Here:
58%
State:
63%
(% for various income ranges: 37.6% for AGIs below $10k, 57.3% for AGIs $10k-25k, 66.9% for AGIs $25k-50k, 67.7% for AGIs $50k-75k, 51.2% for AGIs $75k-100k, 61.0% for AGIs over 100k)
Size of family households: 156 2-persons, 10 3-persons, 10 4-persons, 42 5-persons, 21 6-persons
Size of nonfamily households: 153 1-person
131 married couples with children.
0 single-parent households ().
96.2% of residents of 67120 zip code speak English at home.
3.1% of residents speak other Indo-European language at home (100% very well).
0.9% of residents speak Asian or Pacific Island language at home (100% well).
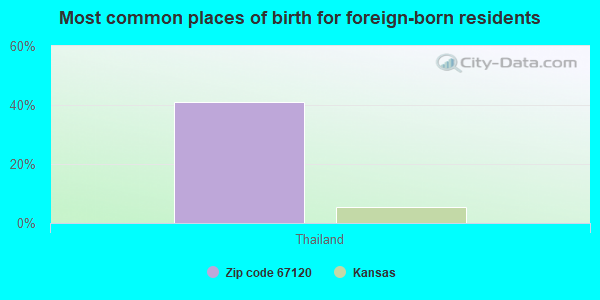
Foreign born population: 21 (2.5%) (100.0% of them are naturalized citizens)
This zip code:
2.5%
Whole state:
7.1%
41%Thailand
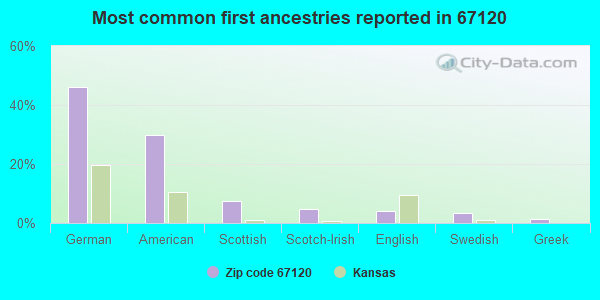
46%German
30%American
7%Scottish
5%Scotch-Irish
4%English
3%Swedish
1%Greek
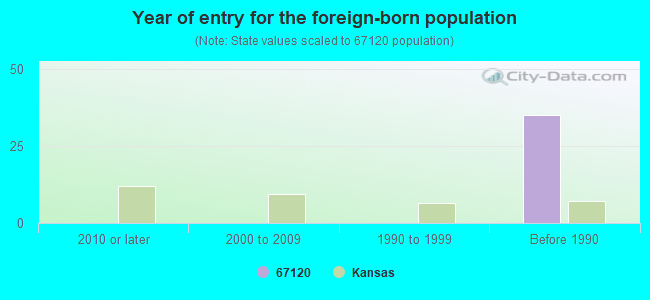
Year of entry for the foreign-born population
02010 or later
02000 to 2009
01990 to 1999
35Before 1990
Facilities with environmental interests located in this zip code:
MULVANE CO-OP UNION (828 N AVENUE E ST in PECK, KS)
AIR MINOR (AIRS/AFS) STATE MASTER (Kansas Facility Profiler) - ISTEPS-17300030, AIR PROGRAM, RTK-SG00083, EPCRA Business SIC classification: GRAIN AND FIELD BEANS Business NAICS classification: GRAIN AND FIELD BEAN WHOLESALERS. Organizations: MULVANE COOP UNION Alternative names: MULVANE Cooperative UNION
CALLAWAYS AUTOBODY (9949 S MERIDIAN in PECK, KS)
Conditionally Exempt Small Quantity Generators, less than 100 kg/month of hazardous waste (Resource Conservation and Recovery Act (tracking hazardous waste)) - notification Organizations: FARRELL CALLAWAY (CONTACT/OWNER)
Housing units lacking complete plumbing facilities: 18.4% Housing units lacking complete kitchen facilities: 16.9%
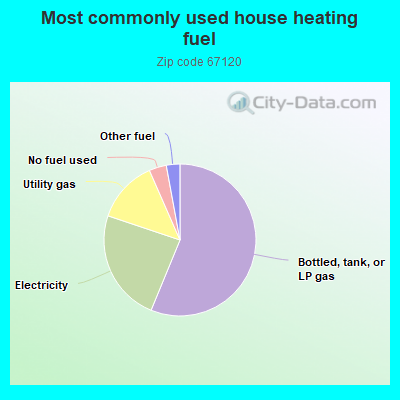
56.4%Bottled, tank, or LP gas
24.0%Electricity
13.3%Utility gas
3.7%No fuel used
2.9%Other fuel
Population in 1990: 1,023. Population change in the 1990s: +317 (+31.0%).
Place of birth for U.S.-born residents:
This state: 531
Midwest: 100
South: 151
West: 31
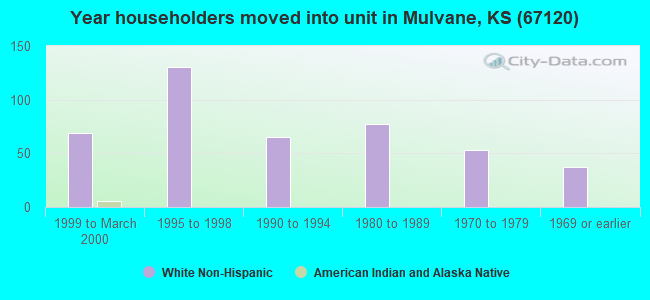
55% of the 67120 zip code residents lived in the same house 5 years ago. Out of people who lived in different houses, 26% lived in this county. Out of people who lived in different counties, 50% lived in Kansas.
91% of the 67120 zip code residents lived in the same house 1 year ago. Out of people who lived in different houses, 97% moved from this county.
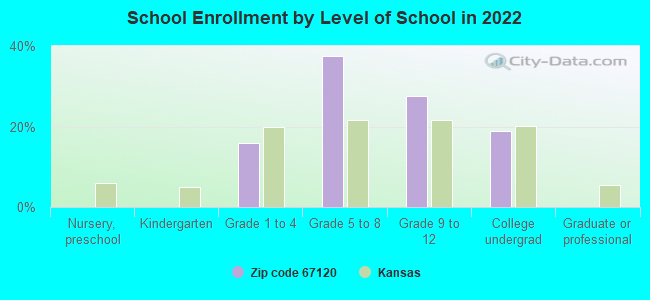
Private vs. public school enrollment:
Students in private schools in grades 1 to 8 (elementary and middle school): 11
Here:
11.0%
Kansas:
14.1%
Students in private schools in grades 9 to 12 (high school):
Here:
0.0%
Kansas:
10.8%
Students in private undergraduate colleges:
Here:
0.0%
Kansas:
15.4%
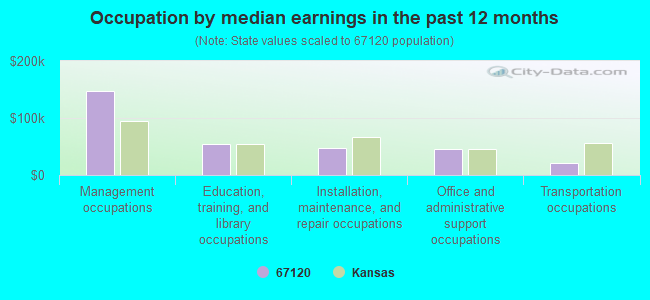
Occupation by median earnings in the past 12 months ($)
147,107Management occupations
54,773Education, training, and library occupations
46,541Installation, maintenance, and repair occupations
46,019Office and administrative support occupations
21,624Transportation occupations
Top industries in this zip code by the number of employees in 2005:
Other Services (except Public Administration): Other Personal Care Services (5-9 employees: 1 establishment)
Construction: Structural Steel and Precast Concrete Contractors (1-4: 1)
Construction: Poured Concrete Foundation and Structure Contractors (1-4: 1)
Other Services (except Public Administration): Automotive Transmission Repair (1-4: 1)
Wholesale Trade: Grain and Field Bean Merchant Wholesalers (1-4: 1)
Construction: New Single-Family Housing Construction (except Operative Builders) (1-4: 1)
Finance and Insurance: Mortgage and Nonmortgage Loan Brokers (1-4: 1)
People in group quarters in 2000:
21 people in nursing homes
Fatal accident statistics in 2014:
Fatal accident count: 1
Vehicles involved in fatal accidents: 1
Fatal accidents caused by drunken drivers: 0
Fatalities: 2
Persons involved in fatal accidents: 2
Pedestrians involved in fatal accidents: 0
Fatal accident statistics in 2013:
Fatal accident count: 1
Vehicles involved in fatal accidents: 2
Fatal accidents caused by drunken drivers: 0
Fatalities: 1
Persons involved in fatal accidents: 2
Pedestrians involved in fatal accidents: 0
Home Mortgage Disclosure Act Aggregated Statistics For Year 2009 (Based on 2 partial tracts)
A) FHA, FSA/RHS & VA Home Purchase Loans
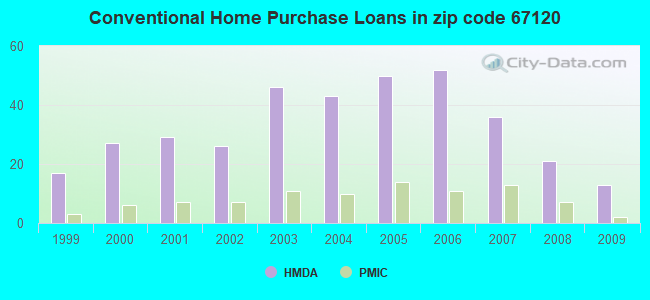
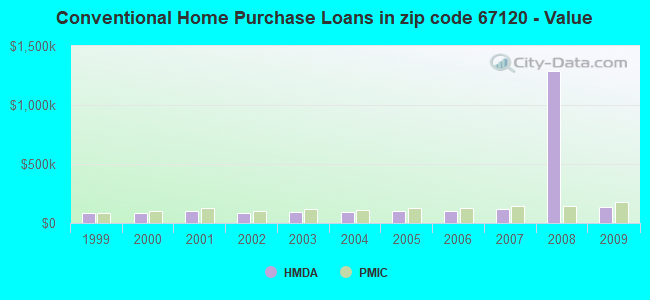
B) Conventional Home Purchase Loans
C) Refinancings
D) Home Improvement Loans
F) Non-occupant Loans on < 5 Family Dwellings (A B C & D)
G) Loans On Manufactured Home Dwelling (A B C & D)
Number
Average Value
Number
Average Value
Number
Average Value
Number
Average Value
Number
Average Value
Number
Average Value
LOANS ORIGINATED
14
$133,904
13
$138,638
60
$117,405
9
$27,779
5
$75,414
8
$59,315
APPLICATIONS APPROVED, NOT ACCEPTED
0
$0
2
$78,540
2
$125,415
1
$12,340
0
$0
1
$71,550
APPLICATIONS DENIED
4
$93,650
2
$81,005
22
$119,173
5
$10,938
1
$36,600
4
$67,335
APPLICATIONS WITHDRAWN
2
$147,210
2
$117,400
7
$116,899
1
$18,500
0
$0
0
$0
FILES CLOSED FOR INCOMPLETENESS
0
$0
0
$0
0
$0
0
$0
0
$0
0
$0
Aggregated Statistics For Year 2008 (Based on 2 partial tracts)
A) FHA, FSA/RHS & VA Home Purchase Loans
B) Conventional Home Purchase Loans
C) Refinancings
D) Home Improvement Loans
F) Non-occupant Loans on < 5 Family Dwellings (A B C & D)
G) Loans On Manufactured Home Dwelling (A B C & D)
Number
Average Value
Number
Average Value
Number
Average Value
Number
Average Value
Number
Average Value
Number
Average Value
LOANS ORIGINATED
16
$116,524
21
$1,284,569
31
$111,820
18
$51,651
6
$40,023
11
$48,634
APPLICATIONS APPROVED, NOT ACCEPTED
0
$0
4
$79,978
5
$118,178
2
$26,110
0
$0
3
$69,080
APPLICATIONS DENIED
3
$125,003
7
$73,604
19
$121,888
12
$26,077
2
$39,270
5
$75,660
APPLICATIONS WITHDRAWN
3
$86,490
3
$120,893
9
$141,316
1
$89,640
1
$43,180
1
$99,510
FILES CLOSED FOR INCOMPLETENESS
0
$0
0
$0
1
$111,020
0
$0
0
$0
0
$0
Aggregated Statistics For Year 2007 (Based on 2 partial tracts)
A) FHA, FSA/RHS & VA Home Purchase Loans
B) Conventional Home Purchase Loans
C) Refinancings
D) Home Improvement Loans
F) Non-occupant Loans on < 5 Family Dwellings (A B C & D)
G) Loans On Manufactured Home Dwelling (A B C & D)
Number
Average Value
Number
Average Value
Number
Average Value
Number
Average Value
Number
Average Value
Number
Average Value
LOANS ORIGINATED
10
$130,350
36
$119,751
33
$96,806
19
$38,545
5
$60,610
11
$53,942
APPLICATIONS APPROVED, NOT ACCEPTED
2
$115,755
11
$64,446
6
$131,583
1
$11,100
1
$32,900
6
$62,572
APPLICATIONS DENIED
3
$90,877
11
$94,165
30
$116,219
16
$24,878
1
$30,840
12
$60,001
APPLICATIONS WITHDRAWN
1
$113,490
5
$86,106
16
$115,907
2
$57,360
0
$0
2
$74,635
FILES CLOSED FOR INCOMPLETENESS
0
$0
0
$0
1
$164,480
0
$0
0
$0
0
$0
Aggregated Statistics For Year 2006 (Based on 2 partial tracts)
A) FHA, FSA/RHS & VA Home Purchase Loans
B) Conventional Home Purchase Loans
C) Refinancings
D) Home Improvement Loans
F) Non-occupant Loans on < 5 Family Dwellings (A B C & D)
G) Loans On Manufactured Home Dwelling (A B C & D)
Number
Average Value
Number
Average Value
Number
Average Value
Number
Average Value
Number
Average Value
Number
Average Value
LOANS ORIGINATED
7
$132,054
52
$97,533
37
$97,176
15
$25,878
7
$55,453
10
$50,413
APPLICATIONS APPROVED, NOT ACCEPTED
2
$96,840
7
$91,580
6
$91,628
1
$32,900
0
$0
5
$67,684
APPLICATIONS DENIED
2
$60,240
13
$87,364
30
$113,806
12
$38,858
1
$84,300
8
$62,554
APPLICATIONS WITHDRAWN
0
$0
7
$65,557
14
$144,419
1
$15,630
1
$62,090
1
$56,330
FILES CLOSED FOR INCOMPLETENESS
0
$0
2
$244,460
4
$81,110
0
$0
0
$0
0
$0
Aggregated Statistics For Year 2005 (Based on 2 partial tracts)
A) FHA, FSA/RHS & VA Home Purchase Loans
B) Conventional Home Purchase Loans
C) Refinancings
D) Home Improvement Loans
F) Non-occupant Loans on < 5 Family Dwellings (A B C & D)
G) Loans On Manufactured Home Dwelling (A B C & D)
Number
Average Value
Number
Average Value
Number
Average Value
Number
Average Value
Number
Average Value
Number
Average Value
LOANS ORIGINATED
8
$116,986
50
$103,886
43
$106,204
14
$22,586
7
$118,660
9
$54,050
APPLICATIONS APPROVED, NOT ACCEPTED
0
$0
4
$67,335
9
$129,300
4
$30,942
0
$0
3
$65,517
APPLICATIONS DENIED
0
$0
11
$70,240
38
$107,161
10
$56,334
1
$65,380
9
$63,599
APPLICATIONS WITHDRAWN
0
$0
7
$105,384
25
$118,968
2
$210,535
1
$42,350
2
$79,155
FILES CLOSED FOR INCOMPLETENESS
0
$0
0
$0
5
$119,742
0
$0
0
$0
1
$55,920
Aggregated Statistics For Year 2004 (Based on 2 partial tracts)
A) FHA, FSA/RHS & VA Home Purchase Loans
B) Conventional Home Purchase Loans
C) Refinancings
D) Home Improvement Loans
F) Non-occupant Loans on < 5 Family Dwellings (A B C & D)
G) Loans On Manufactured Home Dwelling (A B C & D)
Number
Average Value
Number
Average Value
Number
Average Value
Number
Average Value
Number
Average Value
Number
Average Value
LOANS ORIGINATED
6
$108,213
43
$96,517
55
$92,415
16
$31,791
4
$52,325
8
$51,298
APPLICATIONS APPROVED, NOT ACCEPTED
1
$93,750
9
$77,991
9
$99,282
2
$33,100
1
$63,740
4
$84,295
APPLICATIONS DENIED
2
$105,060
18
$70,841
38
$89,944
10
$30,059
0
$0
13
$46,529
APPLICATIONS WITHDRAWN
1
$103,210
6
$89,915
13
$95,367
0
$0
1
$46,880
2
$46,055
FILES CLOSED FOR INCOMPLETENESS
0
$0
1
$181,750
7
$127,649
1
$17,270
0
$0
0
$0
Aggregated Statistics For Year 2003 (Based on 2 partial tracts)
A) FHA, FSA/RHS & VA Home Purchase Loans
B) Conventional Home Purchase Loans
C) Refinancings
D) Home Improvement Loans
F) Non-occupant Loans on < 5 Family Dwellings (A B C & D)
Number
Average Value
Number
Average Value
Number
Average Value
Number
Average Value
Number
Average Value
LOANS ORIGINATED
9
$115,912
46
$96,650
109
$98,975
14
$21,500
5
$50,084
APPLICATIONS APPROVED, NOT ACCEPTED
0
$0
5
$126,896
15
$103,842
4
$9,870
1
$24,670
APPLICATIONS DENIED
2
$98,275
17
$62,696
37
$93,198
8
$20,920
1
$62,910
APPLICATIONS WITHDRAWN
0
$0
3
$100,060
22
$99,230
0
$0
0
$0
FILES CLOSED FOR INCOMPLETENESS
0
$0
2
$60,860
3
$119,523
0
$0
0
$0
Aggregated Statistics For Year 2002 (Based on 2 partial tracts)
A) FHA, FSA/RHS & VA Home Purchase Loans
B) Conventional Home Purchase Loans
C) Refinancings
D) Home Improvement Loans
F) Non-occupant Loans on < 5 Family Dwellings (A B C & D)
Number
Average Value
Number
Average Value
Number
Average Value
Number
Average Value
Number
Average Value
LOANS ORIGINATED
6
$100,743
26
$88,139
83
$90,256
10
$18,340
5
$57,404
APPLICATIONS APPROVED, NOT ACCEPTED
0
$0
7
$67,496
9
$95,490
1
$11,100
0
$0
APPLICATIONS DENIED
0
$0
12
$71,480
21
$86,156
4
$6,580
0
$0
APPLICATIONS WITHDRAWN
0
$0
2
$55,100
18
$81,075
1
$10,690
1
$37,010
FILES CLOSED FOR INCOMPLETENESS
0
$0
0
$0
5
$91,862
1
$71,960
0
$0
Aggregated Statistics For Year 2001 (Based on 2 partial tracts)
A) FHA, FSA/RHS & VA Home Purchase Loans
B) Conventional Home Purchase Loans
C) Refinancings
D) Home Improvement Loans
F) Non-occupant Loans on < 5 Family Dwellings (A B C & D)
Number
Average Value
Number
Average Value
Number
Average Value
Number
Average Value
Number
Average Value
LOANS ORIGINATED
9
$117,147
29
$103,566
64
$87,393
22
$16,000
3
$45,093
APPLICATIONS APPROVED, NOT ACCEPTED
1
$86,350
7
$58,039
10
$76,072
2
$14,390
2
$34,540
APPLICATIONS DENIED
1
$72,370
17
$64,534
29
$75,661
7
$22,029
1
$16,860
APPLICATIONS WITHDRAWN
0
$0
4
$81,008
15
$70,836
3
$25,083
0
$0
FILES CLOSED FOR INCOMPLETENESS
0
$0
1
$78,950
4
$70,212
0
$0
0
$0
Aggregated Statistics For Year 2000 (Based on 2 partial tracts)
A) FHA, FSA/RHS & VA Home Purchase Loans
B) Conventional Home Purchase Loans
C) Refinancings
D) Home Improvement Loans
F) Non-occupant Loans on < 5 Family Dwellings (A B C & D)
Number
Average Value
Number
Average Value
Number
Average Value
Number
Average Value
Number
Average Value
LOANS ORIGINATED
6
$90,258
27
$84,357
28
$84,634
19
$13,353
2
$47,080
APPLICATIONS APPROVED, NOT ACCEPTED
1
$69,080
8
$79,208
6
$77,100
4
$26,008
0
$0
APPLICATIONS DENIED
2
$70,520
17
$58,995
20
$76,031
9
$13,752
1
$20,970
APPLICATIONS WITHDRAWN
1
$55,920
2
$76,485
14
$70,109
1
$29,200
0
$0
FILES CLOSED FOR INCOMPLETENESS
0
$0
3
$105,267
2
$74,425
0
$0
0
$0
Aggregated Statistics For Year 1999 (Based on 1 partial tract)
A) FHA, FSA/RHS & VA Home Purchase Loans
B) Conventional Home Purchase Loans
C) Refinancings
D) Home Improvement Loans
F) Non-occupant Loans on < 5 Family Dwellings (A B C & D)
Detailed PMIC statistics for the following Tracts:0097.00
2002 - 2018 National Fire Incident Reporting System (NFIRS) incidents
Based on the data from the years 2002 - 2018 the average number of fire incidents per year is 11. The highest number of reported fire incidents - 20 took place in 2017, and the least - 2 in 2010. The data has a dropping trend.
When looking into fire subcategories, the most incidents belonged to: Outside Fires (60.6%), and Structure Fires (17.8%).
Fire incident types reported to NFIRS in Zip Code 67120


 Nearest zip codes: 67060, 67026, 67013, 67110, 67217, 67215.


 Based on the data from the years 2002 - 2018 the average number of fire incidents per year is 11. The highest number of reported fire incidents - 20 took place in 2017, and the least - 2 in 2010. The data has a dropping trend.
 When looking into fire subcategories, the most incidents belonged to: Outside Fires (60.6%), and Structure Fires (17.8%).