Estimated zip code population in 2022: 990 Zip code population in 2010: 802 Zip code population in 2000: 894
Houses and condos: 426 Renter-occupied apartments: 57
% of renters here:
15%
State:
32%
March 2022 cost of living index in zip code 67140: 78.0 (low, U.S. average is 100)
Land area: 134.8 sq. mi. Water area: 0.0 sq. mi.
Population density: 7 people per square mile
(very low).
OSM Map
General Map
Google Map
MSN Map
OSM Map
General Map
Google Map
MSN Map
OSM Map
General Map
Google Map
MSN Map
OSM Map
General Map
Google Map
MSN Map
Please wait while loading the map...
Real estate property taxes paid for housing units in 2022:
This zip code:
1.9% ($1,929)
Kansas:
1.2% ($2,578)
Median real estate property taxes paid for housing units with mortgages in 2022: $1,439 (1.7%) Median real estate property taxes paid for housing units with no mortgage in 2022: $2,082 (2.1%)
Business Search- 14 Million verified businesses
Males: 460
(46.5%)
Females: 529
(53.5%)
For population 25 years and over in 67140:
High school or higher: 94.7%
Bachelor's degree or higher: 19.7%
Graduate or professional degree: 6.3%
Unemployed: 3.3%
Mean travel time to work (commute): 30.6 minutes
For population 15 years and over in 67140:
Never married: 26.0%
Now married: 61.7%
Separated: 0.0%
Widowed: 5.1%
Divorced: 7.2%
Zip code 67140 compared to state average:
Median household income below state average.
Median house value below state average.
Black race population percentage significantly below state average.
Hispanic race population percentage significantly below state average.
Foreign-born population percentage significantly below state average.
Renting percentage below state average.
Length of stay since moving in significantly below state average.
Number of college students below state average.
Percentage of population with a bachelor's degree or higher below state average.
Estimated median house/condo value in 2022: $101,063
67140:
$101,063
Kansas:
$206,600
According to our research of Kansas and other state lists, there were 3 registered sex offenders living in 67140 zip code as of June 05, 2024. The ratio of all residents to sex offenders in zip code 67140 is 264 to 1. The ratio of registered sex offenders to all residents in this zip code is near the state average.
Median resident age:
This zip code:
37.5 years
Kansas median age:
37.6 years
Average household size:
This zip code:
2.5 people
Kansas:
2.4 people
Averages for the 2020 tax year for zip code 67140, filed in 2021:
Average Adjusted Gross Income (AGI) in 2020: $59,391 (Individual Income Tax Returns)
Here:
$59,391
State:
$72,721
Salary/wage: $49,700 (reported on 79.4% of returns)
Here:
$49,700
State:
$58,641
(% of AGI for various income ranges: 1391.7% for AGIs below $25k, 3578.3% for AGIs $25k-50k, 6437.5% for AGIs $50k-75k, 12280.0% for AGIs $75k-100k, 18020.0% for AGIs $100k-200k)
Taxable interest for individuals: $546 (reported on 38.2% of returns)
This zip code:
$546
Kansas:
$1,625
(% of AGI for various income ranges: 30.0% for AGIs below $25k, 17.5% for AGIs $50k-75k, 55.0% for AGIs $75k-100k, 116.7% for AGIs $100k-200k)
Ordinary dividends: $1,400 (reported on 11.8% of returns)
Here:
$1,400
State:
$7,290
(% of AGI for various income ranges: 280.0% for AGIs $75k-100k)
Net capital gain/loss in AGI: +$2,800 (reported on 11.8% of returns)
Here:
+$2,800
State:
+$20,511
(% of AGI for various income ranges: 560.0% for AGIs $75k-100k)
Profit/loss from business: +$2,360 (reported on 14.7% of returns)
Here:
+$2,360
State:
+$13,852
(% of AGI for various income ranges: 615.0% for AGIs $75k-100k)
Earned income credit: $2,240 (reported on 14.7% of returns)
Here:
$2,240
State:
$2,267
(% of AGI for various income ranges: 111.7% for AGIs below $25k, 75.0% for AGIs $25k-50k)
Percentage of individuals using paid preparers for their 2020 taxes: 94.1%
Here:
94%
State:
95%
(% for various income ranges: 90.0% for AGIs below $25k, 100.0% for AGIs $25k-50k, 83.3% for AGIs $50k-75k, 100.0% for AGIs $75k-100k, 100.0% for AGIs $100k-200k)
Averages for the 2012 tax year for zip code 67140, filed in 2013:
Average Adjusted Gross Income (AGI) in 2012: $52,503 (Individual Income Tax Returns)
Here:
$52,503
State:
$60,095
Salary/wage: $39,935 (reported on 81.2% of returns)
Here:
$39,935
State:
$48,770
(% of AGI for various income ranges: 72.0% for AGIs below $25k, 71.5% for AGIs $25k-50k, 73.8% for AGIs $50k-75k, 77.3% for AGIs $75k-100k, 45.4% for AGIs $100k-200k)
Taxable interest for individuals: $625 (reported on 37.5% of returns)
This zip code:
$625
Kansas:
$1,506
(% of AGI for various income ranges: 1.2% for AGIs below $25k, 0.3% for AGIs $25k-50k, 0.8% for AGIs $50k-75k, 0.4% for AGIs $100k-200k)
Ordinary dividends: $667 (reported on 9.4% of returns)
Here:
$667
State:
$6,093
Net capital gain/loss in AGI: +$500 (reported on 9.4% of returns)
Here:
+$500
State:
+$14,598
Profit/loss from business: +$2,267 (reported on 9.4% of returns)
Here:
+$2,267
State:
+$12,554
Total itemized deductions: $19,700 (19% of AGI, reported on 21.9% of returns)
Here:
$19,700
State:
$23,678
Here:
18.6% of AGI
State:
18.9% of AGI
Charity contributions: $3,425 (reported on 12.5% of returns)
Here:
$3,425
State:
$5,321
Taxes paid: $8,043 (reported on 21.9% of returns)
67140:
$8,043
State:
$9,548
Earned income credit: $1,900 (reported on 12.5% of returns)
Here:
$1,900
State:
$2,212
(% of AGI for various income ranges: 2.6% for AGIs below $25k, 1.7% for AGIs $25k-50k)
Percentage of individuals using paid preparers for their 2012 taxes: 71.9%
Here:
72%
State:
56%
(% for various income ranges: 63.6% for AGIs below $25k, 62.5% for AGIs $25k-50k, 80.0% for AGIs $50k-75k, 100.0% for AGIs $75k-100k, 80.0% for AGIs $100k-200k)
Averages for the 2004 tax year for zip code 67140, filed in 2005:
Average Adjusted Gross Income (AGI) in 2004: $32,755 (Individual Income Tax Returns)
Here:
$32,755
State:
$45,726
Salary/wage: $32,767 (reported on 81.8% of returns)
Here:
$32,767
State:
$40,112
(% of AGI for various income ranges: 101.0% for AGIs below $10k, 76.9% for AGIs $10k-25k, 80.4% for AGIs $25k-50k, 90.9% for AGIs $50k-75k, 126.5% for AGIs $75k-100k)
Taxable interest for individuals: $1,093 (reported on 45.8% of returns)
This zip code:
$1,093
Kansas:
$1,749
(% of AGI for various income ranges: 17.9% for AGIs below $10k, 1.6% for AGIs $10k-25k, 2.2% for AGIs $25k-50k, 0.3% for AGIs $50k-75k, 0.5% for AGIs $75k-100k)
Taxable dividends: $365 (reported on 15.8% of returns)
Here:
$365
State:
$3,066
Net capital gain/loss: +$778 (reported on 13.6% of returns)
Here:
+$778
State:
+$7,555
Total itemized deductions: $14,887 (25% of AGI, reported on 16.1% of returns)
Here:
$14,887
State:
$18,779
Here:
25.4% of AGI
State:
20.5% of AGI
(% of AGI for various income ranges: 44.2% for AGIs below $10k, 5.4% for AGIs $25k-50k, 5.9% for AGIs $50k-75k, 16.9% for AGIs $75k-100k)
Charity contributions deductions: $1,676 (3% of AGI, reported on 11.2% of returns)
Here:
$1,676
State:
$3,892
Here:
2.7% of AGI
State:
4.0% of AGI
Total tax: $3,772 (reported on 70.3% of returns)
67140:
$3,772
State:
$7,203
(% of AGI for various income ranges: 2.9% for AGIs below $10k, 3.2% for AGIs $10k-25k, 6.9% for AGIs $25k-50k, 8.1% for AGIs $50k-75k, 10.5% for AGIs $75k-100k, 14.2% for AGIs over 100k)
Earned income credit: $2,000 (reported on 14.5% of returns)
Here:
$2,000
State:
$1,674
Percentage of individuals using paid preparers for their 2004 taxes: 72.4%
Here:
72%
State:
63%
(% for various income ranges: 66.7% for AGIs below $10k, 71.3% for AGIs $10k-25k, 82.5% for AGIs $25k-50k, 68.1% for AGIs $50k-75k, 104.5% for AGIs $75k-100k)
Likely homosexual households (counted as self-reported same-sex unmarried-partner households)
Lesbian couples: 0.2% of all households
Gay men: 0.0% of all households
Household received Food Stamps/SNAP in the past 12 months: 26 Household did not receive Food Stamps/SNAP in the past 12 months: 368
Women who had a birth in the past 12 months: 15 (8 now married, 7 unmarried) Women who did not have a birth in the past 12 months: 201 (155 now married, 44 unmarried)
Housing units in zip code 67140 with a mortgage: 125 (1 second mortgage) Houses without a mortgage: 1
Median monthly owner costs for units with a mortgage: $954 Median monthly owner costs for units without a mortgage: $623
Residents with income below the poverty level in 2022:
This zip code:
10.3%
Whole state:
12.0%
Residents with income below 50% of the poverty level in 2022:
This zip code:
5.0%
Whole state:
6.4%
Median number of rooms in houses and condos:
Here:
6.5
State:
6.9
Median number of rooms in apartments:
Here:
4.8
State:
4.4
Notable locations in this zip code not listed on our city pages
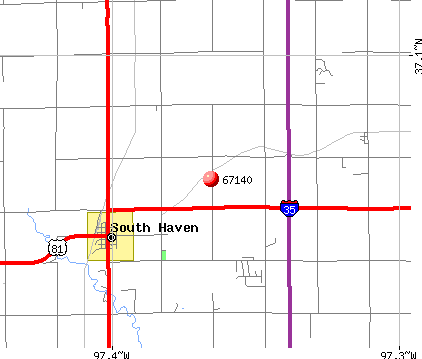
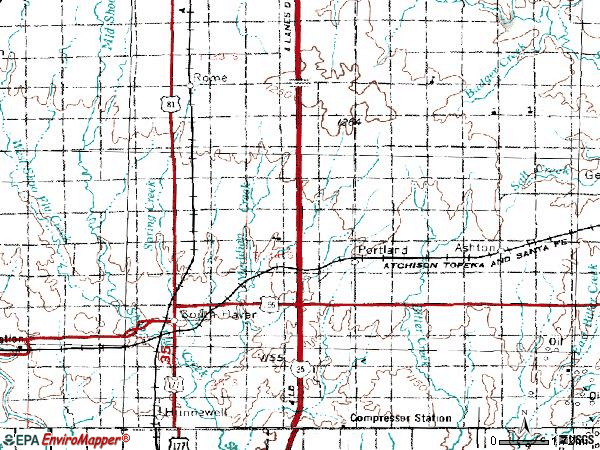
Notable locations in zip code 67140: South Haven Wastewater Plant (A), Interstate 35 Weigh Station 26A (B), South Haven Police Department (C), South Haven Volunteer Fire Department (D), South Haven Township Library (E). Display/hide their locations on the map
Churches in zip code 67140 include: First United Methodist Church of South Haven (A), South Haven Baptist Church (B), South Haven Christian Church (C). Display/hide their locations on the map
Creeks: Antelope Creek (A), Meridian Creek (B), West Shoo Fly Creek (C), Middle Shoo Fly Creek (D), East Shoo Fly Creek (E), Spring Creek (F). Display/hide their locations on the map
Size of family households: 118 2-persons, 22 3-persons, 39 4-persons, 74 5-persons, 19 6-persons, 10 7-or-more-persons
Size of nonfamily households: 89 1-person, 15 2-persons
237 married couples with children.
7 single-parent households (4 men, 3 women).
98.8% of residents of 67140 zip code speak English at home.
1.1% of residents speak Spanish at home (100% very well).
Foreign born population: 0 (0.0%)
:
0.0%
Whole state:
7.1%
14%German
8%American
6%English
5%Irish
1%Czechoslovakian
1%Czech
1%European
Facilities with environmental interests located in this zip code:
ECONOMY INN (880 E 160TH ST S in SOUTH HAVEN, KS)
STATE MASTER (Kansas Facility Profiler) - WWT-C-AR81-NO01, WASTEWATER FACILITY National Pollutant Discharge Elimination System NON-MAJOR (Tracking pollutant discharge elimination systems) - permit Business SIC classification: HOTELS AND MOTELS
WELLINGTON FARMERS COOP GRAIN ASSOC. (SOUTH EDGE OF TOWN in SOUTH HAVEN, KS)
AIR MINOR (AIRS/AFS) STATE MASTER (Kansas Facility Profiler) - ISTEPS-19100029, AIR PROGRAM Business SIC classification: GRAIN AND FIELD BEANS Business NAICS classification: GRAIN AND FIELD BEAN WHOLESALERS.
WELLINGTON FARMERS COOP GRAIN ASSOC. (NORTHWEST OF TOWN in SOUTH HAVEN, KS)
AIR MINOR (AIRS/AFS) STATE MASTER (Kansas Facility Profiler) - ISTEPS-19100021, AIR PROGRAM Business SIC classification: GRAIN AND FIELD BEANS Business NAICS classification: GRAIN AND FIELD BEAN WHOLESALERS.
ARKLA-HUNNEWELL (3 MI E RT 81 ON GRVL RD S in HUNNEWELL, KS)
(Integrated Compliance Information System) - ICIS-07-1995-0056, FORMAL ENFORCEMENT ACTION, ICIS-07-1989-0197,
CENTER POINT ENERGY HUNNEWELL STA (1 M E BRAMEN OK 6 M SHERE RD T in HUNNEWELL, KS)
Large Quantity Generators, more that 1000 kg of hazardous waste/month (Resource Conservation and Recovery Act (tracking hazardous waste))
AT&T (RR in SOUTH HAVEN, KS)
(Resource Conservation and Recovery Act (tracking hazardous waste)) Organizations: AMERICAN TEL & TEL CO LONG LINES (CONTACT/OWNER)
C R TYSON (1537 S HOOVER ROAD in SOUTH HAVEN, KS)
AIR MINOR (AIRS/AFS) Business SIC classification: GENERAL AUTOMOTIVE REPAIR SHOPS
KENNETH HADDEN (1101 E STUART in SOUTH HAVEN, KS)
AIR MINOR (AIRS/AFS) Business SIC classification: GENERAL AUTOMOTIVE REPAIR SHOPS
LARRY KALBFLEISCH GARAGE (HWY 81 & 177 in SOUTH HAVEN, KS)
Conditionally Exempt Small Quantity Generators, less than 100 kg/month of hazardous waste (Resource Conservation and Recovery Act (tracking hazardous waste)) - notification
Housing units lacking complete plumbing facilities: 2.9% Housing units lacking complete kitchen facilities: 3.2%
38.4%Utility gas
33.4%Bottled, tank, or LP gas
14.1%Electricity
9.9%Wood
2.6%Other fuel
2.3%Fuel oil, kerosene, etc.
Population in 1990: 710. Population change in the 1990s: +184 (+25.9%).
Place of birth for U.S.-born residents:
This state: 600
Northeast: 5
Midwest: 38
South: 86
West: 269
66% of the 67140 zip code residents lived in the same house 5 years ago. Out of people who lived in different houses, 55% lived in this county. Out of people who lived in different counties, 50% lived in Kansas.
71% of the 67140 zip code residents lived in the same house 1 year ago. Out of people who lived in different houses, 18% moved from this county. Out of people who lived in different houses, 15% moved from different county within same state. Out of people who lived in different houses, 64% moved from different state.
Private vs. public school enrollment:
Students in private schools in grades 1 to 8 (elementary and middle school):
Here:
0.0%
Kansas:
14.1%
Students in private schools in grades 9 to 12 (high school):
Here:
0.0%
Kansas:
10.8%
Students in private undergraduate colleges: 11
Here:
57.1%
Kansas:
15.4%
Occupation by median earnings in the past 12 months ($)
89,684Management occupations
78,362Installation, maintenance, and repair occupations
56,092Health diagnosing and treating practitioners and other technical occupations
55,923Education, training, and library occupations
52,208Farming, fishing, and forestry occupations
48,467Construction and extraction occupations
Top industries in this zip code by the number of employees in 2005:
Other Services (except Public Administration): General Automotive Repair (5-9 employees: 1 establishment)
Accommodation and Food Services: Full-Service Restaurants (5-9: 1)
Other Services (except Public Administration): Religious Organizations (1-4: 2)
Wholesale Trade: Grain and Field Bean Merchant Wholesalers (1-4: 1)
Finance and Insurance: Commercial Banking (1-4: 1)
Health Care and Social Assistance: Community Food Services (1-4: 1)
Accommodation and Food Services: Hotels (except Casino Hotels) and Motels (1-4: 1)
Fatal accident statistics in 2013:
Fatal accident count: 1
Vehicles involved in fatal accidents: 1
Fatal accidents caused by drunken drivers: 0
Fatalities: 1
Persons involved in fatal accidents: 3
Pedestrians involved in fatal accidents: 0
Fatal accident statistics in 2012:
Fatal accident count: 1
Vehicles involved in fatal accidents: 1
Fatal accidents caused by drunken drivers: 0
Fatalities: 1
Persons involved in fatal accidents: 1
Pedestrians involved in fatal accidents: 0
2002 - 2018 National Fire Incident Reporting System (NFIRS) incidents
Based on the data from the years 2002 - 2018 the average number of fires per year is 10. The highest number of reported fires - 25 took place in 2009, and the least - 0 in 2005. The data has a growing trend.
When looking into fire subcategories, the most incidents belonged to: Outside Fires (64.6%), and Mobile Property/Vehicle Fires (17.4%).
Fire incident types reported to NFIRS in Zip Code 67140

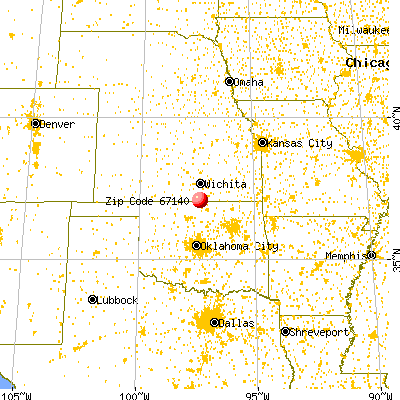


 Nearest zip codes: 74632, 67051, 67152, 67119, 74646, 67022.


 Based on the data from the years 2002 - 2018 the average number of fires per year is 10. The highest number of reported fires - 25 took place in 2009, and the least - 0 in 2005. The data has a growing trend.
 When looking into fire subcategories, the most incidents belonged to: Outside Fires (64.6%), and Mobile Property/Vehicle Fires (17.4%).