Estimated zip code population in 2022: 10,722 Zip code population in 2010: 9,908 Zip code population in 2000: 8,074
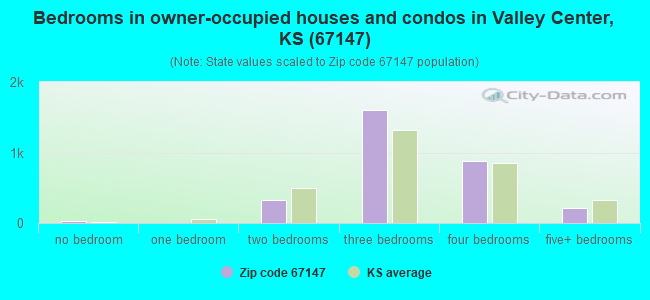
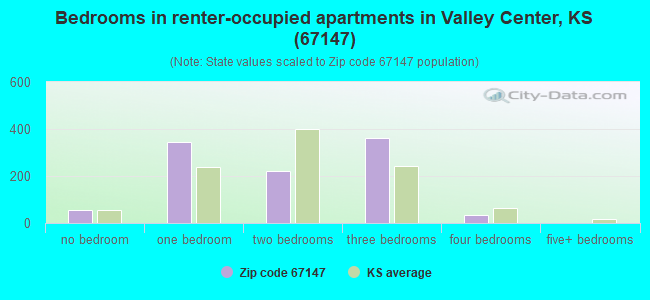
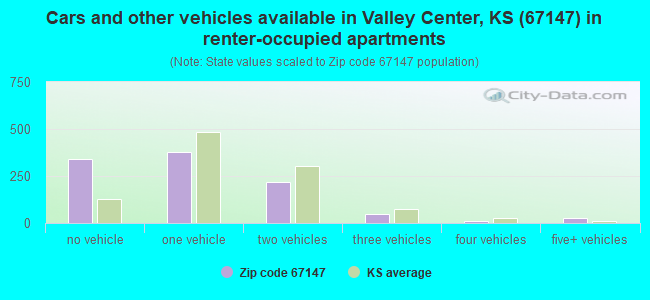
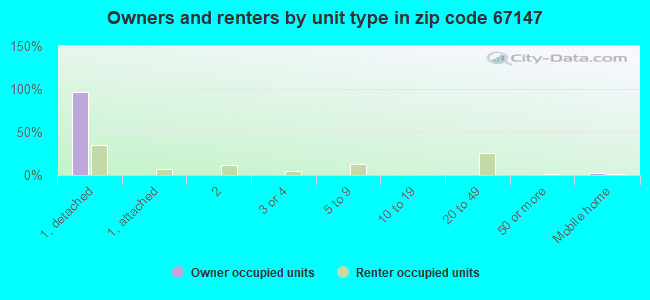
Houses and condos: 4,260 Renter-occupied apartments: 1,010
% of renters here:
25%
State:
32%
March 2022 cost of living index in zip code 67147: 82.2 (low, U.S. average is 100)
Land area: 105.3 sq. mi. Water area: 0.6 sq. mi.
Population density: 102 people per square mile
(very low).
OSM Map
General Map
Google Map
MSN Map
OSM Map
General Map
Google Map
MSN Map
OSM Map
General Map
Google Map
MSN Map
OSM Map
General Map
Google Map
MSN Map
Please wait while loading the map...
Real estate property taxes paid for housing units in 2022:
This zip code:
1.4% ($3,240)
Kansas:
1.2% ($2,578)
Median real estate property taxes paid for housing units with mortgages in 2022: $3,137 (1.5%) Median real estate property taxes paid for housing units with no mortgage in 2022: $3,269 (1.4%)
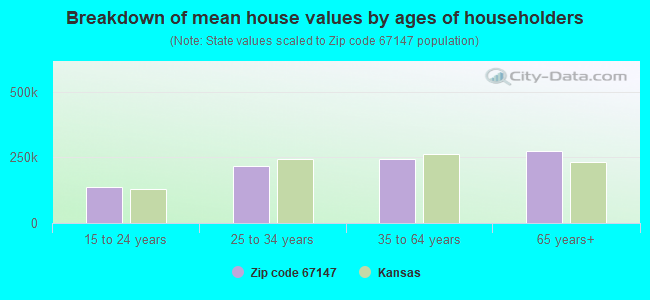
Estimated median house/condo value in 2022: $227,446
67147:
$227,446
Kansas:
$206,600
According to our research of Kansas and other state lists, there were 14 registered sex offenders living in 67147 zip code as of May 14, 2024. The ratio of all residents to sex offenders in zip code 67147 is 707 to 1. The ratio of registered sex offenders to all residents in this zip code is much lower than the state average.
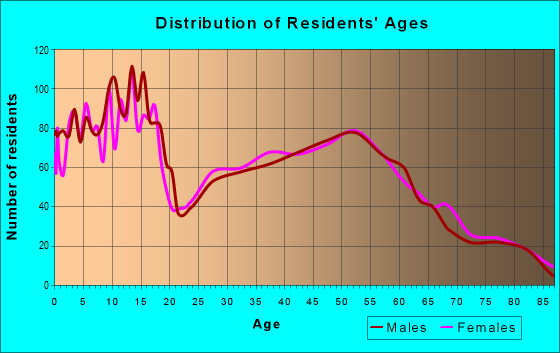
Median resident age:
This zip code:
39.0 years
Kansas median age:
37.6 years
Average household size:
This zip code:
2.6 people
Kansas:
2.4 people
Averages for the 2020 tax year for zip code 67147, filed in 2021:
Average Adjusted Gross Income (AGI) in 2020: $77,982 (Individual Income Tax Returns)
Here:
$77,982
State:
$72,721
Salary/wage: $64,099 (reported on 82.4% of returns)
Here:
$64,099
State:
$58,641
(% of AGI for various income ranges: 1183.5% for AGIs below $25k, 3543.7% for AGIs $25k-50k, 6299.1% for AGIs $50k-75k, 9391.8% for AGIs $75k-100k, 17408.9% for AGIs $100k-200k, 69945.7% for AGIs over 200k)
Taxable interest for individuals: $1,217 (reported on 38.6% of returns)
This zip code:
$1,217
Kansas:
$1,625
(% of AGI for various income ranges: 19.3% for AGIs below $25k, 30.2% for AGIs $25k-50k, 37.6% for AGIs $50k-75k, 96.9% for AGIs $75k-100k, 120.5% for AGIs $100k-200k, 864.3% for AGIs over 200k)
Ordinary dividends: $5,652 (reported on 22.2% of returns)
Here:
$5,652
State:
$7,290
(% of AGI for various income ranges: 28.1% for AGIs below $25k, 26.3% for AGIs $25k-50k, 66.9% for AGIs $50k-75k, 111.8% for AGIs $75k-100k, 248.2% for AGIs $100k-200k, 4894.3% for AGIs over 200k)
Net capital gain/loss in AGI: +$14,343 (reported on 20.3% of returns)
Here:
+$14,343
State:
+$20,511
(% of AGI for various income ranges: 16.9% for AGIs below $25k, 50.0% for AGIs $25k-50k, 92.2% for AGIs $50k-75k, 282.3% for AGIs $75k-100k, 546.7% for AGIs $100k-200k, 12708.6% for AGIs over 200k)
Profit/loss from business: +$13,475 (reported on 15.1% of returns)
Here:
+$13,475
State:
+$13,852
(% of AGI for various income ranges: 75.7% for AGIs below $25k, 127.7% for AGIs $25k-50k, 175.7% for AGIs $50k-75k, 299.0% for AGIs $75k-100k, 655.3% for AGIs $100k-200k, 3454.3% for AGIs over 200k)
Taxable individual retirement arrangement distribution: $18,860 (reported on 12.9% of returns)
67147:
$18,860
Kansas:
$19,921
(% of AGI for various income ranges: 101.0% for AGIs below $25k, 145.1% for AGIs $25k-50k, 266.9% for AGIs $50k-75k, 414.6% for AGIs $75k-100k, 897.8% for AGIs $100k-200k, 2332.9% for AGIs over 200k)
Self-employed (Keogh) retirement plans: $21,100 (reported on 0.4% of returns)
67147:
$21,100
Kansas:
$25,388
(% of AGI for various income ranges: 76.7% for AGIs $100k-200k)
Total itemized deductions: $33,185 (reported on 8.1% of returns)
Here:
$33,185
State:
$36,939
(% of AGI for various income ranges: 97.6% for AGIs below $25k, 118.6% for AGIs $25k-50k, 148.5% for AGIs $50k-75k, 313.6% for AGIs $75k-100k, 829.5% for AGIs $100k-200k, 6478.6% for AGIs over 200k)
Charity contributions: $14,159 (reported on 6.6% of returns)
Here:
$14,159
State:
$15,443
(% of AGI for various income ranges: 17.2% for AGIs $25k-50k, 39.6% for AGIs $50k-75k, 74.1% for AGIs $75k-100k, 282.7% for AGIs $100k-200k, 3334.3% for AGIs over 200k)
Taxes paid: $7,705 (reported on 8.1% of returns)
67147:
$7,705
State:
$8,001
(% of AGI for various income ranges: 5.8% for AGIs below $25k, 14.1% for AGIs $25k-50k, 41.3% for AGIs $50k-75k, 82.1% for AGIs $75k-100k, 222.7% for AGIs $100k-200k, 1531.4% for AGIs over 200k)
Earned income credit: $2,266 (reported on 11.6% of returns)
Here:
$2,266
State:
$2,267
(% of AGI for various income ranges: 68.9% for AGIs below $25k, 79.8% for AGIs $25k-50k, 3.1% for AGIs $50k-75k)
Percentage of individuals using paid preparers for their 2020 taxes: 96.1%
Here:
96%
State:
95%
(% for various income ranges: 96.2% for AGIs below $25k, 96.1% for AGIs $25k-50k, 95.9% for AGIs $50k-75k, 94.7% for AGIs $75k-100k, 96.8% for AGIs $100k-200k, 96.0% for AGIs over 200k)
Averages for the 2012 tax year for zip code 67147, filed in 2013:
Average Adjusted Gross Income (AGI) in 2012: $65,441 (Individual Income Tax Returns)
Here:
$65,441
State:
$60,095
Salary/wage: $53,722 (reported on 86.0% of returns)
Here:
$53,722
State:
$48,770
(% of AGI for various income ranges: 75.7% for AGIs below $25k, 79.3% for AGIs $25k-50k, 78.2% for AGIs $50k-75k, 78.1% for AGIs $75k-100k, 78.9% for AGIs $100k-200k, 43.3% for AGIs over 200k)
Taxable interest for individuals: $1,028 (reported on 41.3% of returns)
This zip code:
$1,028
Kansas:
$1,506
(% of AGI for various income ranges: 1.4% for AGIs below $25k, 0.8% for AGIs $25k-50k, 0.5% for AGIs $50k-75k, 0.4% for AGIs $75k-100k, 0.6% for AGIs $100k-200k, 0.7% for AGIs over 200k)
Ordinary dividends: $3,056 (reported on 22.6% of returns)
Here:
$3,056
State:
$6,093
(% of AGI for various income ranges: 1.2% for AGIs below $25k, 0.6% for AGIs $25k-50k, 0.8% for AGIs $50k-75k, 1.0% for AGIs $75k-100k, 1.0% for AGIs $100k-200k, 1.6% for AGIs over 200k)
Net capital gain/loss in AGI: +$10,496 (reported on 17.6% of returns)
Here:
+$10,496
State:
+$14,598
(% of AGI for various income ranges: 0.4% for AGIs below $25k, 0.7% for AGIs $50k-75k, 0.8% for AGIs $75k-100k, 1.1% for AGIs $100k-200k, 10.1% for AGIs over 200k)
Profit/loss from business: +$13,400 (reported on 16.7% of returns)
Here:
+$13,400
State:
+$12,554
(% of AGI for various income ranges: 4.5% for AGIs below $25k, 2.3% for AGIs $25k-50k, 3.3% for AGIs $50k-75k, 3.0% for AGIs $75k-100k, 2.1% for AGIs $100k-200k, 5.8% for AGIs over 200k)
Taxable individual retirement arrangement distribution: $12,936 (reported on 12.0% of returns)
67147:
$12,936
Kansas:
$14,098
(% of AGI for various income ranges: 3.6% for AGIs below $25k, 2.9% for AGIs $25k-50k, 2.5% for AGIs $50k-75k, 3.0% for AGIs $75k-100k, 3.3% for AGIs $100k-200k)
Self-employment retirement plans: $20,800 (reported on 0.7% of returns)
67147:
$20,800
Kansas:
$19,780
Total itemized deductions: $22,031 (19% of AGI, reported on 39.1% of returns)
Here:
$22,031
State:
$23,678
Here:
19.1% of AGI
State:
18.9% of AGI
(% of AGI for various income ranges: 10.7% for AGIs below $25k, 10.3% for AGIs $25k-50k, 12.0% for AGIs $50k-75k, 14.4% for AGIs $75k-100k, 15.1% for AGIs $100k-200k, 12.6% for AGIs over 200k)
Charity contributions: $5,531 (reported on 33.2% of returns)
Here:
$5,531
State:
$5,321
(% of AGI for various income ranges: 1.1% for AGIs below $25k, 1.4% for AGIs $25k-50k, 1.8% for AGIs $50k-75k, 2.5% for AGIs $75k-100k, 3.1% for AGIs $100k-200k, 4.4% for AGIs over 200k)
Taxes paid: $8,816 (reported on 39.1% of returns)
67147:
$8,816
State:
$9,548
(% of AGI for various income ranges: 2.4% for AGIs below $25k, 2.7% for AGIs $25k-50k, 4.0% for AGIs $50k-75k, 5.5% for AGIs $75k-100k, 6.8% for AGIs $100k-200k, 6.0% for AGIs over 200k)
Earned income credit: $2,116 (reported on 13.8% of returns)
Here:
$2,116
State:
$2,212
(% of AGI for various income ranges: 5.1% for AGIs below $25k, 1.3% for AGIs $25k-50k)
Percentage of individuals using paid preparers for their 2012 taxes: 54.9%
Here:
55%
State:
56%
(% for various income ranges: 48.0% for AGIs below $25k, 52.7% for AGIs $25k-50k, 57.7% for AGIs $50k-75k, 59.3% for AGIs $75k-100k, 61.5% for AGIs $100k-200k, 78.6% for AGIs over 200k)
Averages for the 2004 tax year for zip code 67147, filed in 2005:
Average Adjusted Gross Income (AGI) in 2004: $55,760 (Individual Income Tax Returns)
Here:
$55,760
State:
$45,726
Salary/wage: $44,522 (reported on 86.7% of returns)
Here:
$44,522
State:
$40,112
(% of AGI for various income ranges: 111.8% for AGIs below $10k, 73.4% for AGIs $10k-25k, 81.5% for AGIs $25k-50k, 80.7% for AGIs $50k-75k, 88.0% for AGIs $75k-100k, 50.0% for AGIs over 100k)
Taxable interest for individuals: $1,207 (reported on 51.1% of returns)
This zip code:
$1,207
Kansas:
$1,749
(% of AGI for various income ranges: 7.4% for AGIs below $10k, 2.2% for AGIs $10k-25k, 1.2% for AGIs $25k-50k, 0.8% for AGIs $50k-75k, 1.0% for AGIs $75k-100k, 0.9% for AGIs over 100k)
Taxable dividends: $1,978 (reported on 27.5% of returns)
Here:
$1,978
State:
$3,066
(% of AGI for various income ranges: 3.1% for AGIs below $10k, 1.0% for AGIs $10k-25k, 0.7% for AGIs $25k-50k, 0.7% for AGIs $50k-75k, 0.4% for AGIs $75k-100k, 1.4% for AGIs over 100k)
Net capital gain/loss: +$4,726 (reported on 21.9% of returns)
Here:
+$4,726
State:
+$7,555
(% of AGI for various income ranges: -1.3% for AGIs below $10k, 0.0% for AGIs $10k-25k, 0.5% for AGIs $25k-50k, 0.1% for AGIs $50k-75k, 1.3% for AGIs $75k-100k, 3.7% for AGIs over 100k)
Profit/loss from business: +$9,808 (reported on 18.7% of returns)
Here:
+$9,808
State:
+$9,571
(% of AGI for various income ranges: 4.6% for AGIs below $10k, 6.3% for AGIs $10k-25k, 4.0% for AGIs $25k-50k, 2.5% for AGIs $50k-75k, 1.8% for AGIs $75k-100k, 3.6% for AGIs over 100k)
IRA payment deduction: $2,840 (reported on 3.2% of returns)
67147:
$2,840
Kansas:
$2,922
(% of AGI for various income ranges: 0.1% for AGIs $10k-25k, 0.3% for AGIs $25k-50k, 0.3% for AGIs $50k-75k, 0.2% for AGIs $75k-100k, 0.1% for AGIs over 100k)
Self-employed pension: $16,077 (reported on 0.7% of returns)
Here:
$16,077
Kansas:
$14,209
Total itemized deductions: $16,869 (17% of AGI, reported on 40.1% of returns)
Here:
$16,869
State:
$18,779
Here:
16.9% of AGI
State:
20.5% of AGI
(% of AGI for various income ranges: 15.6% for AGIs below $10k, 11.8% for AGIs $10k-25k, 11.1% for AGIs $25k-50k, 14.1% for AGIs $50k-75k, 15.0% for AGIs $75k-100k, 10.4% for AGIs over 100k)
Charity contributions deductions: $3,835 (4% of AGI, reported on 35.2% of returns)
Here:
$3,835
State:
$3,892
Here:
3.6% of AGI
State:
4.0% of AGI
(% of AGI for various income ranges: 1.3% for AGIs below $10k, 1.6% for AGIs $10k-25k, 1.8% for AGIs $25k-50k, 2.8% for AGIs $50k-75k, 2.8% for AGIs $75k-100k, 2.5% for AGIs over 100k)
Total tax: $8,412 (reported on 77.6% of returns)
67147:
$8,412
State:
$7,203
(% of AGI for various income ranges: 3.4% for AGIs below $10k, 4.2% for AGIs $10k-25k, 6.1% for AGIs $25k-50k, 8.1% for AGIs $50k-75k, 9.7% for AGIs $75k-100k, 17.5% for AGIs over 100k)
Earned income credit: $1,620 (reported on 11.3% of returns)
Here:
$1,620
State:
$1,674
Percentage of individuals using paid preparers for their 2004 taxes: 59.4%
Here:
59%
State:
63%
(% for various income ranges: 46.7% for AGIs below $10k, 61.2% for AGIs $10k-25k, 64.3% for AGIs $25k-50k, 62.7% for AGIs $50k-75k, 57.2% for AGIs $75k-100k, 66.1% for AGIs over 100k)
Household received Food Stamps/SNAP in the past 12 months: 42 Household did not receive Food Stamps/SNAP in the past 12 months: 4,012
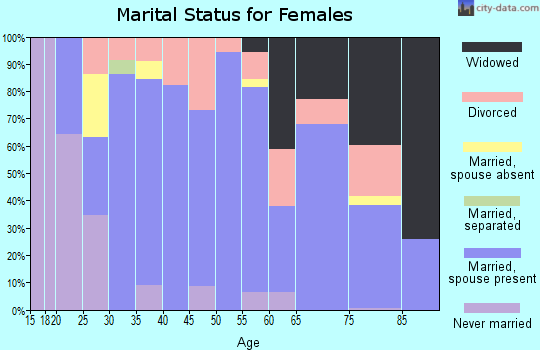
Women who had a birth in the past 12 months: 87 (71 now married, 16 unmarried) Women who did not have a birth in the past 12 months: 1,881 (1,196 now married, 681 unmarried)
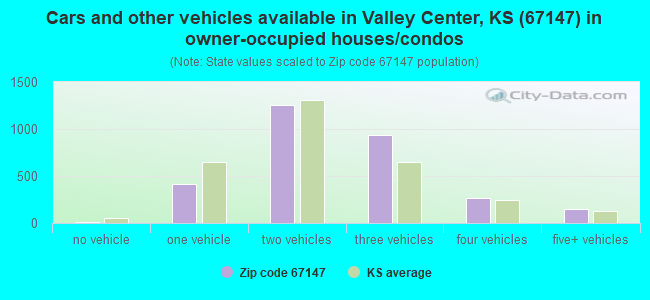
Housing units in zip code 67147 with a mortgage: 1,538 (85 second mortgage, 8 home equity loan, 52 both second mortgage and home equity loan) Median monthly owner costs for units with a mortgage: $1,540 Median monthly owner costs for units without a mortgage: $662
Residents with income below the poverty level in 2022:
This zip code:
2.4%
Whole state:
12.0%
Residents with income below 50% of the poverty level in 2022:
This zip code:
1.0%
Whole state:
6.4%
Median number of rooms in houses and condos:
Here:
6.5
State:
6.9
Median number of rooms in apartments:
Here:
4.6
State:
4.4
Notable locations in this zip code not listed on our city pages
Notable locations in zip code 67147: Valley Center Industrial Park (A), Valley Center Wastewater Treatment Plant (B), Valley Center Police Department (C), Edna Buschow Memorial Library Valley Center (D), Valley Center Fire Department (E), Sedgwick County Fire District 1 Station 32 (F), Valley Center City Hall (G), Valley Center Cultural and Historical Museum (H), New Hope Nursing Home (I), Sedgwick County Emergency Medical Service Post 45 (J). Display/hide their locations on the map
Cemeteries: Green Valley Cemetery (1), Marble Grove Cemetery (2), Park Cemetery (3), Fairview Cemetery (4), Valley Center Cemetery (5), Lorraine Avenue Mennonite Cemetery (6). Display/hide their locations on the map
Streams, rivers, and creeks: Trails View Slough (A), West Fork Chisholm Creek (B), Jester Creek (C), Sand Creek (D), West Wildcat Creek (E). Display/hide their locations on the map
In group quarters: 49 (-1 institutionalized population)
Size of family households: 1,463 2-persons, 343 3-persons, 430 4-persons, 471 5-persons, 94 6-persons, 52 7-or-more-persons
Size of nonfamily households: 1,102 1-person, 59 2-persons
2,576 married couples with children.
481 single-parent households (77 men, 404 women).
98.1% of residents of 67147 zip code speak English at home.
0.9% of residents speak Spanish at home (81% very well, 19% well).
0.4% of residents speak other Indo-European language at home (100% very well).
0.8% of residents speak Asian or Pacific Island language at home (22% very well, 21% well, 45% not well, 12% not at all).
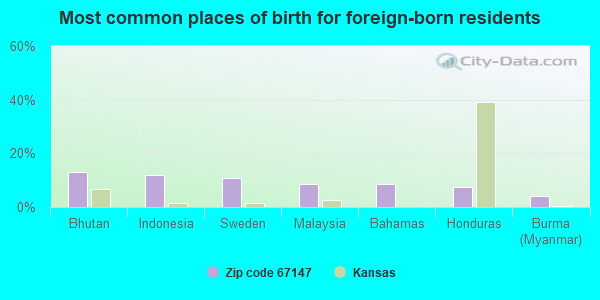
Foreign born population: 220 (2.1%) (46.7% of them are naturalized citizens)
This zip code:
2.1%
Whole state:
7.1%
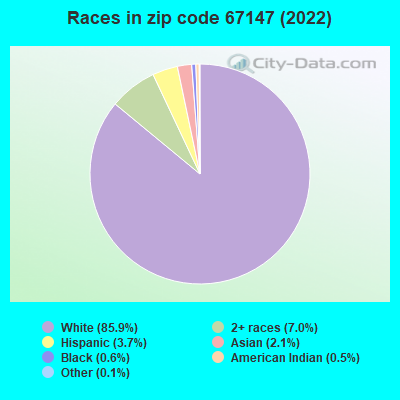
13%Bhutan
12%Indonesia
11%Sweden
8%Malaysia
8%Bahamas
8%Honduras
4%Burma (Myanmar)
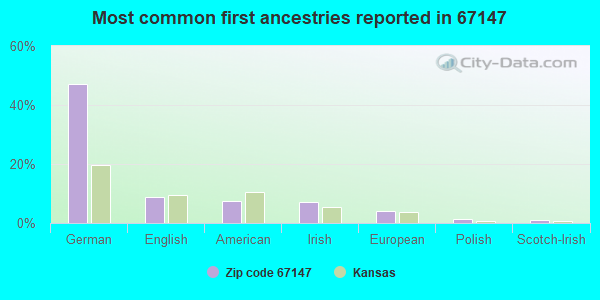
47%German
9%English
8%American
7%Irish
4%European
1%Polish
1%Scotch-Irish
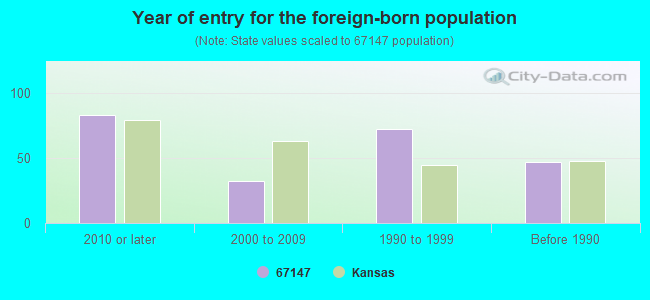
Year of entry for the foreign-born population
832010 or later
322000 to 2009
721990 to 1999
47Before 1990
Major facilities with environmental interests located in this zip code:
BARTON SOLVENTS, INC. WICHITA (201 S. CEDAR in VALLEY CENTER, KS)
AIR SYNTHETIC MINOR (AIRS/AFS) STATE MASTER (Kansas Facility Profiler) - ISL-C208700013, STATE CLEANUP SITE, TANKS-40946, UNDERGROUND STORAGE TANK PROGRAM, ISTEPS-17300184, AIR MINOR, RTK-SG01107, EPCRA CRITERIA AND HAZARDOUS AIR POLLUTANT INVENTORY (Inventory of air pollution sources) HAZARDOUS WASTE BIENNIAL REPORTER (Resource Conservation and Recovery Act (tracking hazardous waste)) Large Quantity Generators, more that 1000 kg of hazardous waste/month (Resource Conservation and Recovery Act (tracking hazardous waste)) - notification TRANSPORTER (Resource Conservation and Recovery Act (tracking hazardous waste)) - notification TRI REPORTER (Tracking of toxic chemicals releasing facilities) Business SIC classification: CHEMICALS AND ALLIED PRODUCTS Business NAICS classification: OTHER CHEMICAL AND ALLIED PRODUCTS WHOLESALERS. Organizations: BARTON SOLVENTS INC, JOHN F JABLONSKI (CONTACT/OPERATOR)
, BARTON SOLVENTS INC (CONTACT/OWNER)
Alternative names: BARTON SOLVENTS INC. WICHITA BRANCH
WASTE MANAGEMENT INCORPORATED (8808 NORTH 127TH STREET EAST in VALLEY CENTER, KS)
SUPERFUND (Superfund database) (Integrated Compliance Information System) - ICIS-07-1985-0298, FORMAL ENFORCEMENT ACTION, ICIS-07-1993-0360, STATE MASTER (Kansas Facility Profiler) - ISL-C208700054, STATE CLEANUP SITE Conditionally Exempt Small Quantity Generators, less than 100 kg/month of hazardous waste (Resource Conservation and Recovery Act (tracking hazardous waste)) - notification HAZARDOUS WASTE BIENNIAL REPORTER (Resource Conservation and Recovery Act (tracking hazardous waste)) TSD (Resource Conservation and Recovery Act (tracking hazardous waste)) - notification Organizations: CHEMICAL WASTE MANAGEMENT INC (CONTACT/OPERATOR)
, CHEMICAL WASTE MGMT INC (CONTACT/OWNER)
Alternative names: (NIES), CHEMICAL WASTE MANAGEMENT INCORPORATED, CHEMICAL WASTE MANAGEMENT OF KANSAS, CHEMICAL WASTE MANAGEMENT OF KS (FINDS), KIES, KANSAS INDUSTRIAL ENVIRONMENTAL SERVICES, NATIONAL INDUSTRIAL ENVIRON SERV, NIES SS#07M9
MAGELLAN PIPELINE COMPANY, L.P. (7452 NORTH MERIDIAN STREET in VALLEY CENTER, KS)
AIR SYNTHETIC MINOR (AIRS/AFS) STATE MASTER (Kansas Facility Profiler) - ISTEPS-17300141, AIR MINOR, TANKS-23829, UNDERGROUND STORAGE TANK PROGRAM, TANKS-42251, ISL-C208700546, STATE CLEANUP SITE, WWT-I-LA16-PO02, WASTEWATER FACILITY, ISL-C208703008, STATE CLEANUP SITE, RTK-SG01361, EPCRA CRITERIA AND HAZARDOUS AIR POLLUTANT INVENTORY (Inventory of air pollution sources) Conditionally Exempt Small Quantity Generators, less than 100 kg/month of hazardous waste (Resource Conservation and Recovery Act (tracking hazardous waste)) - notification Business SIC and NAICS classification: PETROLEUM BULK STATIONS AND TERMINALS Organizations: CENTER TERMINAL COMPANY, MAGELLAN PIPELINE CO LP (CONTACT/OPERATOR)
, AMOCO OIL COMPANY (CONTACT/OWNER)
, CHASE TRANSPORTATION COMPANY (OWNER/OPERATOR)
, AMOCO OIL COMPANY (OWNER/OPERATOR)
Alternative names: (ASSOCIATED WITH SKELLY PIPELINE SPILL), AMOCO OIL CO, CENTER TERMINAL COMPANY WICHITA, MAGELLAN PIPELINE COMPANY, LP, SKELLY PIPELINE SPILL (FORMER)
KANSAS COLISEUM (1229 EAST 85TH STREET NORTH in VALLEY CENTER, KS)
AIR MINOR (AIRS/AFS) STATE MASTER (Kansas Facility Profiler) - TANKS-09101, UNDERGROUND STORAGE TANK PROGRAM (Resource Conservation and Recovery Act (tracking hazardous waste)) Business SIC classification: AMUSEMENT AND RECREATION SERVICES Organizations: SEDGWICK CO FLEET MGMT (OWNER/OPERATOR)
ANDALE FARMERS COOPERATIVE CO. (101 S ASH ST in VALLEY CENTER, KS)
AIR MINOR (AIRS/AFS) STATE MASTER (Kansas Facility Profiler) - ISTEPS-17300071, AIR PROGRAM Business SIC classification: GRAIN AND FIELD BEANS Business NAICS classification: GRAIN AND FIELD BEAN WHOLESALERS.
VALLEY CENTER HIGH SCHOOL AUTO MECH (800 N MERIDIAN in VALLEY CENTER, KS)
(National Center for Education Statistics) - STATE ID-1986 Conditionally Exempt Small Quantity Generators, less than 100 kg/month of hazardous waste (Resource Conservation and Recovery Act (tracking hazardous waste)) Business NAICS classification: GENERAL AUTOMOTIVE REPAIR. Organizations: DEAN SCHULZ (CONTACT/OPERATOR)
, USD 262 (CONTACT/OWNER)
, VALLEY CENTER PUB SCH (SCHOOL DISTRICT)
Alternative names: VALLEY CENTER HS AUTO MECH
JAYHAWK PIPELINE L.L.C. (6559 NORTH MERIDIAN in VALLEY CENTER, KS)
AIR MINOR (AIRS/AFS) STATE MASTER (Kansas Facility Profiler) - ISTEPS-17300120, AIR PROGRAM Business SIC classification: SPECIAL WAREHOUSING AND STORAGE Business NAICS classification: OTHER WAREHOUSING AND STORAGE. Alternative names: JAYHAWK PIPELINE LLC
LANSDOWNE EQUIP CO INC (11402 N BROADWAY STREET in VALLEY CENTER, KS)
STATE MASTER (Kansas Facility Profiler) - TANKS-16912, UNDERGROUND STORAGE TANK PROGRAM Conditionally Exempt Small Quantity Generators, less than 100 kg/month of hazardous waste (Resource Conservation and Recovery Act (tracking hazardous waste)) Organizations: JOHN L ROGERS (CONTACT/OPERATOR)
, WHITLEY LAND CO LLC (CONTACT/OWNER)
Alternative names: DITCH WITCH OF KANSAS
VALLEY CENTER WWWTP (510 SOUTH SHERIDAN in VALLEY CENTER, KS)
National Pollutant Discharge Elimination System NON-MAJOR (Tracking pollutant discharge elimination systems) - permit - ICIS-, ENFORCEMENT/COMPLIANCE ACTIVITY Business SIC classification: SEWERAGE SYSTEMS Organizations: VALLEY CANTER, CITY OF (CONTACT/OWNER)
Alternative names: VALLEY CENTER CITY OF WWTF, VALLEY CENTER WASTE WATER TREATMENT FACILITY, VALLEY CENTER WWTP
EQUILON PIPELINE CO., LLC (1901 E 77TH ST N in VALLEY CENTER, KS)
AIR MINOR (AIRS/AFS) STATE MASTER (Kansas Facility Profiler) - ISTEPS-17300122, AIR PROGRAM Business SIC classification: SPECIAL WAREHOUSING AND STORAGE Business NAICS classification: OTHER WAREHOUSING AND STORAGE.
ABILENE ELEMENTARY SCHOOL (522 N ABILENE in VALLEY CENTER, KS)
(Geographic Names Information System) (National Center for Education Statistics) - STATE ID-1980 Organizations: VALLEY CENTER PUB SCH (SCHOOL DISTRICT)
ANDALE FARMERS COOP-FURLEY (10745 AVENUE F in VALLEY CENTER, KS)
STATE MASTER (Kansas Facility Profiler) - ISTEPS-17300060, AIR PROGRAM, RTK-SG01184, EPCRA, ISL-C208770117, STATE CLEANUP SITE COMPLIANCE ACTIVITY (Tracking inspections of insecticide, fungicide, and rodenticide, and toxic substances) Business SIC classification: GRAIN AND FIELD BEANS Organizations: ANDALE FARMERS COOP CO
VALLEY CENTER MIDDLE SCHOOL (737 N MERIDIAN in VALLEY CENTER, KS)
(National Center for Education Statistics) - STATE ID-1985 Organizations: VALLEY CENTER PUB SCH (SCHOOL DISTRICT)
Housing units lacking complete plumbing facilities: 0.5% Housing units lacking complete kitchen facilities: 1.4%
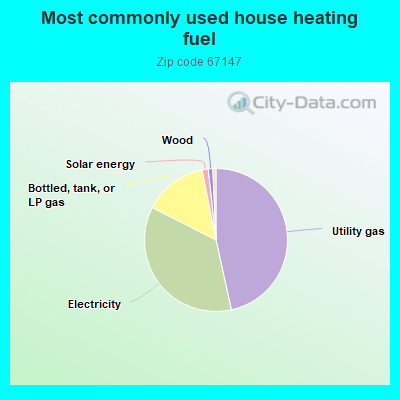
46.5%Utility gas
35.9%Electricity
14.4%Bottled, tank, or LP gas
1.4%Solar energy
1.0%Wood
0.7%Fuel oil, kerosene, etc.
Population in 1990: 1,146. Population change in the 1990s: +6,928 (+604.5%).
Place of birth for U.S.-born residents:
This state: 8,112
Northeast: 116
Midwest: 845
South: 891
West: 525
56% of the 67147 zip code residents lived in the same house 5 years ago. Out of people who lived in different houses, 76% lived in this county. Out of people who lived in different counties, 50% lived in Kansas.
93% of the 67147 zip code residents lived in the same house 1 year ago. Out of people who lived in different houses, 57% moved from this county. Out of people who lived in different houses, 31% moved from different county within same state. Out of people who lived in different houses, 15% moved from different state.
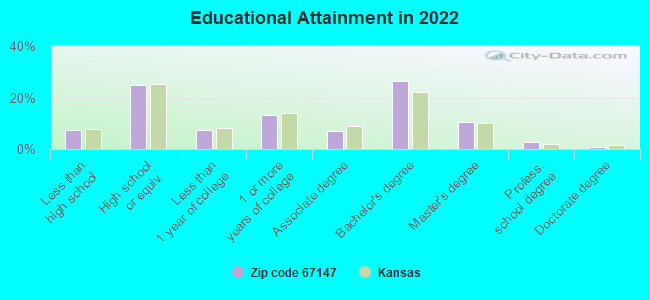
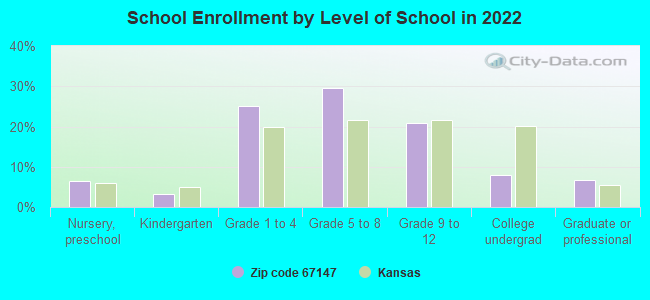
Private vs. public school enrollment:
Students in private schools in grades 1 to 8 (elementary and middle school): 182
Here:
11.9%
Kansas:
14.1%
Students in private schools in grades 9 to 12 (high school): 38
Here:
6.5%
Kansas:
10.8%
Students in private undergraduate colleges: 46
Here:
20.6%
Kansas:
15.4%
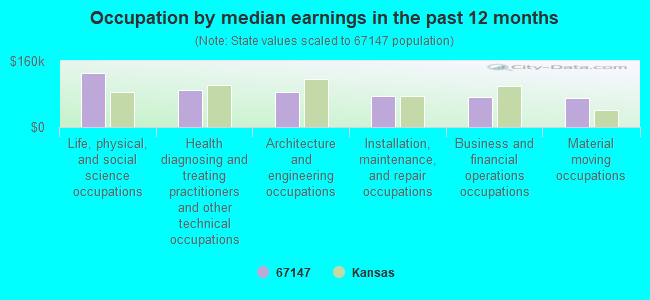
Occupation by median earnings in the past 12 months ($)
131,750Life, physical, and social science occupations
90,874Health diagnosing and treating practitioners and other technical occupations
83,886Architecture and engineering occupations
74,289Installation, maintenance, and repair occupations
72,397Business and financial operations occupations
69,221Material moving occupations
Companies with federal contracts located in this zip code:
HITEK, INC (9 HIGHPOINT ROAD in VALLEY CENTER, KS; small business) : $250,865 in 8 contractsfrom 2000 to 2005
Contracts for Electrical Control Equipment by Defense Logistics Agency Signed by year:2000: $53,880; 2001: $29,634; 2002: $0; 2003: $26,940; 2004: $89,800; 2005: $50,611; 2006: $0.
Biggest contracts:
$44,900 with Defense Logistics Agency for Electrical Control Equipment. Signed on 2004-08-30. Completion date: 2004-11-28.
$44,900, same as above.Signed on 2004-07-16. Completion date: 2004-10-14.
$29,634, same as above.Signed on 2001-11-16. Completion date: 2002-02-14.
$28,736, same as above.Signed on 2005-07-11. Completion date: 2005-10-29.
PROFESSIONAL MACHINE & TOOL, I (500 E 5TH ST in VALLEY CENTER, KS; small business) : $78,405 in 9 contractsfrom 2001 to 2006
Contracts for Switches, Engine Electrical System Components, Aircraft Prime Moving by Defense Logistics Agency Signed by year:2000: $0; 2001: $39,036; 2002: $0; 2003: $0; 2004: $0; 2005: $32,701; 2006: $6,668.
Biggest contracts:
$39,036 with Defense Logistics Agency for Switches. Signed on 2001-09-21. Completion date: 2002-02-18.
$9,669 with Defense Logistics Agency for Engine Electrical System Components, Aircraft Prime Moving. Signed on 2005-10-21. Completion date: 2006-02-21.
$7,095 with Defense Logistics Agency for Switches. Signed on 2005-09-30. Completion date: 2005-12-28.
$5,913, same as above.Signed on 2005-06-16. Completion date: 2005-09-17.
SUPERIOR LIFTS, INC (505 W CLAY ST in VALLEY CENTER, KS; small business) : $30,158 in 2 contractsfrom 2002 to 2003
$16,425 with Army for Motor Vehicle Maintenance and Repair Shop Specialized Equipment. Signed on 2002-08-14. Completion date: 2002-10-31.
$13,733 with Army for Installation of Equipment -- Maintenance and Repair Shop Equipment. Signed on 2003-04-09. Completion date: 2003-06-01.
Top industries in this zip code by the number of employees in 2005:
Health Care and Social Assistance: Home Health Care Services (250-499 employees: 1 establishment)
Arts, Entertainment, and Recreation: Racetracks (50-99: 1)
Arts, Entertainment, and Recreation: Promoters of Performing Arts, Sports, and Similar Events with Facilities (50-99: 1)
Construction: Masonry Contractors (50-99: 1)
People in group quarters in 2010:
4 people in residential treatment centers for juveniles (non-correctional)
2 people in workers' group living quarters and job corps centers
People in group quarters in 2000:
88 people in other nonhousehold living situations
Fatal accident statistics in 2014:
Fatal accident count: 1
Vehicles involved in fatal accidents: 1
Fatal accidents caused by drunken drivers: 1
Fatalities: 1
Persons involved in fatal accidents: 1
Pedestrians involved in fatal accidents: 0
Fatal accident statistics in 2012:
Fatal accident count: 2
Vehicles involved in fatal accidents: 4
Fatal accidents caused by drunken drivers: 1
Fatalities: 2
Persons involved in fatal accidents: 8
Pedestrians involved in fatal accidents: 0
Home Mortgage Disclosure Act Aggregated Statistics For Year 2009 (Based on 6 partial tracts)
A) FHA, FSA/RHS & VA Home Purchase Loans
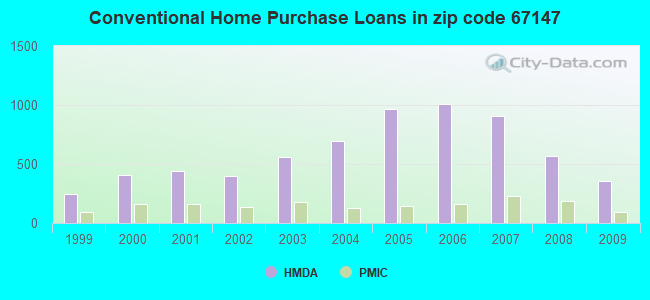
B) Conventional Home Purchase Loans
C) Refinancings
D) Home Improvement Loans
F) Non-occupant Loans on < 5 Family Dwellings (A B C & D)
G) Loans On Manufactured Home Dwelling (A B C & D)
Number
Average Value
Number
Average Value
Number
Average Value
Number
Average Value
Number
Average Value
Number
Average Value
LOANS ORIGINATED
257
$156,164
358
$193,435
1,052
$171,025
98
$38,635
47
$153,772
9
$78,770
APPLICATIONS APPROVED, NOT ACCEPTED
6
$172,223
40
$172,954
82
$156,933
7
$34,429
2
$90,415
6
$57,527
APPLICATIONS DENIED
43
$127,110
50
$169,174
247
$171,072
61
$39,769
7
$107,841
16
$58,669
APPLICATIONS WITHDRAWN
29
$148,684
30
$197,575
176
$175,014
15
$52,546
10
$146,584
1
$87,490
FILES CLOSED FOR INCOMPLETENESS
8
$114,874
7
$160,399
32
$222,693
6
$14,820
1
$73,280
2
$30,805
Aggregated Statistics For Year 2008 (Based on 6 partial tracts)
A) FHA, FSA/RHS & VA Home Purchase Loans
B) Conventional Home Purchase Loans
C) Refinancings
D) Home Improvement Loans
E) Loans on Dwellings For 5+ Families
F) Non-occupant Loans on < 5 Family Dwellings (A B C & D)
G) Loans On Manufactured Home Dwelling (A B C & D)
Number
Average Value
Number
Average Value
Number
Average Value
Number
Average Value
Number
Average Value
Number
Average Value
Number
Average Value
LOANS ORIGINATED
173
$151,166
569
$182,104
532
$169,202
130
$48,830
4
$1,533,035
82
$127,404
22
$61,109
APPLICATIONS APPROVED, NOT ACCEPTED
5
$126,178
53
$169,034
59
$166,980
16
$30,264
0
$0
2
$94,225
7
$58,914
APPLICATIONS DENIED
20
$130,132
48
$146,358
241
$152,354
89
$45,313
1
$5,056,320
14
$169,422
14
$38,506
APPLICATIONS WITHDRAWN
16
$119,956
49
$162,883
120
$184,259
12
$88,362
1
$9,596,020
10
$114,262
3
$47,743
FILES CLOSED FOR INCOMPLETENESS
4
$110,028
6
$131,648
23
$200,477
5
$57,656
0
$0
0
$0
1
$52,030
Aggregated Statistics For Year 2007 (Based on 6 partial tracts)
A) FHA, FSA/RHS & VA Home Purchase Loans
B) Conventional Home Purchase Loans
C) Refinancings
D) Home Improvement Loans
F) Non-occupant Loans on < 5 Family Dwellings (A B C & D)
G) Loans On Manufactured Home Dwelling (A B C & D)
Number
Average Value
Number
Average Value
Number
Average Value
Number
Average Value
Number
Average Value
Number
Average Value
LOANS ORIGINATED
103
$136,112
903
$154,848
444
$129,561
129
$44,093
77
$116,503
16
$75,785
APPLICATIONS APPROVED, NOT ACCEPTED
4
$143,812
90
$171,715
80
$144,236
19
$107,278
6
$94,262
8
$68,400
APPLICATIONS DENIED
19
$114,836
103
$125,946
316
$141,988
98
$51,221
14
$108,916
31
$82,057
APPLICATIONS WITHDRAWN
8
$100,819
52
$146,932
138
$136,192
20
$79,384
8
$149,201
4
$75,100
FILES CLOSED FOR INCOMPLETENESS
0
$0
7
$230,080
37
$168,644
6
$53,725
1
$102,760
1
$166,980
Aggregated Statistics For Year 2006 (Based on 6 partial tracts)
A) FHA, FSA/RHS & VA Home Purchase Loans
B) Conventional Home Purchase Loans
C) Refinancings
D) Home Improvement Loans
E) Loans on Dwellings For 5+ Families
F) Non-occupant Loans on < 5 Family Dwellings (A B C & D)
G) Loans On Manufactured Home Dwelling (A B C & D)
Number
Average Value
Number
Average Value
Number
Average Value
Number
Average Value
Number
Average Value
Number
Average Value
Number
Average Value
LOANS ORIGINATED
100
$129,656
1,011
$146,117
506
$125,352
155
$47,935
1
$439,680
114
$99,383
26
$61,729
APPLICATIONS APPROVED, NOT ACCEPTED
4
$130,185
91
$146,810
97
$115,919
20
$53,503
0
$0
7
$81,689
9
$54,357
APPLICATIONS DENIED
5
$133,910
106
$115,957
333
$131,562
78
$52,853
0
$0
18
$101,561
21
$45,197
APPLICATIONS WITHDRAWN
7
$112,923
54
$127,421
221
$132,351
14
$90,460
0
$0
8
$116,254
3
$74,213
FILES CLOSED FOR INCOMPLETENESS
1
$150,120
12
$110,908
54
$142,534
2
$21,620
0
$0
3
$177,910
0
$0
Aggregated Statistics For Year 2005 (Based on 6 partial tracts)
A) FHA, FSA/RHS & VA Home Purchase Loans
B) Conventional Home Purchase Loans
C) Refinancings
D) Home Improvement Loans
E) Loans on Dwellings For 5+ Families
F) Non-occupant Loans on < 5 Family Dwellings (A B C & D)
G) Loans On Manufactured Home Dwelling (A B C & D)
Number
Average Value
Number
Average Value
Number
Average Value
Number
Average Value
Number
Average Value
Number
Average Value
Number
Average Value
LOANS ORIGINATED
96
$137,935
965
$136,586
512
$116,300
139
$32,945
2
$690,385
91
$84,069
22
$56,431
APPLICATIONS APPROVED, NOT ACCEPTED
4
$89,568
91
$130,582
93
$145,048
15
$28,297
0
$0
4
$222,052
14
$52,504
APPLICATIONS DENIED
4
$112,922
96
$122,198
364
$112,993
54
$37,495
0
$0
23
$81,074
29
$52,580
APPLICATIONS WITHDRAWN
6
$108,420
86
$122,218
255
$132,941
23
$129,428
0
$0
12
$130,598
8
$73,031
FILES CLOSED FOR INCOMPLETENESS
1
$93,800
23
$113,438
59
$125,245
1
$40,300
0
$0
3
$80,400
1
$87,060
Aggregated Statistics For Year 2004 (Based on 6 partial tracts)
A) FHA, FSA/RHS & VA Home Purchase Loans
B) Conventional Home Purchase Loans
C) Refinancings
D) Home Improvement Loans
F) Non-occupant Loans on < 5 Family Dwellings (A B C & D)
G) Loans On Manufactured Home Dwelling (A B C & D)
Number
Average Value
Number
Average Value
Number
Average Value
Number
Average Value
Number
Average Value
Number
Average Value
LOANS ORIGINATED
90
$112,980
693
$129,870
637
$112,891
125
$34,830
66
$65,444
16
$61,676
APPLICATIONS APPROVED, NOT ACCEPTED
4
$121,365
80
$138,912
103
$111,861
14
$29,903
10
$70,796
10
$46,446
APPLICATIONS DENIED
6
$92,200
92
$114,569
319
$113,769
71
$35,219
10
$74,080
34
$50,939
APPLICATIONS WITHDRAWN
3
$80,883
46
$125,809
169
$120,301
14
$40,851
5
$76,342
3
$59,467
FILES CLOSED FOR INCOMPLETENESS
0
$0
10
$93,449
58
$126,446
4
$19,120
4
$79,178
0
$0
Aggregated Statistics For Year 2003 (Based on 6 partial tracts)
A) FHA, FSA/RHS & VA Home Purchase Loans
B) Conventional Home Purchase Loans
C) Refinancings
D) Home Improvement Loans
E) Loans on Dwellings For 5+ Families
F) Non-occupant Loans on < 5 Family Dwellings (A B C & D)
Number
Average Value
Number
Average Value
Number
Average Value
Number
Average Value
Number
Average Value
Number
Average Value
LOANS ORIGINATED
85
$114,584
562
$130,594
1,399
$114,982
116
$18,082
1
$530,920
46
$72,624
APPLICATIONS APPROVED, NOT ACCEPTED
4
$103,185
47
$153,764
120
$107,776
8
$19,778
0
$0
8
$64,711
APPLICATIONS DENIED
3
$67,360
65
$83,306
268
$104,096
35
$11,034
0
$0
10
$66,848
APPLICATIONS WITHDRAWN
4
$113,520
36
$144,213
189
$113,226
8
$36,278
0
$0
3
$91,563
FILES CLOSED FOR INCOMPLETENESS
6
$117,705
9
$109,070
39
$105,007
4
$38,542
0
$0
2
$47,925
Aggregated Statistics For Year 2002 (Based on 6 partial tracts)
A) FHA, FSA/RHS & VA Home Purchase Loans
B) Conventional Home Purchase Loans
C) Refinancings
D) Home Improvement Loans
E) Loans on Dwellings For 5+ Families
F) Non-occupant Loans on < 5 Family Dwellings (A B C & D)
Number
Average Value
Number
Average Value
Number
Average Value
Number
Average Value
Number
Average Value
Number
Average Value
LOANS ORIGINATED
78
$106,319
401
$117,183
869
$114,726
117
$18,564
1
$553,260
54
$64,290
APPLICATIONS APPROVED, NOT ACCEPTED
7
$113,263
49
$103,921
108
$108,392
18
$20,530
0
$0
5
$49,952
APPLICATIONS DENIED
7
$95,479
73
$90,843
203
$101,543
54
$17,762
0
$0
4
$69,430
APPLICATIONS WITHDRAWN
4
$79,292
27
$124,046
125
$101,434
6
$41,258
0
$0
6
$72,113
FILES CLOSED FOR INCOMPLETENESS
3
$88,673
10
$64,098
35
$114,136
3
$71,360
0
$0
1
$45,670
Aggregated Statistics For Year 2001 (Based on 6 partial tracts)
A) FHA, FSA/RHS & VA Home Purchase Loans
B) Conventional Home Purchase Loans
C) Refinancings
D) Home Improvement Loans
E) Loans on Dwellings For 5+ Families
F) Non-occupant Loans on < 5 Family Dwellings (A B C & D)
Number
Average Value
Number
Average Value
Number
Average Value
Number
Average Value
Number
Average Value
Number
Average Value
LOANS ORIGINATED
96
$97,149
442
$115,045
684
$99,381
162
$22,055
1
$508,560
40
$65,487
APPLICATIONS APPROVED, NOT ACCEPTED
2
$104,005
63
$83,757
81
$90,379
18
$14,976
0
$0
3
$79,057
APPLICATIONS DENIED
7
$85,681
69
$62,481
157
$76,453
45
$13,520
0
$0
6
$75,337
APPLICATIONS WITHDRAWN
3
$146,070
39
$108,549
143
$98,901
17
$18,983
0
$0
6
$76,845
FILES CLOSED FOR INCOMPLETENESS
2
$97,130
10
$90,985
29
$102,461
2
$17,915
0
$0
1
$81,730
Aggregated Statistics For Year 2000 (Based on 6 partial tracts)
A) FHA, FSA/RHS & VA Home Purchase Loans
B) Conventional Home Purchase Loans
C) Refinancings
D) Home Improvement Loans
F) Non-occupant Loans on < 5 Family Dwellings (A B C & D)
Number
Average Value
Number
Average Value
Number
Average Value
Number
Average Value
Number
Average Value
LOANS ORIGINATED
86
$89,817
409
$111,781
219
$86,615
123
$14,601
37
$59,990
APPLICATIONS APPROVED, NOT ACCEPTED
9
$66,682
55
$79,771
34
$91,279
27
$21,565
3
$50,300
APPLICATIONS DENIED
8
$74,716
99
$50,937
131
$62,279
42
$15,528
14
$51,836
APPLICATIONS WITHDRAWN
6
$90,173
24
$99,494
99
$67,230
9
$34,101
3
$47,210
FILES CLOSED FOR INCOMPLETENESS
1
$77,980
5
$72,578
15
$65,889
1
$9,990
0
$0
Aggregated Statistics For Year 1999 (Based on 3 partial tracts)
A) FHA, FSA/RHS & VA Home Purchase Loans
B) Conventional Home Purchase Loans
C) Refinancings
D) Home Improvement Loans
F) Non-occupant Loans on < 5 Family Dwellings (A B C & D)
2002 - 2018 National Fire Incident Reporting System (NFIRS) incidents
Based on the data from the years 2002 - 2018 the average number of fires per year is 95. The highest number of reported fires - 126 took place in 2006, and the least - 54 in 2010. The data has a dropping trend.
When looking into fire subcategories, the most incidents belonged to: Outside Fires (69.2%), and Structure Fires (16.4%).
Fire incident types reported to NFIRS in Zip Code 67147
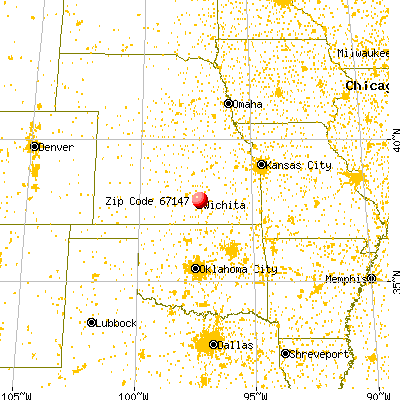


 Nearest zip codes: 67067, 67219, 67204, 67220, 67226, 67055.


 Based on the data from the years 2002 - 2018 the average number of fires per year is 95. The highest number of reported fires - 126 took place in 2006, and the least - 54 in 2010. The data has a dropping trend.
 When looking into fire subcategories, the most incidents belonged to: Outside Fires (69.2%), and Structure Fires (16.4%).