Estimated zip code population in 2022: 1,408 Zip code population in 2010: 1,538 Zip code population in 2000: 1,682
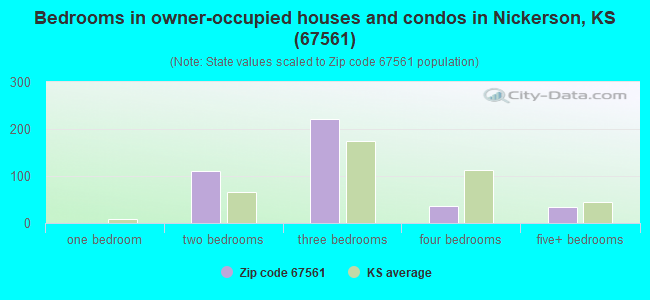
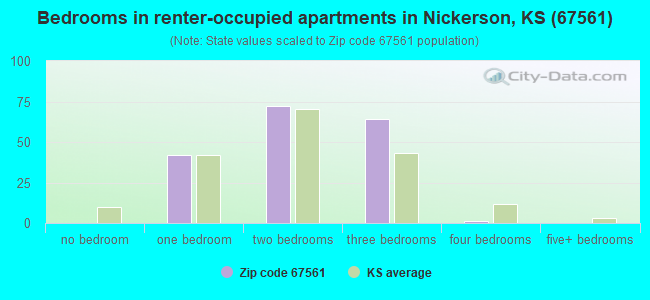
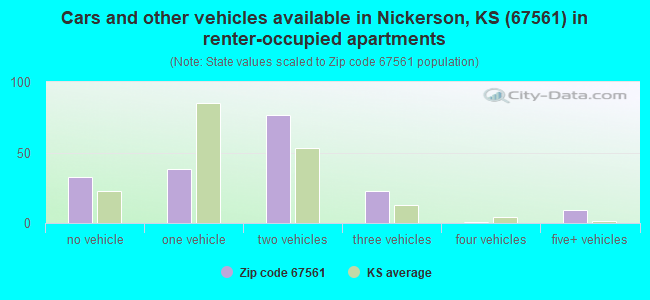
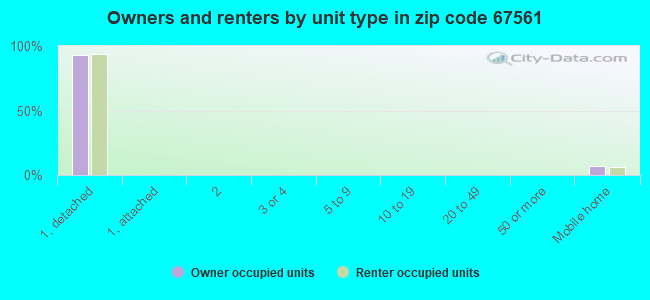
Houses and condos: 707 Renter-occupied apartments: 179
% of renters here:
31%
State:
32%
March 2022 cost of living index in zip code 67561: 78.3 (low, U.S. average is 100)
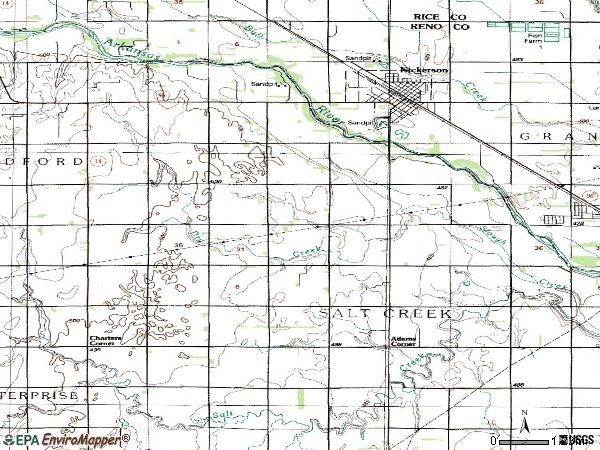
Land area: 65.0 sq. mi. Water area: 0.6 sq. mi.
Population density: 22 people per square mile
(very low).
OSM Map
General Map
Google Map
MSN Map
OSM Map
General Map
Google Map
MSN Map
OSM Map
General Map
Google Map
MSN Map
OSM Map
General Map
Google Map
MSN Map
Please wait while loading the map...
Real estate property taxes paid for housing units in 2022:
This zip code:
1.7% ($1,425)
Kansas:
1.2% ($2,578)
Median real estate property taxes paid for housing units with mortgages in 2022: $1,470 (1.7%) Median real estate property taxes paid for housing units with no mortgage in 2022: $1,363 (1.7%)
Business Search- 14 Million verified businesses
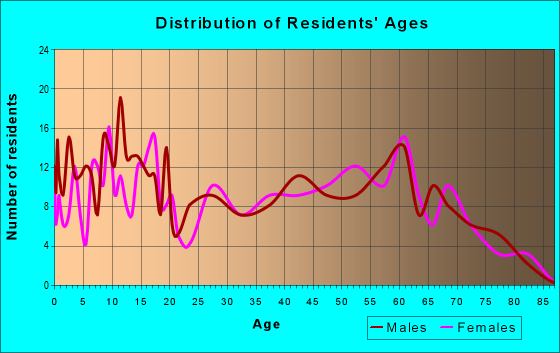
Males: 769
(54.6%)
Females: 639
(45.4%)
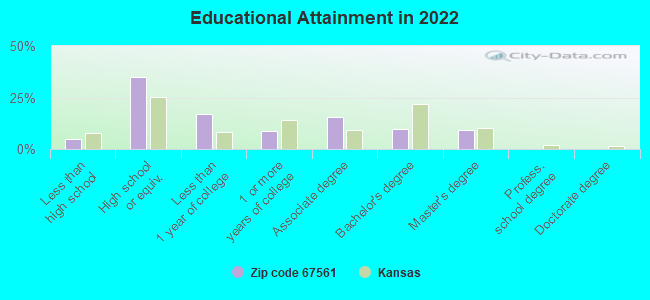
For population 25 years and over in 67561:
High school or higher: 94.5%
Bachelor's degree or higher: 19.0%
Graduate or professional degree: 9.2%
Unemployed: 5.1%
Mean travel time to work (commute): 30.3 minutes
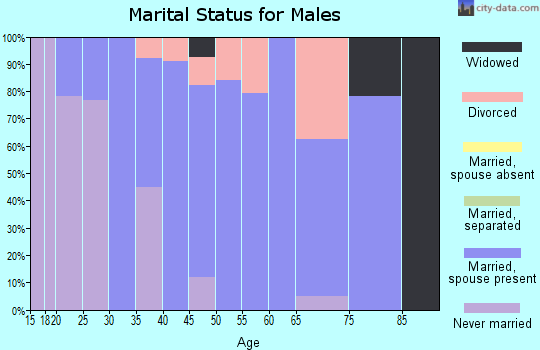
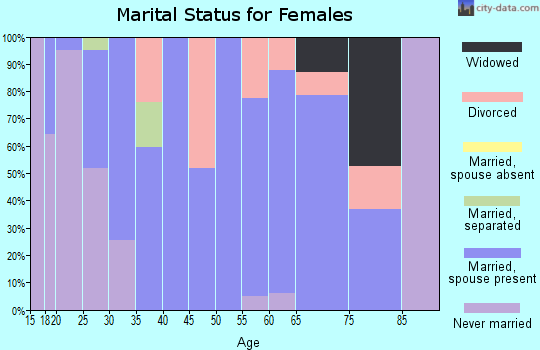
For population 15 years and over in 67561:
Never married: 22.8%
Now married: 56.6%
Separated: 0.3%
Widowed: 4.4%
Divorced: 16.0%
Zip code 67561 compared to state average:
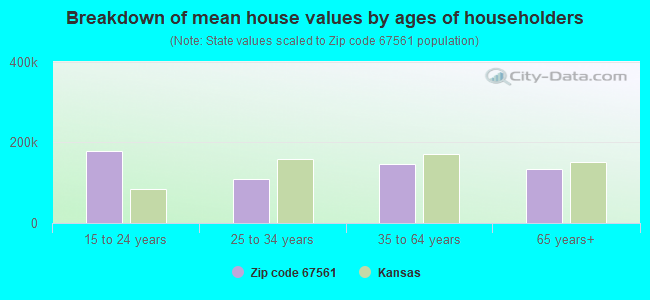
Median house value significantly below state average.
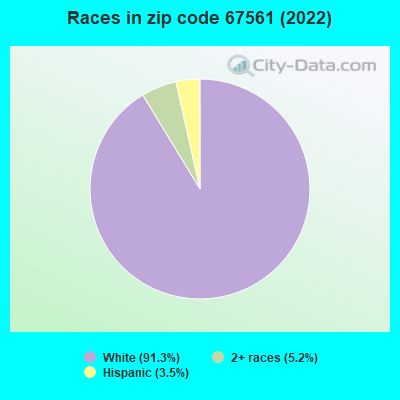
Black race population percentage significantly below state average.
Hispanic race population percentage significantly below state average.
Median age above state average.
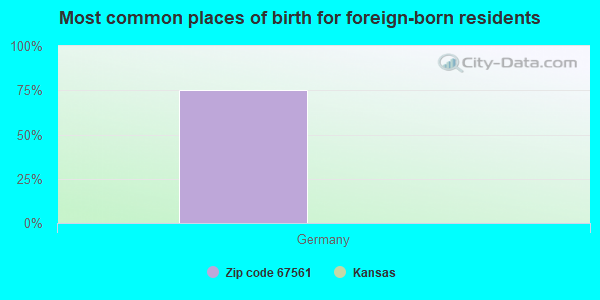
Foreign-born population percentage significantly below state average.
Length of stay since moving in significantly above state average.
House age above state average.
Percentage of population with a bachelor's degree or higher below state average.
Averages for the 2020 tax year for zip code 67561, filed in 2021:
Average Adjusted Gross Income (AGI) in 2020: $47,401 (Individual Income Tax Returns)
Here:
$47,401
State:
$72,721
Salary/wage: $42,694 (reported on 79.1% of returns)
Here:
$42,694
State:
$58,641
(% of AGI for various income ranges: 1147.6% for AGIs below $25k, 3591.4% for AGIs $25k-50k, 6938.8% for AGIs $50k-75k, 8908.3% for AGIs $75k-100k, 15843.3% for AGIs $100k-200k)
Taxable interest for individuals: $341 (reported on 25.4% of returns)
This zip code:
$341
Kansas:
$1,625
(% of AGI for various income ranges: 5.3% for AGIs below $25k, 10.0% for AGIs $25k-50k, 6.2% for AGIs $50k-75k, 38.3% for AGIs $75k-100k, 23.3% for AGIs $100k-200k)
Ordinary dividends: $1,488 (reported on 11.9% of returns)
Here:
$1,488
State:
$7,290
(% of AGI for various income ranges: 20.0% for AGIs below $25k, 25.0% for AGIs $50k-75k, 216.7% for AGIs $100k-200k)
Net capital gain/loss in AGI: +$1,614 (reported on 10.4% of returns)
Here:
+$1,614
State:
+$20,511
(% of AGI for various income ranges: 2.9% for AGIs below $25k, 180.0% for AGIs $75k-100k)
Profit/loss from business: +$12,900 (reported on 10.4% of returns)
Here:
+$12,900
State:
+$13,852
(% of AGI for various income ranges: 261.8% for AGIs below $25k, 572.5% for AGIs $50k-75k)
Taxable individual retirement arrangement distribution: $11,220 (reported on 7.5% of returns)
67561:
$11,220
Kansas:
$19,921
(% of AGI for various income ranges: 112.9% for AGIs below $25k, 461.2% for AGIs $50k-75k)
Earned income credit: $2,325 (reported on 17.9% of returns)
Here:
$2,325
State:
$2,267
(% of AGI for various income ranges: 93.5% for AGIs below $25k, 85.7% for AGIs $25k-50k)
Percentage of individuals using paid preparers for their 2020 taxes: 95.5%
Here:
96%
State:
95%
(% for various income ranges: 95.8% for AGIs below $25k, 94.1% for AGIs $25k-50k, 100.0% for AGIs $50k-75k, 100.0% for AGIs $75k-100k, 83.3% for AGIs $100k-200k)
Averages for the 2012 tax year for zip code 67561, filed in 2013:
Average Adjusted Gross Income (AGI) in 2012: $40,673 (Individual Income Tax Returns)
Here:
$40,673
State:
$60,095
Salary/wage: $33,346 (reported on 84.3% of returns)
Here:
$33,346
State:
$48,770
(% of AGI for various income ranges: 72.5% for AGIs below $25k, 81.8% for AGIs $25k-50k, 80.7% for AGIs $50k-75k, 71.4% for AGIs $75k-100k, 37.4% for AGIs $100k-200k)
Taxable interest for individuals: $719 (reported on 30.0% of returns)
This zip code:
$719
Kansas:
$1,506
(% of AGI for various income ranges: 0.4% for AGIs below $25k, 0.4% for AGIs $25k-50k, 0.6% for AGIs $50k-75k, 0.4% for AGIs $75k-100k, 0.8% for AGIs $100k-200k)
Ordinary dividends: $762 (reported on 11.4% of returns)
Here:
$762
State:
$6,093
Profit/loss from business: +$4,625 (reported on 17.1% of returns)
Here:
+$4,625
State:
+$12,554
(% of AGI for various income ranges: 6.7% for AGIs below $25k, 0.7% for AGIs $25k-50k, 4.2% for AGIs $50k-75k)
Taxable individual retirement arrangement distribution: $6,929 (reported on 10.0% of returns)
67561:
$6,929
Kansas:
$14,098
(% of AGI for various income ranges: 3.6% for AGIs below $25k, 1.8% for AGIs $25k-50k, 3.4% for AGIs $50k-75k)
Total itemized deductions: $18,789 (23% of AGI, reported on 12.9% of returns)
Here:
$18,789
State:
$23,678
Here:
23.1% of AGI
State:
18.9% of AGI
(% of AGI for various income ranges: 7.6% for AGIs $25k-50k, 8.9% for AGIs $50k-75k, 8.5% for AGIs $100k-200k)
Charity contributions: $4,371 (reported on 10.0% of returns)
Here:
$4,371
State:
$5,321
(% of AGI for various income ranges: 0.9% for AGIs $25k-50k, 1.4% for AGIs $50k-75k, 2.3% for AGIs $100k-200k)
Taxes paid: $6,500 (reported on 12.9% of returns)
67561:
$6,500
State:
$9,548
(% of AGI for various income ranges: 1.7% for AGIs $25k-50k, 2.5% for AGIs $50k-75k, 4.8% for AGIs $100k-200k)
Earned income credit: $2,119 (reported on 22.9% of returns)
Here:
$2,119
State:
$2,212
(% of AGI for various income ranges: 7.3% for AGIs below $25k, 1.1% for AGIs $25k-50k)
Percentage of individuals using paid preparers for their 2012 taxes: 61.4%
Here:
61%
State:
56%
(% for various income ranges: 55.2% for AGIs below $25k, 59.1% for AGIs $25k-50k, 70.0% for AGIs $50k-75k, 80.0% for AGIs $75k-100k, 75.0% for AGIs $100k-200k)
Averages for the 2004 tax year for zip code 67561, filed in 2005:
Average Adjusted Gross Income (AGI) in 2004: $30,590 (Individual Income Tax Returns)
Here:
$30,590
State:
$45,726
Salary/wage: $28,697 (reported on 87.2% of returns)
Here:
$28,697
State:
$40,112
(% of AGI for various income ranges: 95.4% for AGIs below $10k, 78.3% for AGIs $10k-25k, 83.1% for AGIs $25k-50k, 86.1% for AGIs $50k-75k, 73.0% for AGIs $75k-100k)
Taxable interest for individuals: $739 (reported on 43.2% of returns)
This zip code:
$739
Kansas:
$1,749
(% of AGI for various income ranges: 6.6% for AGIs below $10k, 1.6% for AGIs $10k-25k, 1.1% for AGIs $25k-50k, 0.6% for AGIs $50k-75k, 0.1% for AGIs $75k-100k)
Taxable dividends: $435 (reported on 17.5% of returns)
Here:
$435
State:
$3,066
(% of AGI for various income ranges: 0.5% for AGIs below $10k, 0.3% for AGIs $10k-25k, 0.3% for AGIs $25k-50k, 0.2% for AGIs $50k-75k, 0.2% for AGIs $75k-100k)
Net capital gain/loss: +$1,233 (reported on 13.1% of returns)
Here:
+$1,233
State:
+$7,555
Profit/loss from business: +$4,030 (reported on 15.2% of returns)
Here:
+$4,030
State:
+$9,571
(% of AGI for various income ranges: -0.7% for AGIs below $10k, 6.4% for AGIs $10k-25k, 2.9% for AGIs $25k-50k, -0.3% for AGIs $50k-75k)
IRA payment deduction: $1,077 (reported on 2.0% of returns)
67561:
$1,077
Kansas:
$2,922
Total itemized deductions: $13,815 (26% of AGI, reported on 16.4% of returns)
Here:
$13,815
State:
$18,779
Here:
26.0% of AGI
State:
20.5% of AGI
(% of AGI for various income ranges: 7.4% for AGIs $10k-25k, 7.0% for AGIs $25k-50k, 7.4% for AGIs $50k-75k, 9.6% for AGIs $75k-100k)
Charity contributions deductions: $2,349 (4% of AGI, reported on 13.1% of returns)
Here:
$2,349
State:
$3,892
Here:
4.1% of AGI
State:
4.0% of AGI
(% of AGI for various income ranges: 3.0% for AGIs below $10k, 0.9% for AGIs $25k-50k, 1.2% for AGIs $50k-75k, 1.7% for AGIs $75k-100k)
Total tax: $3,095 (reported on 72.3% of returns)
67561:
$3,095
State:
$7,203
(% of AGI for various income ranges: 2.6% for AGIs below $10k, 3.9% for AGIs $10k-25k, 6.4% for AGIs $25k-50k, 7.8% for AGIs $50k-75k, 12.7% for AGIs $75k-100k)
Earned income credit: $1,719 (reported on 20.5% of returns)
Here:
$1,719
State:
$1,674
Percentage of individuals using paid preparers for their 2004 taxes: 65.5%
Here:
66%
State:
63%
(% for various income ranges: 61.6% for AGIs below $10k, 63.3% for AGIs $10k-25k, 73.2% for AGIs $25k-50k, 57.9% for AGIs $50k-75k, 71.4% for AGIs $75k-100k)
Household received Food Stamps/SNAP in the past 12 months: 56 Household did not receive Food Stamps/SNAP in the past 12 months: 530
Women who had a birth in the past 12 months: 20 (17 now married, 2 unmarried) Women who did not have a birth in the past 12 months: 227 (128 now married, 98 unmarried)
Housing units in zip code 67561 with a mortgage: 153 (10 second mortgage, 2 both second mortgage and home equity loan) Median monthly owner costs for units with a mortgage: $993 Median monthly owner costs for units without a mortgage: $496
Residents with income below the poverty level in 2022:
This zip code:
5.7%
Whole state:
12.0%
Residents with income below 50% of the poverty level in 2022:
This zip code:
4.7%
Whole state:
6.4%
Median number of rooms in houses and condos:
Here:
6.4
State:
6.9
Median number of rooms in apartments:
Here:
5.0
State:
4.4
Notable locations in this zip code not listed on our city pages
Notable locations in zip code 67561: Team Marketing Alliance Grain Elevator Number 30 (A), Nickerson Police Department (B), Reno County Fire District 3 Station 1 (C), Nickerson Public Library (D), Nickerson City Hall (E). Display/hide their locations on the map
Churches in zip code 67561 include: Fairview United Methodist Church (A), Salem Community Church of the Brethren (B), Nickerson United Methodist Church (C), Christ Bible Church (D), First Baptist Church of Nickerson (E). Display/hide their locations on the map
Size of family households: 235 2-persons, 70 3-persons, 43 4-persons, 60 5-persons, 1 6-persons
Size of nonfamily households: 154 1-person, 14 2-persons
234 married couples with children.
100 single-parent households (66 men, 34 women).
96.6% of residents of 67561 zip code speak English at home.
3.2% of residents speak Spanish at home (10% very well, 90% not well).
0.4% of residents speak other Indo-European language at home (100% very well).
Foreign born population: 4 (0.3%) (0.0% of them are naturalized citizens)
:
0.3%
Whole state:
7.1%
75%Germany
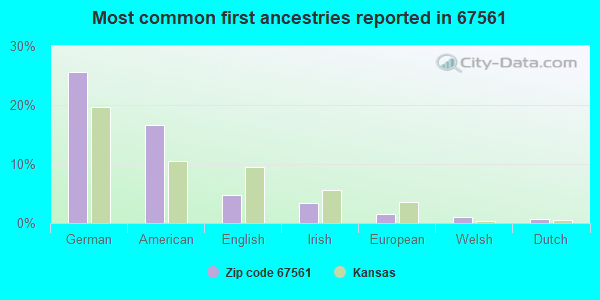
26%German
17%American
5%English
3%Irish
2%European
1%Welsh
1%Dutch
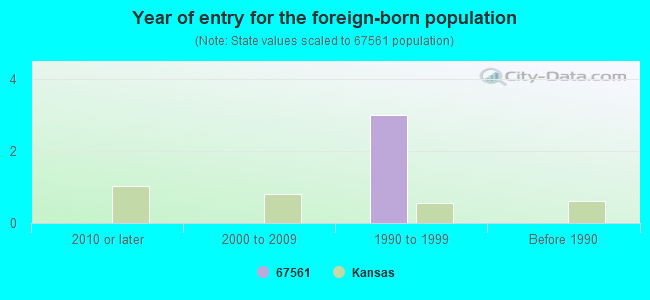
Year of entry for the foreign-born population
02010 or later
02000 to 2009
31990 to 1999
0Before 1990
Facilities with environmental interests located in this zip code:
BRUCE ENGELLAND (1109 NORTH NICKERSON ROAD in NICKERSON, KS)
National Pollutant Discharge Elimination System NON-MAJOR (Tracking pollutant discharge elimination systems) - permit Business SIC classification: DAIRY FARMS Alternative names: ENGELLAND, BRUCE
MILES HARTMAN (817 NORTH HERREN ROAD in NICKERSON, KS)
National Pollutant Discharge Elimination System NON-MAJOR (Tracking pollutant discharge elimination systems) - permit Business SIC classification: HOGS Alternative names: HARTMAN, MILES
USD 309 NICKERSON SOUTH HUTCHINSON (400 E "H" AVE in NICKERSON, KS)
Conditionally Exempt Small Quantity Generators, less than 100 kg/month of hazardous waste (Resource Conservation and Recovery Act (tracking hazardous waste)) - notification Organizations: USD 309 NICKERSON S HUTCHINSON (CONTACT/OWNER)
Alternative names: USD 309 NICKERSON S HUTCHINSON
Housing units lacking complete plumbing facilities: 4.2% Housing units lacking complete kitchen facilities: 4.7%
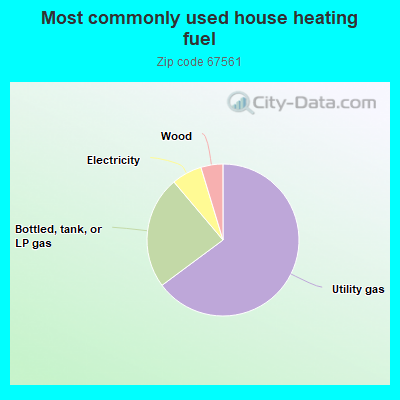
65.1%Utility gas
24.1%Bottled, tank, or LP gas
6.5%Electricity
4.7%Wood
Population in 1990: 1,596. Population change in the 1990s: +86 (+5.4%).
Place of birth for U.S.-born residents:
This state: 1,085
Northeast: 11
Midwest: 136
South: 119
West: 51
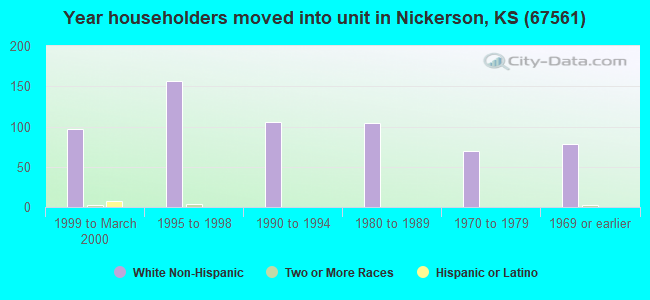
58% of the 67561 zip code residents lived in the same house 5 years ago. Out of people who lived in different houses, 56% lived in this county. Out of people who lived in different counties, 50% lived in Kansas.
94% of the 67561 zip code residents lived in the same house 1 year ago. Out of people who lived in different houses, 42% moved from this county. Out of people who lived in different houses, 23% moved from different county within same state. Out of people who lived in different houses, 38% moved from different state.
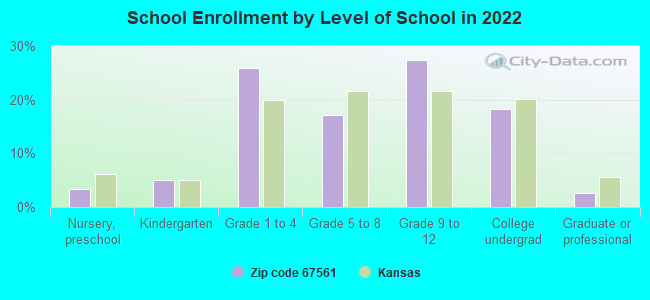
Private vs. public school enrollment:
Students in private schools in grades 1 to 8 (elementary and middle school):
Here:
0.0%
Kansas:
14.1%
Students in private schools in grades 9 to 12 (high school):
Here:
0.0%
Kansas:
10.8%
Students in private undergraduate colleges:
Here:
0.0%
Kansas:
15.4%
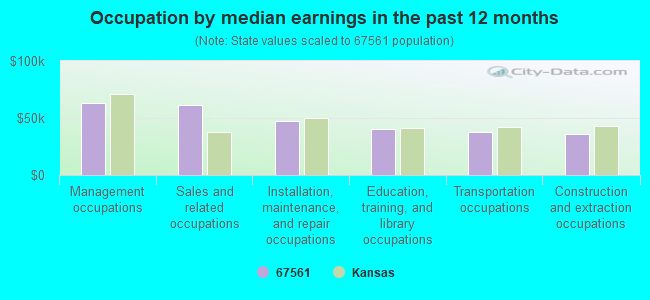
Occupation by median earnings in the past 12 months ($)
63,012Management occupations
61,208Sales and related occupations
47,454Installation, maintenance, and repair occupations
40,442Education, training, and library occupations
38,084Transportation occupations
36,223Construction and extraction occupations
Top industries in this zip code by the number of employees in 2005:
Administrative and Support and Waste Management and Remediation Services: Temporary Help Services (20-49 employees: 1 establishment)
Finance and Insurance: Commercial Banking (10-19: 1)
Health Care and Social Assistance: Child Day Care Services (5-9: 1, 1-4: 1)
Accommodation and Food Services: RV (Recreational Vehicle) Parks and Campgrounds (5-9: 1)
Wholesale Trade: Grain and Field Bean Merchant Wholesalers (5-9: 1)
Construction: Commercial and Institutional Building Construction (5-9: 1)
Accommodation and Food Services: Full-Service Restaurants (5-9: 1)
People in group quarters in 2010:
6 people in group homes intended for adults
People in group quarters in 2000:
6 people in other noninstitutional group quarters
Fatal accident statistics in 2013:
Fatal accident count: 1
Vehicles involved in fatal accidents: 2
Fatal accidents caused by drunken drivers: 0
Fatalities: 1
Persons involved in fatal accidents: 2
Pedestrians involved in fatal accidents: 0
Fatal accident statistics in 2012:
Fatal accident count: 1
Vehicles involved in fatal accidents: 2
Fatal accidents caused by drunken drivers: 0
Fatalities: 1
Persons involved in fatal accidents: 2
Pedestrians involved in fatal accidents: 0
2002 - 2018 National Fire Incident Reporting System (NFIRS) incidents
Based on the data from the years 2002 - 2018 the average number of fire incidents per year is 20. The highest number of fires - 41 took place in 2006, and the least - 10 in 2015. The data has a decreasing trend.
When looking into fire subcategories, the most reports belonged to: Outside Fires (58.1%), and Structure Fires (23.8%).
Fire incident types reported to NFIRS in Zip Code 67561


 Nearest zip codes: 67510, 67579, 67502, 67505, 67566, 67501.
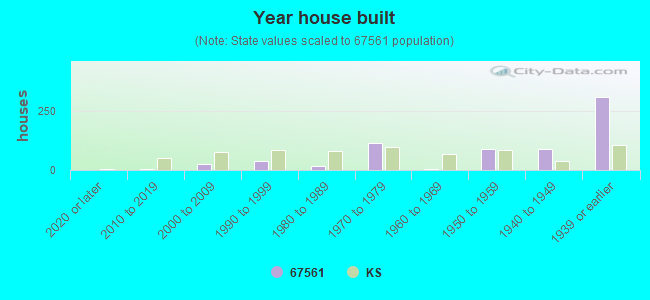


 Based on the data from the years 2002 - 2018 the average number of fire incidents per year is 20. The highest number of fires - 41 took place in 2006, and the least - 10 in 2015. The data has a decreasing trend.
 When looking into fire subcategories, the most reports belonged to: Outside Fires (58.1%), and Structure Fires (23.8%).