Estimated zip code population in 2022: 5,319 Zip code population in 2010: 5,366 Zip code population in 2000: 4,625
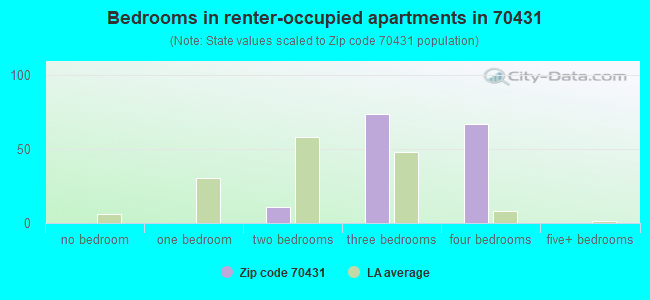
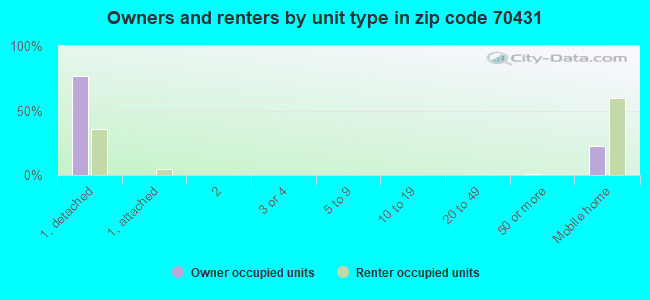
Houses and condos: 2,225 Renter-occupied apartments: 153
% of renters here:
7%
State:
32%
March 2022 cost of living index in zip code 70431: 84.4 (less than average, U.S. average is 100)
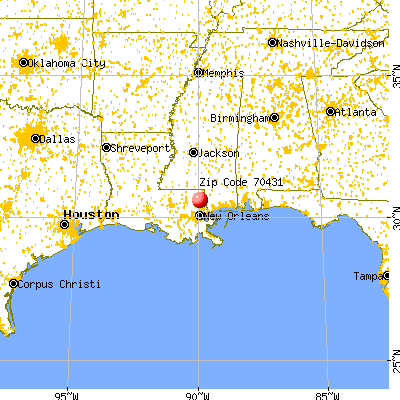
Land area: 72.0 sq. mi. Water area: 1.2 sq. mi.
Population density: 74 people per square mile
(very low).
OSM Map
General Map
Google Map
MSN Map
OSM Map
General Map
Google Map
MSN Map
OSM Map
General Map
Google Map
MSN Map
OSM Map
General Map
Google Map
MSN Map
Please wait while loading the map...
Real estate property taxes paid for housing units in 2022:
This zip code:
0.6% ($1,390)
Louisiana:
0.5% ($1,127)
Median real estate property taxes paid for housing units with mortgages in 2022: $1,714 (0.6%) Median real estate property taxes paid for housing units with no mortgage in 2022: $1,086 (0.5%)
Business Search- 14 Million verified businesses
Males: 2,737
(51.5%)
Females: 2,581
(48.5%)
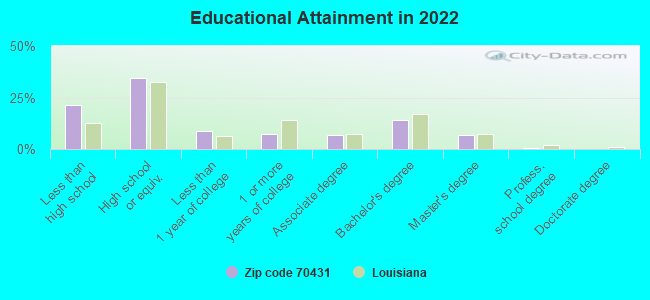
For population 25 years and over in 70431:
High school or higher: 78.1%
Bachelor's degree or higher: 21.4%
Graduate or professional degree: 7.3%
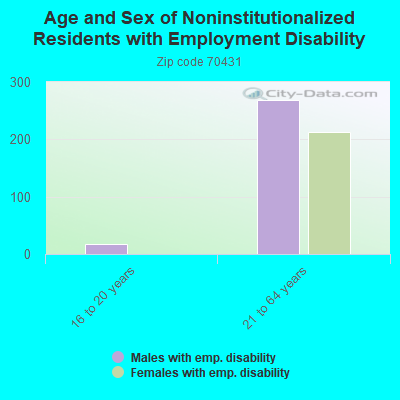
Unemployed: 15.6%
Mean travel time to work (commute): 41.6 minutes
For population 15 years and over in 70431:
Never married: 22.7%
Now married: 54.0%
Separated: 2.3%
Widowed: 13.7%
Divorced: 7.3%
Zip code 70431 compared to state average:
Unemployed percentage above state average.
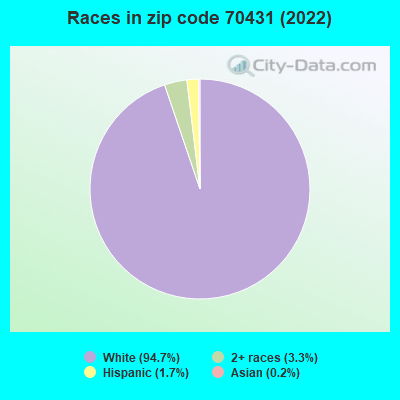
Black race population percentage significantly below state average.
Hispanic race population percentage significantly below state average.
Median age significantly above state average.
Foreign-born population percentage significantly below state average.
Renting percentage significantly below state average.
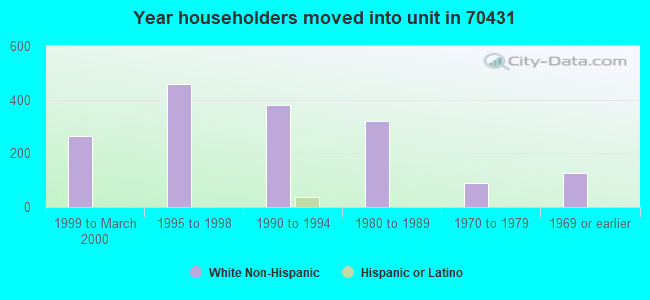
Length of stay since moving in above state average.
Estimated median house/condo value in 2022: $242,326
70431:
$242,326
Louisiana:
$209,200
According to our research of Louisiana and other state lists, there were 12 registered sex offenders living in 70431 zip code as of June 08, 2024. The ratio of all residents to sex offenders in zip code 70431 is 486 to 1. The ratio of registered sex offenders to all residents in this zip code is lower than the state average.
Median resident age:
This zip code:
47.5 years
Louisiana median age:
38.2 years
Average household size:
This zip code:
2.5 people
Louisiana:
2.5 people
Averages for the 2020 tax year for zip code 70431, filed in 2021:
Average Adjusted Gross Income (AGI) in 2020: $65,316 (Individual Income Tax Returns)
Here:
$65,316
State:
$60,757
Salary/wage: $55,392 (reported on 75.0% of returns)
Here:
$55,392
State:
$50,882
(% of AGI for various income ranges: 1037.5% for AGIs below $25k, 3152.4% for AGIs $25k-50k, 5912.0% for AGIs $50k-75k, 8357.6% for AGIs $75k-100k, 15427.3% for AGIs $100k-200k, 54256.7% for AGIs over 200k)
Taxable interest for individuals: $1,131 (reported on 33.9% of returns)
This zip code:
$1,131
Louisiana:
$1,576
(% of AGI for various income ranges: 18.2% for AGIs below $25k, 29.3% for AGIs $25k-50k, 80.8% for AGIs $50k-75k, 62.9% for AGIs $75k-100k, 112.7% for AGIs $100k-200k, 413.3% for AGIs over 200k)
Ordinary dividends: $3,917 (reported on 19.5% of returns)
Here:
$3,917
State:
$7,743
(% of AGI for various income ranges: 39.3% for AGIs below $25k, 40.2% for AGIs $25k-50k, 138.4% for AGIs $50k-75k, 200.6% for AGIs $75k-100k, 143.6% for AGIs $100k-200k, 1366.7% for AGIs over 200k)
Net capital gain/loss in AGI: +$10,602 (reported on 17.4% of returns)
Here:
+$10,602
State:
+$16,917
(% of AGI for various income ranges: 26.1% for AGIs below $25k, 13.7% for AGIs $25k-50k, 83.6% for AGIs $50k-75k, 204.7% for AGIs $75k-100k, 486.8% for AGIs $100k-200k, 8380.0% for AGIs over 200k)
Profit/loss from business: +$10,457 (reported on 21.6% of returns)
Here:
+$10,457
State:
+$7,679
(% of AGI for various income ranges: 195.6% for AGIs below $25k, 202.0% for AGIs $25k-50k, 190.8% for AGIs $50k-75k, 211.2% for AGIs $75k-100k, 1025.0% for AGIs $100k-200k, 996.7% for AGIs over 200k)
Taxable individual retirement arrangement distribution: $21,308 (reported on 11.0% of returns)
70431:
$21,308
Louisiana:
$20,716
(% of AGI for various income ranges: 62.5% for AGIs below $25k, 113.7% for AGIs $25k-50k, 307.2% for AGIs $50k-75k, 495.9% for AGIs $75k-100k, 1412.3% for AGIs $100k-200k)
Total itemized deductions: $34,683 (reported on 5.1% of returns)
Here:
$34,683
State:
$36,265
(% of AGI for various income ranges: 523.6% for AGIs $50k-75k, 679.5% for AGIs $100k-200k, 4526.7% for AGIs over 200k)
Charity contributions: $12,020 (reported on 4.2% of returns)
Here:
$12,020
State:
$13,106
(% of AGI for various income ranges: 76.0% for AGIs $50k-75k, 140.9% for AGIs $100k-200k, 2340.0% for AGIs over 200k)
Taxes paid: $6,608 (reported on 5.1% of returns)
70431:
$6,608
State:
$6,643
(% of AGI for various income ranges: 65.6% for AGIs $50k-75k, 171.4% for AGIs $100k-200k, 840.0% for AGIs over 200k)
Earned income credit: $2,397 (reported on 15.3% of returns)
Here:
$2,397
State:
$2,671
(% of AGI for various income ranges: 95.4% for AGIs below $25k, 77.8% for AGIs $25k-50k)
Percentage of individuals using paid preparers for their 2020 taxes: 92.8%
Here:
93%
State:
92%
(% for various income ranges: 92.5% for AGIs below $25k, 94.2% for AGIs $25k-50k, 91.7% for AGIs $50k-75k, 95.7% for AGIs $75k-100k, 91.7% for AGIs $100k-200k, 88.9% for AGIs over 200k)
Averages for the 2012 tax year for zip code 70431, filed in 2013:
Average Adjusted Gross Income (AGI) in 2012: $77,219 (Individual Income Tax Returns)
Here:
$77,219
State:
$56,730
Salary/wage: $51,332 (reported on 80.1% of returns)
Here:
$51,332
State:
$45,545
(% of AGI for various income ranges: 65.4% for AGIs below $25k, 76.9% for AGIs $25k-50k, 78.9% for AGIs $50k-75k, 73.0% for AGIs $75k-100k, 74.4% for AGIs $100k-200k, 21.2% for AGIs over 200k)
Taxable interest for individuals: $1,414 (reported on 35.4% of returns)
This zip code:
$1,414
Louisiana:
$1,804
(% of AGI for various income ranges: 1.4% for AGIs below $25k, 0.9% for AGIs $25k-50k, 0.6% for AGIs $50k-75k, 0.5% for AGIs $75k-100k, 0.5% for AGIs $100k-200k, 0.6% for AGIs over 200k)
Ordinary dividends: $4,164 (reported on 19.5% of returns)
Here:
$4,164
State:
$7,610
(% of AGI for various income ranges: 1.0% for AGIs below $25k, 0.9% for AGIs $25k-50k, 0.8% for AGIs $50k-75k, 1.0% for AGIs $75k-100k, 0.4% for AGIs $100k-200k, 1.5% for AGIs over 200k)
Net capital gain/loss in AGI: +$15,980 (reported on 15.5% of returns)
Here:
+$15,980
State:
+$17,096
(% of AGI for various income ranges: 0.2% for AGIs $75k-100k, 2.9% for AGIs $100k-200k, 6.5% for AGIs over 200k)
Profit/loss from business: +$13,950 (reported on 22.1% of returns)
Here:
+$13,950
State:
+$12,088
(% of AGI for various income ranges: 14.4% for AGIs below $25k, 5.4% for AGIs $25k-50k, 1.0% for AGIs $50k-75k, 2.0% for AGIs $75k-100k, 3.4% for AGIs $100k-200k, 3.8% for AGIs over 200k)
Taxable individual retirement arrangement distribution: $20,620 (reported on 11.1% of returns)
70431:
$20,620
Louisiana:
$16,085
(% of AGI for various income ranges: 5.1% for AGIs below $25k, 2.7% for AGIs $25k-50k, 3.1% for AGIs $50k-75k, 3.3% for AGIs $75k-100k, 7.7% for AGIs $100k-200k)
Total itemized deductions: $24,306 (14% of AGI, reported on 30.1% of returns)
Here:
$24,306
State:
$23,585
Here:
13.9% of AGI
State:
18.1% of AGI
(% of AGI for various income ranges: 10.3% for AGIs below $25k, 10.1% for AGIs $25k-50k, 12.1% for AGIs $50k-75k, 12.6% for AGIs $75k-100k, 13.5% for AGIs $100k-200k, 5.5% for AGIs over 200k)
Charity contributions: $4,031 (reported on 23.0% of returns)
Here:
$4,031
State:
$5,533
(% of AGI for various income ranges: 0.7% for AGIs below $25k, 0.9% for AGIs $25k-50k, 1.4% for AGIs $50k-75k, 1.3% for AGIs $75k-100k, 1.9% for AGIs $100k-200k, 0.9% for AGIs over 200k)
Taxes paid: $7,294 (reported on 30.1% of returns)
70431:
$7,294
State:
$6,282
(% of AGI for various income ranges: 1.4% for AGIs below $25k, 1.5% for AGIs $25k-50k, 2.2% for AGIs $50k-75k, 3.5% for AGIs $75k-100k, 4.1% for AGIs $100k-200k, 2.8% for AGIs over 200k)
Earned income credit: $2,110 (reported on 17.7% of returns)
Here:
$2,110
State:
$2,633
(% of AGI for various income ranges: 6.2% for AGIs below $25k, 1.1% for AGIs $25k-50k)
Percentage of individuals using paid preparers for their 2012 taxes: 60.2%
Here:
60%
State:
57%
(% for various income ranges: 54.7% for AGIs below $25k, 60.8% for AGIs $25k-50k, 65.6% for AGIs $50k-75k, 61.9% for AGIs $75k-100k, 60.7% for AGIs $100k-200k, 87.5% for AGIs over 200k)
Averages for the 2004 tax year for zip code 70431, filed in 2005:
Average Adjusted Gross Income (AGI) in 2004: $60,581 (Individual Income Tax Returns)
Here:
$60,581
State:
$39,411
Salary/wage: $39,192 (reported on 82.7% of returns)
Here:
$39,192
State:
$34,434
(% of AGI for various income ranges: 94.8% for AGIs below $10k, 75.5% for AGIs $10k-25k, 78.9% for AGIs $25k-50k, 82.9% for AGIs $50k-75k, 84.5% for AGIs $75k-100k, 28.8% for AGIs over 100k)
Taxable interest for individuals: $1,568 (reported on 41.0% of returns)
This zip code:
$1,568
Louisiana:
$1,606
(% of AGI for various income ranges: 7.1% for AGIs below $10k, 2.3% for AGIs $10k-25k, 1.4% for AGIs $25k-50k, 1.0% for AGIs $50k-75k, 0.5% for AGIs $75k-100k, 0.8% for AGIs over 100k)
Taxable dividends: $1,962 (reported on 20.1% of returns)
Here:
$1,962
State:
$3,235
(% of AGI for various income ranges: 2.3% for AGIs below $10k, 0.9% for AGIs $10k-25k, 0.9% for AGIs $25k-50k, 0.4% for AGIs $50k-75k, 0.4% for AGIs $75k-100k, 0.6% for AGIs over 100k)
Net capital gain/loss: +$15,121 (reported on 16.4% of returns)
Here:
+$15,121
State:
+$8,531
(% of AGI for various income ranges: -2.4% for AGIs below $10k, 0.8% for AGIs $10k-25k, 0.4% for AGIs $25k-50k, 0.9% for AGIs $50k-75k, 0.0% for AGIs $75k-100k, 7.4% for AGIs over 100k)
Profit/loss from business: +$9,502 (reported on 20.7% of returns)
Here:
+$9,502
State:
+$9,128
(% of AGI for various income ranges: 22.2% for AGIs below $10k, 10.1% for AGIs $10k-25k, 5.0% for AGIs $25k-50k, 1.2% for AGIs $50k-75k, 2.6% for AGIs $75k-100k, 1.9% for AGIs over 100k)
IRA payment deduction: $3,045 (reported on 2.2% of returns)
70431:
$3,045
Louisiana:
$3,055
Self-employed pension: $16,800 (reported on 0.5% of returns)
Here:
$16,800
Louisiana:
$17,274
Total itemized deductions: $18,414 (15% of AGI, reported on 27.1% of returns)
Here:
$18,414
State:
$18,222
Here:
14.9% of AGI
State:
20.3% of AGI
(% of AGI for various income ranges: 9.6% for AGIs below $10k, 10.7% for AGIs $10k-25k, 10.4% for AGIs $25k-50k, 12.8% for AGIs $50k-75k, 13.3% for AGIs $75k-100k, 5.1% for AGIs over 100k)
Charity contributions deductions: $2,864 (3% of AGI, reported on 22.9% of returns)
Here:
$2,864
State:
$4,190
Here:
3.1% of AGI
State:
4.4% of AGI
(% of AGI for various income ranges: 1.2% for AGIs $10k-25k, 1.2% for AGIs $25k-50k, 1.4% for AGIs $50k-75k, 2.2% for AGIs $75k-100k, 0.8% for AGIs over 100k)
Total tax: $10,323 (reported on 76.2% of returns)
70431:
$10,323
State:
$6,529
(% of AGI for various income ranges: 5.4% for AGIs below $10k, 4.7% for AGIs $10k-25k, 6.6% for AGIs $25k-50k, 8.0% for AGIs $50k-75k, 10.4% for AGIs $75k-100k, 17.9% for AGIs over 100k)
Earned income credit: $1,932 (reported on 17.3% of returns)
Here:
$1,932
State:
$2,103
Percentage of individuals using paid preparers for their 2004 taxes: 59.0%
Here:
59%
State:
61%
(% for various income ranges: 54.0% for AGIs below $10k, 63.6% for AGIs $10k-25k, 56.3% for AGIs $25k-50k, 61.0% for AGIs $50k-75k, 57.8% for AGIs $75k-100k, 63.6% for AGIs over 100k)
Household received Food Stamps/SNAP in the past 12 months: 393 Household did not receive Food Stamps/SNAP in the past 12 months: 1,746
Women who had a birth in the past 12 months: 46 (44 now married, 0 unmarried) Women who did not have a birth in the past 12 months: 1,094 (571 now married, 517 unmarried)
Housing units in zip code 70431 with a mortgage: 860 (166 second mortgage, 154 both second mortgage and home equity loan) Median monthly owner costs for units with a mortgage: $1,282 Median monthly owner costs for units without a mortgage: $406
Residents with income below the poverty level in 2022:
This zip code:
28.6%
Whole state:
18.6%
Residents with income below 50% of the poverty level in 2022:
This zip code:
24.1%
Whole state:
10.1%
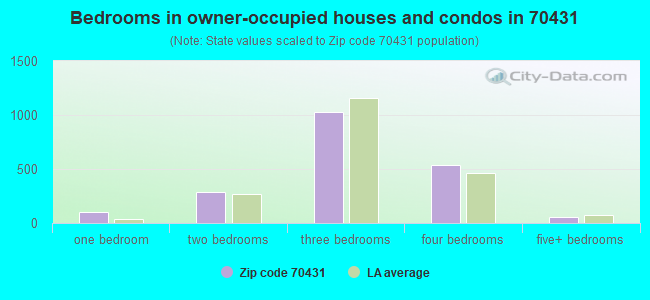
Median number of rooms in houses and condos:
Here:
6.1
State:
6.2
Median number of rooms in apartments:
Here:
5.7
State:
4.4
Notable locations in this zip code not listed on our city pages
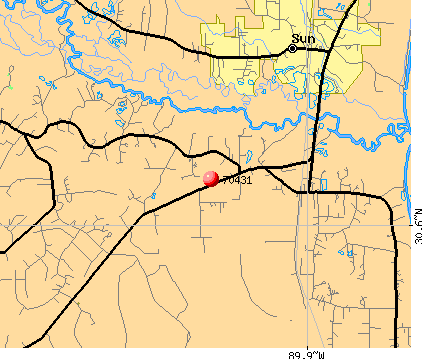
Notable locations in zip code 70431: Dave (A), Saint Tammany Parish Sheriff's Office (B), Saint Tammany Parish Library Bush Branch (C), Saint Tammany Parish Fire District 9 - Bush and Fifth Ward Volunteer Fire Department (D), Saint Tammany Parish Fire District 9 Station 92 (E), Saint Tammany Parish Fire District 9 Station 93 (F), Saint Tammany Parish Fire District 6 Station 3 (G). Display/hide their locations on the map
Churches in zip code 70431 include: New Beginning Baptist Church (A), Church of God (B), Bush Church (C), Sharps Chapel (D), Victory Faith United Pentecostal Church (E), Pine Grove Church (F), Jerusalem Church (G), Hebron Church (H). Display/hide their locations on the map
Cemeteries: Corkern Cemetery (1), Sharp Chapel Cemetery (2), Hebron Cemetery (3), Crawford Cemetery (4), Williams Cemetery (5), Thomas Cemetery (6), Sharps Cemetery (7). Display/hide their locations on the map
Size of family households: 783 2-persons, 226 3-persons, 297 4-persons, 182 5-persons
Size of nonfamily households: 613 1-person, 27 2-persons
495 married couples with children.
271 single-parent households (92 men, 179 women).
100.5% of residents of 70431 zip code speak English at home.
0.3% of residents speak other Indo-European language at home (100% very well).
0.2% of residents speak other language at home (100% very well).
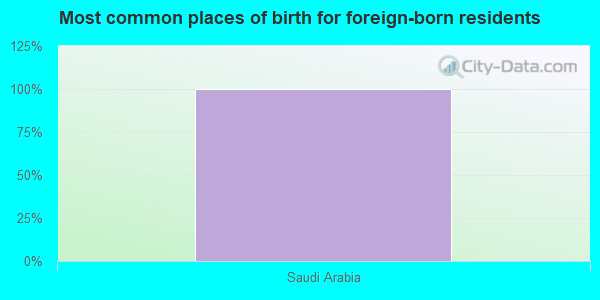
Foreign born population: 8 (0.2%) (100.0% of them are naturalized citizens)
This zip code:
0.2%
Whole state:
4.2%
100%Saudi Arabia
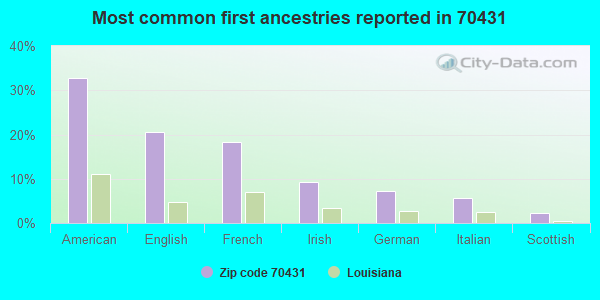
33%American
21%English
18%French
9%Irish
7%German
6%Italian
2%Scottish
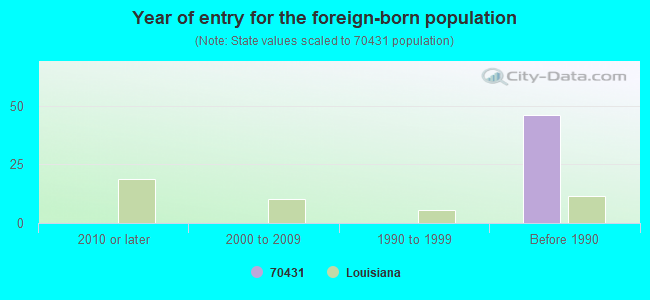
Year of entry for the foreign-born population
02010 or later
02000 to 2009
01990 to 1999
46Before 1990
Public elementary/middle school in in zip code 70431 not listed on the city page:
Facilities with environmental interests located in this zip code:
FIFTH WARD JUNIOR HIGH SCHOOL (81419 HIGHWAY 21 in BUSH, LA)
(Geographic Names Information System) (National Center for Education Statistics) - STATE ID-052016 Organizations: SAINT TAMMANY PARISH SCHOOL BOARD (SCHOOL DISTRICT)
BELLSOUTH-BUSH MAIN (LA HWY 41 in BUSH, LA)
National Pollutant Discharge Elimination System NON-MAJOR (Tracking pollutant discharge elimination systems) - permit (Resource Conservation and Recovery Act (tracking hazardous waste)) Business SIC classification: TELEPHONE COMMUNICATIONS, EXCEPT RADIOTELEPHONE Organizations: SOUTH CENTRAL BELL TELEPHONE COMPANY (CONTACT/OPERATOR)
, UNKNOWN (CONTACT/OWNER)
Alternative names: SOUTH CENTRAL BELL BUSHLAMA
RAY GROWE & SON'S, INC. (2 M E OF HWY 437 in BUSH, LA)
National Pollutant Discharge Elimination System NON-MAJOR (Tracking pollutant discharge elimination systems) - permit
GLASS CONTRACTING, INC (2M E OF HWY 437 in BUSH, LA)
National Pollutant Discharge Elimination System NON-MAJOR (Tracking pollutant discharge elimination systems) - permit
HEBRON BAPTIST CHURCH (79614 HWY 41 in BUSH, LA)
National Pollutant Discharge Elimination System NON-MAJOR (Tracking pollutant discharge elimination systems) - permit Business SIC classification: SEWERAGE SYSTEMS
HIGHWAY 21, LLC- ( in , LA)
National Pollutant Discharge Elimination System NON-MAJOR (Tracking pollutant discharge elimination systems) - permit Business SIC classification: SEWERAGE SYSTEMS
Housing units lacking complete plumbing facilities: 1.2% Housing units lacking complete kitchen facilities: 1.6%
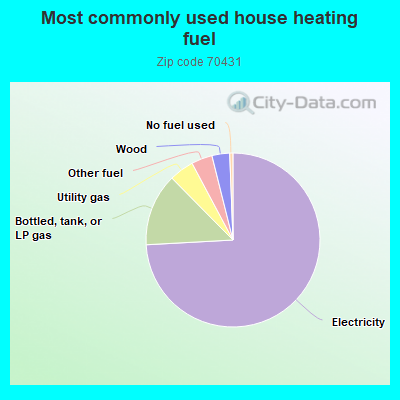
74.2%Electricity
13.5%Bottled, tank, or LP gas
4.6%Utility gas
3.9%Other fuel
3.3%Wood
0.6%No fuel used
Population in 1990: 3,906. Population change in the 1990s: +719 (+18.4%).
Place of birth for U.S.-born residents:
This state: 4,231
Northeast: 69
Midwest: 278
South: 540
West: 145
62% of the 70431 zip code residents lived in the same house 5 years ago. Out of people who lived in different houses, 49% lived in this county. Out of people who lived in different counties, 50% lived in Louisiana.
90% of the 70431 zip code residents lived in the same house 1 year ago. Out of people who lived in different houses, 29% moved from this county. Out of people who lived in different houses, 18% moved from different county within same state. Out of people who lived in different houses, 54% moved from different state.
Private vs. public school enrollment:
Students in private schools in grades 1 to 8 (elementary and middle school): 22
Here:
4.9%
Louisiana:
19.6%
Students in private schools in grades 9 to 12 (high school): 32
Here:
12.7%
Louisiana:
18.3%
Students in private undergraduate colleges: 29
Here:
12.2%
Louisiana:
17.4%
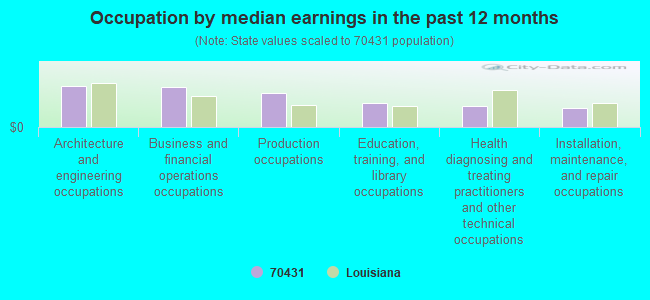
Occupation by median earnings in the past 12 months ($)
111,579Architecture and engineering occupations
108,407Business and financial operations occupations
91,832Production occupations
66,815Education, training, and library occupations
58,579Health diagnosing and treating practitioners and other technical occupations
51,830Installation, maintenance, and repair occupations
Companies with federal contracts located in this zip code:
A1 AQUACULTURE (79465 HIGHWAY 1083 in BUSH, LA; small business) : $128,750 in 2 contractsin 2002
$75,000 with U.S. Army Corps of Engineers - civil program financing only for Patent and Trademark Services. Signed on 2002-01-10. Completion date: 2002-09-30.
$53,750 with U.S. Army Corps of Engineers - civil program financing only for Other Quality Control, Testing and Inspection Services -- Water Purification and Sewage Treatment Equipment. Taking place in WA. Signed on 2002-07-03. Completion date: 2002-11-08.
Top industries in this zip code by the number of employees in 2005:
Administrative and Support and Waste Management and Remediation Services: Landscaping Services (10-19 employees: 1 establishment, 1-4 employees: 3 establishments)
Construction: Site Preparation Contractors (10-19: 1, 1-4: 1)
Health Care and Social Assistance: Child Day Care Services (10-19: 1)
Construction: Commercial and Institutional Building Construction (5-9: 1, 1-4: 2)
Accommodation and Food Services: Limited-Service Restaurants (5-9: 1)
Fatal accident statistics in 2014:
Fatal accident count: 1
Vehicles involved in fatal accidents: 1
Fatal accidents caused by drunken drivers: 1
Fatalities: 1
Persons involved in fatal accidents: 1
Pedestrians involved in fatal accidents: 0
Fatal accident statistics in 2012:
Fatal accident count: 1
Vehicles involved in fatal accidents: 1
Fatal accidents caused by drunken drivers: 0
Fatalities: 1
Persons involved in fatal accidents: 1
Pedestrians involved in fatal accidents: 0
Home Mortgage Disclosure Act Aggregated Statistics For Year 2009 (Based on 4 partial tracts)
A) FHA, FSA/RHS & VA Home Purchase Loans
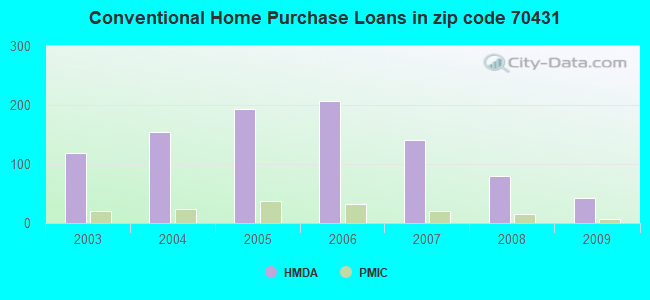
B) Conventional Home Purchase Loans
C) Refinancings
D) Home Improvement Loans
F) Non-occupant Loans on < 5 Family Dwellings (A B C & D)
G) Loans On Manufactured Home Dwelling (A B C & D)
Number
Average Value
Number
Average Value
Number
Average Value
Number
Average Value
Number
Average Value
Number
Average Value
LOANS ORIGINATED
16
$175,608
43
$186,337
264
$200,997
30
$67,047
16
$275,001
11
$57,399
APPLICATIONS APPROVED, NOT ACCEPTED
4
$142,348
7
$144,164
39
$212,926
1
$60,860
1
$98,440
6
$80,165
APPLICATIONS DENIED
3
$155,593
25
$135,134
102
$195,622
25
$49,787
6
$127,158
16
$47,491
APPLICATIONS WITHDRAWN
3
$202,653
6
$386,053
50
$205,488
3
$157,290
1
$436,940
2
$116,740
FILES CLOSED FOR INCOMPLETENESS
2
$183,315
3
$153,317
15
$189,139
5
$109,594
1
$85,030
2
$90,090
Aggregated Statistics For Year 2008 (Based on 4 partial tracts)
A) FHA, FSA/RHS & VA Home Purchase Loans
B) Conventional Home Purchase Loans
C) Refinancings
D) Home Improvement Loans
F) Non-occupant Loans on < 5 Family Dwellings (A B C & D)
G) Loans On Manufactured Home Dwelling (A B C & D)
Number
Average Value
Number
Average Value
Number
Average Value
Number
Average Value
Number
Average Value
Number
Average Value
LOANS ORIGINATED
21
$167,017
79
$198,785
194
$170,055
39
$47,952
24
$132,240
20
$62,211
APPLICATIONS APPROVED, NOT ACCEPTED
6
$107,963
15
$141,575
26
$204,933
8
$67,698
3
$334,897
9
$63,022
APPLICATIONS DENIED
6
$146,432
17
$135,962
86
$175,173
34
$63,317
8
$87,868
25
$62,622
APPLICATIONS WITHDRAWN
1
$237,250
8
$129,246
27
$228,220
4
$76,905
0
$0
3
$65,807
FILES CLOSED FOR INCOMPLETENESS
0
$0
3
$58,010
14
$174,981
0
$0
0
$0
2
$45,445
Aggregated Statistics For Year 2007 (Based on 4 partial tracts)
A) FHA, FSA/RHS & VA Home Purchase Loans
B) Conventional Home Purchase Loans
C) Refinancings
D) Home Improvement Loans
F) Non-occupant Loans on < 5 Family Dwellings (A B C & D)
G) Loans On Manufactured Home Dwelling (A B C & D)
Number
Average Value
Number
Average Value
Number
Average Value
Number
Average Value
Number
Average Value
Number
Average Value
LOANS ORIGINATED
8
$174,799
140
$191,766
191
$176,069
72
$50,521
22
$128,056
33
$54,498
APPLICATIONS APPROVED, NOT ACCEPTED
2
$43,115
25
$128,334
43
$179,499
10
$38,831
2
$328,310
23
$55,548
APPLICATIONS DENIED
0
$0
54
$130,569
87
$163,656
35
$98,657
7
$115,371
37
$70,020
APPLICATIONS WITHDRAWN
1
$50,660
16
$177,412
34
$201,069
4
$85,050
1
$265,010
2
$97,430
FILES CLOSED FOR INCOMPLETENESS
0
$0
4
$215,165
23
$180,826
0
$0
0
$0
0
$0
Aggregated Statistics For Year 2006 (Based on 4 partial tracts)
A) FHA, FSA/RHS & VA Home Purchase Loans
B) Conventional Home Purchase Loans
C) Refinancings
D) Home Improvement Loans
F) Non-occupant Loans on < 5 Family Dwellings (A B C & D)
G) Loans On Manufactured Home Dwelling (A B C & D)
Number
Average Value
Number
Average Value
Number
Average Value
Number
Average Value
Number
Average Value
Number
Average Value
LOANS ORIGINATED
17
$129,681
206
$161,005
160
$159,735
56
$29,408
16
$162,434
33
$60,161
APPLICATIONS APPROVED, NOT ACCEPTED
1
$50,090
37
$125,472
33
$109,372
8
$73,479
0
$0
22
$52,849
APPLICATIONS DENIED
3
$117,817
67
$97,013
78
$134,551
31
$75,966
14
$74,447
48
$51,426
APPLICATIONS WITHDRAWN
1
$158,920
23
$164,438
46
$195,257
2
$159,110
1
$12,390
4
$97,910
FILES CLOSED FOR INCOMPLETENESS
0
$0
6
$430,940
20
$225,719
1
$12,370
0
$0
1
$129,100
Aggregated Statistics For Year 2005 (Based on 4 partial tracts)
A) FHA, FSA/RHS & VA Home Purchase Loans
B) Conventional Home Purchase Loans
C) Refinancings
D) Home Improvement Loans
F) Non-occupant Loans on < 5 Family Dwellings (A B C & D)
G) Loans On Manufactured Home Dwelling (A B C & D)
Number
Average Value
Number
Average Value
Number
Average Value
Number
Average Value
Number
Average Value
Number
Average Value
LOANS ORIGINATED
20
$113,262
193
$153,505
203
$148,798
53
$38,057
21
$98,541
36
$51,392
APPLICATIONS APPROVED, NOT ACCEPTED
1
$90,160
45
$95,324
39
$134,475
7
$73,333
4
$55,685
19
$44,397
APPLICATIONS DENIED
4
$120,502
71
$89,684
107
$130,953
31
$32,090
10
$46,906
50
$50,735
APPLICATIONS WITHDRAWN
1
$190,330
12
$250,489
60
$162,626
6
$99,382
0
$0
3
$75,240
FILES CLOSED FOR INCOMPLETENESS
1
$132,600
15
$180,791
17
$180,570
1
$49,200
0
$0
0
$0
Aggregated Statistics For Year 2004 (Based on 4 partial tracts)
A) FHA, FSA/RHS & VA Home Purchase Loans
B) Conventional Home Purchase Loans
C) Refinancings
D) Home Improvement Loans
E) Loans on Dwellings For 5+ Families
F) Non-occupant Loans on < 5 Family Dwellings (A B C & D)
G) Loans On Manufactured Home Dwelling (A B C & D)
Number
Average Value
Number
Average Value
Number
Average Value
Number
Average Value
Number
Average Value
Number
Average Value
Number
Average Value
LOANS ORIGINATED
20
$103,590
154
$150,633
280
$149,087
55
$47,051
1
$79,530
32
$151,263
33
$55,025
APPLICATIONS APPROVED, NOT ACCEPTED
1
$246,050
21
$125,612
53
$132,864
9
$49,718
0
$0
2
$89,700
8
$38,202
APPLICATIONS DENIED
7
$125,053
36
$86,961
160
$123,284
27
$37,504
0
$0
5
$135,800
46
$55,282
APPLICATIONS WITHDRAWN
1
$130,400
13
$112,100
72
$138,563
4
$118,395
0
$0
2
$129,650
3
$83,620
FILES CLOSED FOR INCOMPLETENESS
3
$127,433
8
$247,438
47
$158,596
1
$119,890
0
$0
1
$266,750
1
$84,650
Aggregated Statistics For Year 2003 (Based on 4 partial tracts)
A) FHA, FSA/RHS & VA Home Purchase Loans
B) Conventional Home Purchase Loans
C) Refinancings
D) Home Improvement Loans
F) Non-occupant Loans on < 5 Family Dwellings (A B C & D)
Detailed PMIC statistics for the following Tracts:0401.01
, 0401.02
2002 - 2018 National Fire Incident Reporting System (NFIRS) incidents
According to the data from the years 2002 - 2018 the average number of fires per year is 26. The highest number of fires - 67 took place in 2010, and the least - 0 in 2004. The data has an increasing trend.
When looking into fire subcategories, the most incidents belonged to: Outside Fires (64.9%), and Structure Fires (25.8%).
Fire incident types reported to NFIRS in Zip Code 70431


 Nearest zip codes: 70463, 70464, 70420, 70427, 70435, 70471.


 (Students: 578, Location: 81419 HIGHWAY 21, Grades: PK-8)


 According to the data from the years 2002 - 2018 the average number of fires per year is 26. The highest number of fires - 67 took place in 2010, and the least - 0 in 2004. The data has an increasing trend.
 When looking into fire subcategories, the most incidents belonged to: Outside Fires (64.9%), and Structure Fires (25.8%).