Estimated zip code population in 2022: 3,210 Zip code population in 2010: 2,923 Zip code population in 2000: 3,829
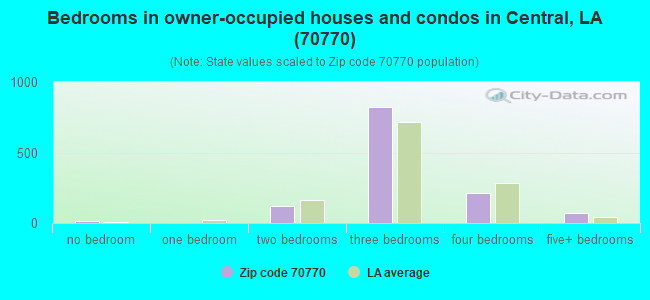
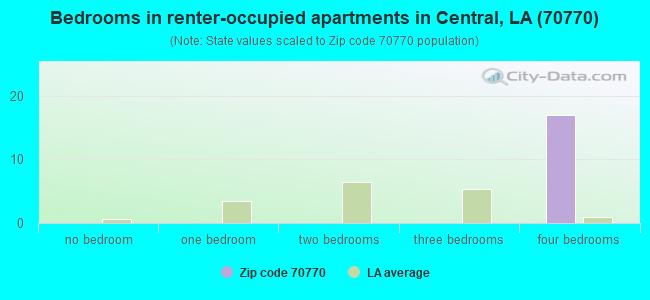
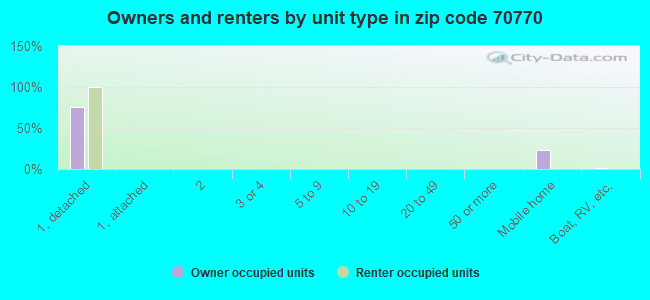
Houses and condos: 1,425 Renter-occupied apartments: 17
% of renters here:
1%
State:
32%
March 2022 cost of living index in zip code 70770: 77.9 (low, U.S. average is 100)
Land area: 20.6 sq. mi. Water area: 0.0 sq. mi.
Population density: 156 people per square mile
(very low).
OSM Map
General Map
Google Map
MSN Map
OSM Map
General Map
Google Map
MSN Map
OSM Map
General Map
Google Map
MSN Map
OSM Map
General Map
Google Map
MSN Map
Please wait while loading the map...
Real estate property taxes paid for housing units in 2022:
This zip code:
0.6% ($1,177)
Louisiana:
0.5% ($1,127)
Median real estate property taxes paid for housing units with mortgages in 2022: $1,672 (0.8%) Median real estate property taxes paid for housing units with no mortgage in 2022: $683 (0.4%)
Business Search- 14 Million verified businesses
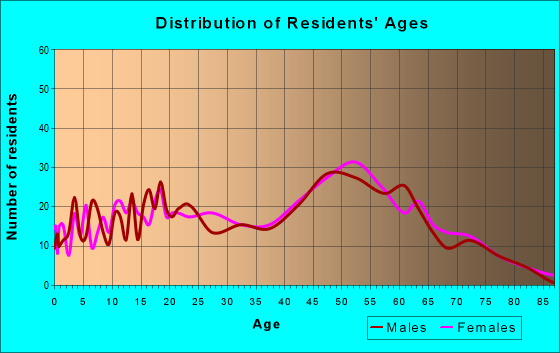
Males: 1,467
(45.7%)
Females: 1,743
(54.3%)
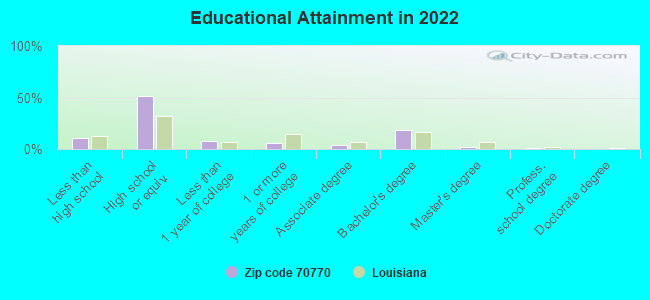
For population 25 years and over in 70770:
High school or higher: 89.8%
Bachelor's degree or higher: 21.0%
Graduate or professional degree: 2.6%
Unemployed: 3.9%
Mean travel time to work (commute): 36.0 minutes
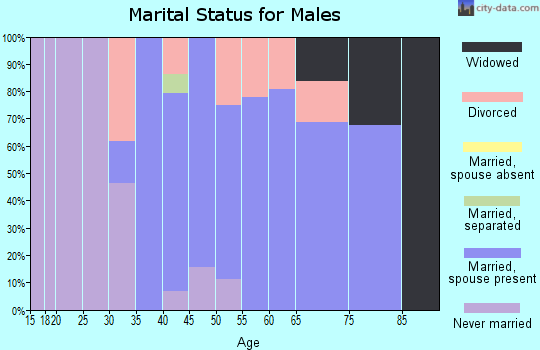
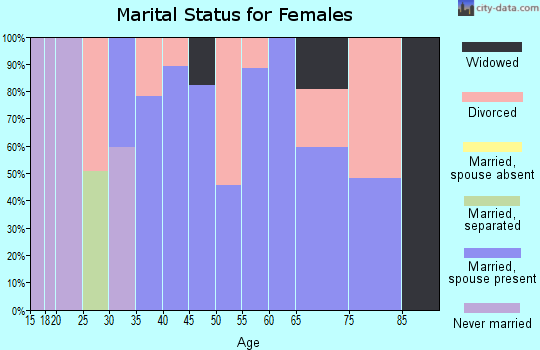
For population 15 years and over in 70770:
Never married: 23.3%
Now married: 57.4%
Separated: 1.4%
Widowed: 5.0%
Divorced: 12.9%
Zip code 70770 compared to state average:
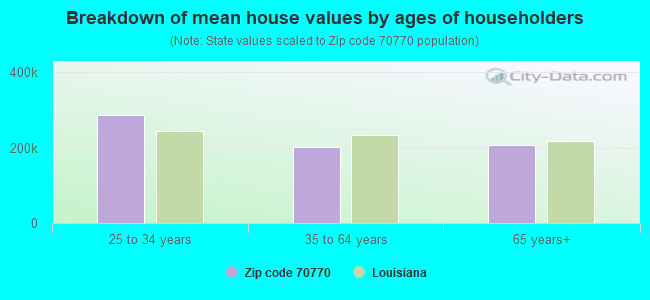
Median household income above state average.
Black race population percentage significantly below state average.
Median age significantly above state average.
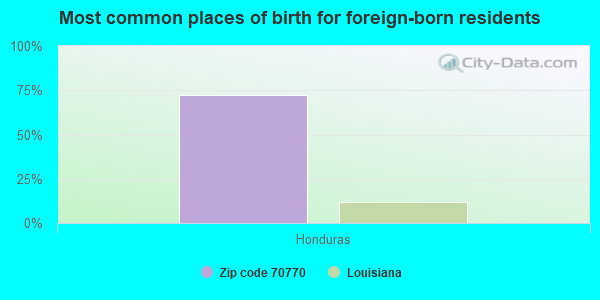
Foreign-born population percentage below state average.
Renting percentage significantly below state average.
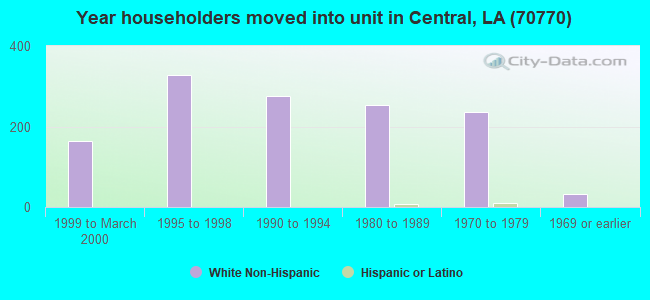
Length of stay since moving in significantly above state average.
Averages for the 2020 tax year for zip code 70770, filed in 2021:
Average Adjusted Gross Income (AGI) in 2020: $74,842 (Individual Income Tax Returns)
Here:
$74,842
State:
$60,757
Salary/wage: $68,315 (reported on 80.9% of returns)
Here:
$68,315
State:
$50,882
(% of AGI for various income ranges: 1074.4% for AGIs below $25k, 3274.0% for AGIs $25k-50k, 5873.5% for AGIs $50k-75k, 9240.0% for AGIs $75k-100k, 16098.9% for AGIs $100k-200k, 44180.0% for AGIs over 200k)
Taxable interest for individuals: $842 (reported on 34.8% of returns)
This zip code:
$842
Louisiana:
$1,576
(% of AGI for various income ranges: 10.0% for AGIs below $25k, 19.0% for AGIs $25k-50k, 18.0% for AGIs $50k-75k, 29.2% for AGIs $75k-100k, 106.3% for AGIs $100k-200k, 175.0% for AGIs over 200k)
Ordinary dividends: $3,515 (reported on 15.2% of returns)
Here:
$3,515
State:
$7,743
(% of AGI for various income ranges: 8.8% for AGIs below $25k, 32.3% for AGIs $25k-50k, 40.5% for AGIs $50k-75k, 13.8% for AGIs $75k-100k, 203.3% for AGIs $100k-200k, 435.0% for AGIs over 200k)
Net capital gain/loss in AGI: +$5,209 (reported on 12.9% of returns)
Here:
+$5,209
State:
+$16,917
(% of AGI for various income ranges: 5.3% for AGIs $25k-50k, 40.5% for AGIs $50k-75k, 1.5% for AGIs $75k-100k, 219.6% for AGIs $100k-200k, 1265.0% for AGIs over 200k)
Profit/loss from business: +$5,310 (reported on 16.9% of returns)
Here:
+$5,310
State:
+$7,679
(% of AGI for various income ranges: 80.0% for AGIs below $25k, 150.0% for AGIs $25k-50k, 99.0% for AGIs $50k-75k, 53.1% for AGIs $75k-100k, 223.7% for AGIs $100k-200k)
Taxable individual retirement arrangement distribution: $31,272 (reported on 10.1% of returns)
70770:
$31,272
Louisiana:
$20,716
(% of AGI for various income ranges: 62.6% for AGIs below $25k, 110.7% for AGIs $25k-50k, 288.5% for AGIs $50k-75k, 495.4% for AGIs $75k-100k, 1430.7% for AGIs $100k-200k)
Total itemized deductions: $30,107 (reported on 7.9% of returns)
Here:
$30,107
State:
$36,265
(% of AGI for various income ranges: 625.5% for AGIs $50k-75k, 705.2% for AGIs $100k-200k, 2650.0% for AGIs over 200k)
Charity contributions: $10,954 (reported on 7.3% of returns)
Here:
$10,954
State:
$13,106
(% of AGI for various income ranges: 149.0% for AGIs $50k-75k, 233.0% for AGIs $100k-200k, 1242.5% for AGIs over 200k)
Taxes paid: $7,307 (reported on 7.9% of returns)
70770:
$7,307
State:
$6,643
(% of AGI for various income ranges: 133.0% for AGIs $50k-75k, 181.5% for AGIs $100k-200k, 667.5% for AGIs over 200k)
Earned income credit: $2,243 (reported on 12.9% of returns)
Here:
$2,243
State:
$2,671
(% of AGI for various income ranges: 92.4% for AGIs below $25k, 67.3% for AGIs $25k-50k)
Percentage of individuals using paid preparers for their 2020 taxes: 93.8%
Here:
94%
State:
92%
(% for various income ranges: 91.5% for AGIs below $25k, 94.7% for AGIs $25k-50k, 92.6% for AGIs $50k-75k, 94.4% for AGIs $75k-100k, 94.9% for AGIs $100k-200k, 100.0% for AGIs over 200k)
Averages for the 2012 tax year for zip code 70770, filed in 2013:
Average Adjusted Gross Income (AGI) in 2012: $58,014 (Individual Income Tax Returns)
Here:
$58,014
State:
$56,730
Salary/wage: $50,697 (reported on 85.3% of returns)
Here:
$50,697
State:
$45,545
(% of AGI for various income ranges: 71.2% for AGIs below $25k, 78.0% for AGIs $25k-50k, 75.6% for AGIs $50k-75k, 80.0% for AGIs $75k-100k, 82.3% for AGIs $100k-200k, 44.9% for AGIs over 200k)
Taxable interest for individuals: $649 (reported on 35.6% of returns)
This zip code:
$649
Louisiana:
$1,804
(% of AGI for various income ranges: 1.1% for AGIs below $25k, 0.4% for AGIs $25k-50k, 0.3% for AGIs $50k-75k, 0.2% for AGIs $75k-100k, 0.4% for AGIs $100k-200k, 0.4% for AGIs over 200k)
Ordinary dividends: $2,883 (reported on 13.6% of returns)
Here:
$2,883
State:
$7,610
(% of AGI for various income ranges: 0.3% for AGIs below $25k, 0.7% for AGIs $25k-50k, 0.6% for AGIs $50k-75k, 0.8% for AGIs $75k-100k, 0.9% for AGIs $100k-200k)
Net capital gain/loss in AGI: +$11,573 (reported on 8.5% of returns)
Here:
+$11,573
State:
+$17,096
(% of AGI for various income ranges: 0.2% for AGIs $75k-100k, 5.3% for AGIs $100k-200k)
Profit/loss from business: +$6,762 (reported on 13.6% of returns)
Here:
+$6,762
State:
+$12,088
(% of AGI for various income ranges: 7.0% for AGIs below $25k, 2.5% for AGIs $25k-50k, 2.3% for AGIs $50k-75k, 0.3% for AGIs $75k-100k, 0.8% for AGIs $100k-200k)
Taxable individual retirement arrangement distribution: $16,853 (reported on 9.6% of returns)
70770:
$16,853
Louisiana:
$16,085
(% of AGI for various income ranges: 2.6% for AGIs below $25k, 1.9% for AGIs $25k-50k, 3.6% for AGIs $50k-75k, 2.8% for AGIs $75k-100k, 4.0% for AGIs $100k-200k)
Total itemized deductions: $19,527 (18% of AGI, reported on 24.9% of returns)
Here:
$19,527
State:
$23,585
Here:
17.8% of AGI
State:
18.1% of AGI
(% of AGI for various income ranges: 5.7% for AGIs below $25k, 6.8% for AGIs $25k-50k, 9.3% for AGIs $50k-75k, 8.3% for AGIs $75k-100k, 9.6% for AGIs $100k-200k, 7.7% for AGIs over 200k)
Charity contributions: $4,261 (reported on 18.6% of returns)
Here:
$4,261
State:
$5,533
(% of AGI for various income ranges: 1.0% for AGIs $25k-50k, 1.4% for AGIs $50k-75k, 1.2% for AGIs $75k-100k, 1.9% for AGIs $100k-200k, 1.6% for AGIs over 200k)
Taxes paid: $5,040 (reported on 24.3% of returns)
70770:
$5,040
State:
$6,282
(% of AGI for various income ranges: 0.5% for AGIs below $25k, 1.1% for AGIs $25k-50k, 1.5% for AGIs $50k-75k, 1.7% for AGIs $75k-100k, 2.8% for AGIs $100k-200k, 3.7% for AGIs over 200k)
Earned income credit: $2,257 (reported on 15.8% of returns)
Here:
$2,257
State:
$2,633
(% of AGI for various income ranges: 5.9% for AGIs below $25k, 1.1% for AGIs $25k-50k)
Percentage of individuals using paid preparers for their 2012 taxes: 49.7%
Here:
50%
State:
57%
(% for various income ranges: 39.3% for AGIs below $25k, 46.5% for AGIs $25k-50k, 57.7% for AGIs $50k-75k, 60.0% for AGIs $75k-100k, 62.5% for AGIs $100k-200k, 66.7% for AGIs over 200k)
Averages for the 2004 tax year for zip code 70770, filed in 2005:
Average Adjusted Gross Income (AGI) in 2004: $43,865 (Individual Income Tax Returns)
Here:
$43,865
State:
$39,411
Salary/wage: $40,793 (reported on 87.6% of returns)
Here:
$40,793
State:
$34,434
(% of AGI for various income ranges: 96.9% for AGIs below $10k, 74.9% for AGIs $10k-25k, 80.1% for AGIs $25k-50k, 85.6% for AGIs $50k-75k, 88.8% for AGIs $75k-100k, 73.6% for AGIs over 100k)
Taxable interest for individuals: $1,284 (reported on 43.2% of returns)
This zip code:
$1,284
Louisiana:
$1,606
(% of AGI for various income ranges: 3.3% for AGIs below $10k, 1.4% for AGIs $10k-25k, 0.9% for AGIs $25k-50k, 0.3% for AGIs $50k-75k, 0.3% for AGIs $75k-100k, 3.3% for AGIs over 100k)
Taxable dividends: $2,173 (reported on 16.5% of returns)
Here:
$2,173
State:
$3,235
(% of AGI for various income ranges: 0.5% for AGIs below $10k, 0.6% for AGIs $10k-25k, 0.3% for AGIs $25k-50k, 0.4% for AGIs $50k-75k, 0.8% for AGIs $75k-100k, 1.9% for AGIs over 100k)
Net capital gain/loss: +$2,220 (reported on 11.6% of returns)
Here:
+$2,220
State:
+$8,531
(% of AGI for various income ranges: -0.8% for AGIs below $10k, -0.4% for AGIs $10k-25k, -0.1% for AGIs $25k-50k, 0.2% for AGIs $50k-75k, 0.9% for AGIs $75k-100k, 1.9% for AGIs over 100k)
Profit/loss from business: +$6,257 (reported on 14.6% of returns)
Here:
+$6,257
State:
+$9,128
(% of AGI for various income ranges: 2.7% for AGIs below $10k, 4.1% for AGIs $10k-25k, 3.3% for AGIs $25k-50k, 2.1% for AGIs $50k-75k, 0.2% for AGIs $75k-100k, 1.7% for AGIs over 100k)
IRA payment deduction: $3,233 (reported on 1.8% of returns)
70770:
$3,233
Louisiana:
$3,055
Total itemized deductions: $16,699 (23% of AGI, reported on 26.2% of returns)
Here:
$16,699
State:
$18,222
Here:
22.5% of AGI
State:
20.3% of AGI
(% of AGI for various income ranges: 4.2% for AGIs $10k-25k, 9.2% for AGIs $25k-50k, 10.9% for AGIs $50k-75k, 9.7% for AGIs $75k-100k, 12.8% for AGIs over 100k)
Charity contributions deductions: $4,105 (5% of AGI, reported on 22.0% of returns)
Here:
$4,105
State:
$4,190
Here:
5.4% of AGI
State:
4.4% of AGI
(% of AGI for various income ranges: 0.7% for AGIs $10k-25k, 1.1% for AGIs $25k-50k, 2.0% for AGIs $50k-75k, 2.2% for AGIs $75k-100k, 3.6% for AGIs over 100k)
Total tax: $5,359 (reported on 78.9% of returns)
70770:
$5,359
State:
$6,529
(% of AGI for various income ranges: 3.0% for AGIs below $10k, 3.9% for AGIs $10k-25k, 7.0% for AGIs $25k-50k, 8.3% for AGIs $50k-75k, 11.0% for AGIs $75k-100k, 15.1% for AGIs over 100k)
Earned income credit: $1,893 (reported on 13.6% of returns)
Here:
$1,893
State:
$2,103
Percentage of individuals using paid preparers for their 2004 taxes: 52.0%
Here:
52%
State:
61%
(% for various income ranges: 40.1% for AGIs below $10k, 49.4% for AGIs $10k-25k, 52.7% for AGIs $25k-50k, 58.3% for AGIs $50k-75k, 58.8% for AGIs $75k-100k, 58.9% for AGIs over 100k)
Notable locations in zip code 70770: Camp Ruth Lee (A), Indian Mound (B), Central Fire Department Station 34 (C), Pride Volunteer Fire Department Station 10 (D). Display/hide their locations on the map
Size of family households: 551 2-persons, 224 3-persons, 145 4-persons, 61 5-persons
Size of nonfamily households: 185 1-person, 78 2-persons
221 married couples with children.
120 single-parent households (33 men, 87 women).
98.8% of residents of 70770 zip code speak English at home.
0.8% of residents speak Spanish at home (100% very well).
1.0% of residents speak other Indo-European language at home (44% very well, 56% well).
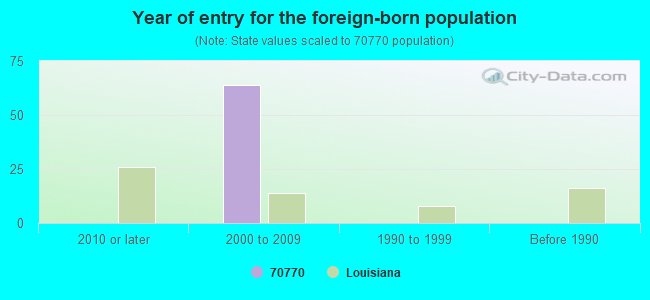
Foreign born population: 67 (2.1%) (76.0% of them are naturalized citizens)
This zip code:
2.1%
Whole state:
4.2%
72%Honduras
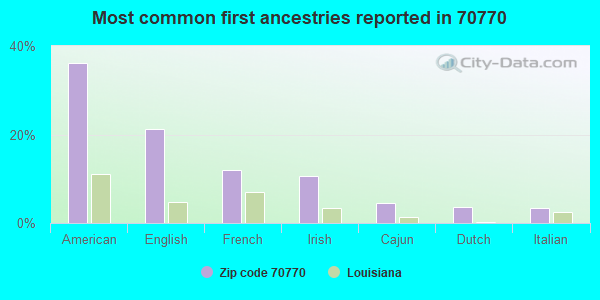
36%American
21%English
12%French
11%Irish
5%Cajun
4%Dutch
3%Italian
Year of entry for the foreign-born population
02010 or later
642000 to 2009
01990 to 1999
0Before 1990
Facilities with environmental interests located in this zip code:
NORTHEAST ELEMENTARY SCHOOL (16477 PRIDE-PORT HUDSON ROAD in PRIDE, LA)
(Geographic Names Information System) (National Center for Education Statistics) - STATE ID-017064 Organizations: EAST BATON ROUGE PARISH SCHOOL BOARD (SCHOOL DISTRICT)
Alternative names: EAST BATON ROUGE PARISH SCHOOL
ALLEN'S LOT CLEARING AIR CURTAIN DESTRUC (20563 LIBERTY RD in PRIDE, LA)
AIR MINOR (AIRS/AFS) Business SIC classification: HIGHWAY AND STREET CONSTRUCTION, EXCEPT ELEVATED HIGHWAYS Alternative names: PORT. AIR CURTAIN DR
OPEN DOOR BAPTIST CHURCH (14759 DENHAM ROAD in PRIDE, LA)
National Pollutant Discharge Elimination System NON-MAJOR (Tracking pollutant discharge elimination systems) - permit Business SIC classification: SANITARY SERVICES
PRIDE GROCERY (23393 LIBERTY ROAD in PRIDE, LA)
National Pollutant Discharge Elimination System NON-MAJOR (Tracking pollutant discharge elimination systems) - permit Business SIC classification: SEWERAGE SYSTEMS
Housing units lacking complete plumbing facilities: 6.8% Housing units lacking complete kitchen facilities: 7.7%
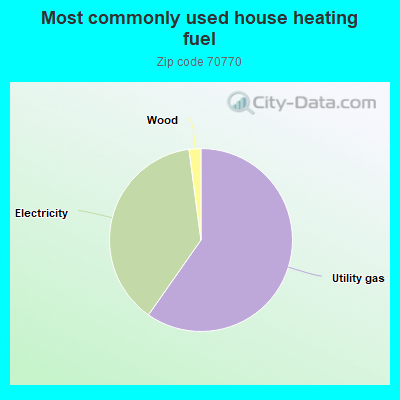
59.8%Utility gas
38.2%Electricity
2.1%Wood
Population in 1990: 5,260.
Place of birth for U.S.-born residents:
This state: 2,697
Midwest: 155
South: 213
West: 71
67% of the 70770 zip code residents lived in the same house 5 years ago. Out of people who lived in different houses, 79% lived in this county. Out of people who lived in different counties, 50% lived in Louisiana.
97% of the 70770 zip code residents lived in the same house 1 year ago. Out of people who lived in different houses, 42% moved from this county. Out of people who lived in different houses, 70% moved from different state.
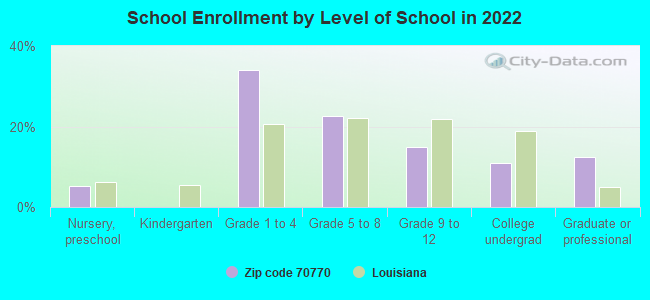
Private vs. public school enrollment:
Students in private schools in grades 1 to 8 (elementary and middle school): 136
Here:
50.0%
Louisiana:
19.6%
Students in private schools in grades 9 to 12 (high school): 20
Here:
29.4%
Louisiana:
18.3%
Students in private undergraduate colleges:
Here:
0.0%
Louisiana:
17.4%
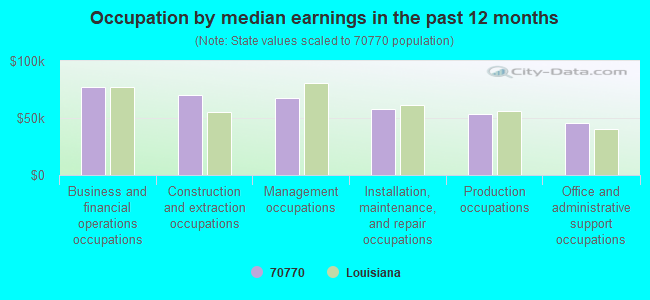
Occupation by median earnings in the past 12 months ($)
76,894Business and financial operations occupations
70,574Construction and extraction occupations
67,165Management occupations
58,204Installation, maintenance, and repair occupations
53,560Production occupations
45,189Office and administrative support occupations
Top industries in this zip code by the number of employees in 2005:
Real Estate and Rental and Leasing: Video Tape and Disc Rental (20-49 employees: 1 establishment)
Health Care and Social Assistance: Child Day Care Services (10-19: 1)
Construction: Plumbing, Heating, and Air-Conditioning Contractors (5-9: 1, 1-4: 2)
Other Services (except Public Administration): Religious Organizations (5-9: 1)
Construction: Commercial and Institutional Building Construction (5-9: 1)
Professional, Scientific, and Technical Services: Building Inspection Services (1-4: 1)
Wholesale Trade: Other Miscellaneous Nondurable Goods Merchant Wholesalers (1-4: 1)
Fatal accident statistics in 2014:
Fatal accident count: 1
Vehicles involved in fatal accidents: 2
Fatal accidents caused by drunken drivers: 0
Fatalities: 1
Persons involved in fatal accidents: 2
Pedestrians involved in fatal accidents: 0
Fatal accident statistics in 2011:
Fatal accident count: 1
Vehicles involved in fatal accidents: 1
Fatal accidents caused by drunken drivers: 0
Fatalities: 1
Persons involved in fatal accidents: 1
Pedestrians involved in fatal accidents: 0
Home Mortgage Disclosure Act Aggregated Statistics For Year 2009 (Based on 4 partial tracts)
A) FHA, FSA/RHS & VA Home Purchase Loans
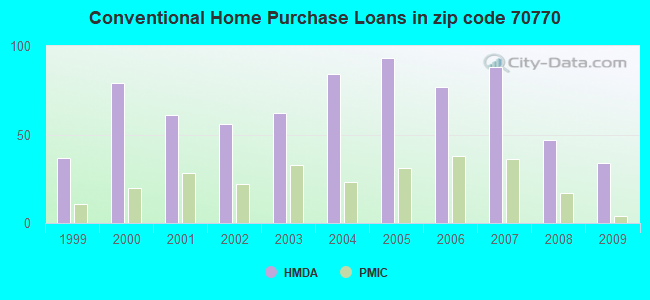
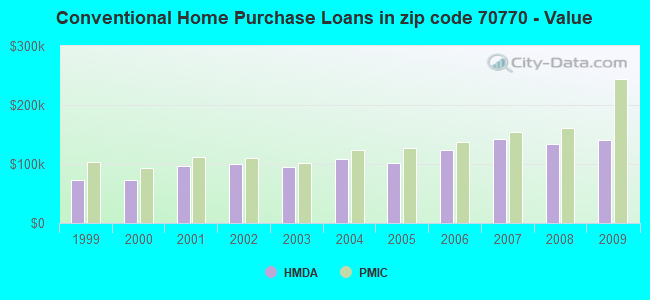
B) Conventional Home Purchase Loans
C) Refinancings
D) Home Improvement Loans
F) Non-occupant Loans on < 5 Family Dwellings (A B C & D)
G) Loans On Manufactured Home Dwelling (A B C & D)
Number
Average Value
Number
Average Value
Number
Average Value
Number
Average Value
Number
Average Value
Number
Average Value
LOANS ORIGINATED
40
$148,334
34
$141,514
139
$145,150
17
$76,392
7
$85,204
20
$71,707
APPLICATIONS APPROVED, NOT ACCEPTED
2
$168,955
4
$189,640
17
$156,238
1
$50,510
1
$123,820
3
$67,350
APPLICATIONS DENIED
8
$144,260
7
$96,191
42
$146,140
4
$20,920
1
$100,110
8
$74,212
APPLICATIONS WITHDRAWN
7
$144,626
8
$183,655
42
$157,208
2
$170,730
1
$213,530
2
$43,465
FILES CLOSED FOR INCOMPLETENESS
1
$154,320
0
$0
8
$144,282
1
$75,400
0
$0
2
$76,110
Aggregated Statistics For Year 2008 (Based on 4 partial tracts)
A) FHA, FSA/RHS & VA Home Purchase Loans
B) Conventional Home Purchase Loans
C) Refinancings
D) Home Improvement Loans
F) Non-occupant Loans on < 5 Family Dwellings (A B C & D)
G) Loans On Manufactured Home Dwelling (A B C & D)
Number
Average Value
Number
Average Value
Number
Average Value
Number
Average Value
Number
Average Value
Number
Average Value
LOANS ORIGINATED
33
$136,729
47
$134,698
81
$142,639
29
$51,031
10
$95,339
28
$62,456
APPLICATIONS APPROVED, NOT ACCEPTED
3
$178,237
5
$78,198
12
$165,050
2
$122,835
0
$0
5
$70,694
APPLICATIONS DENIED
8
$123,840
21
$99,532
50
$133,866
17
$64,122
6
$126,785
20
$68,490
APPLICATIONS WITHDRAWN
1
$96,510
8
$103,169
15
$144,333
1
$136,110
0
$0
6
$77,598
FILES CLOSED FOR INCOMPLETENESS
0
$0
2
$104,755
7
$127,023
0
$0
1
$85,990
0
$0
Aggregated Statistics For Year 2007 (Based on 4 partial tracts)
A) FHA, FSA/RHS & VA Home Purchase Loans
B) Conventional Home Purchase Loans
C) Refinancings
D) Home Improvement Loans
F) Non-occupant Loans on < 5 Family Dwellings (A B C & D)
G) Loans On Manufactured Home Dwelling (A B C & D)
Number
Average Value
Number
Average Value
Number
Average Value
Number
Average Value
Number
Average Value
Number
Average Value
LOANS ORIGINATED
22
$117,986
88
$142,945
111
$121,316
28
$43,572
8
$100,635
25
$59,387
APPLICATIONS APPROVED, NOT ACCEPTED
1
$36,280
14
$107,210
31
$138,378
2
$24,065
1
$77,210
5
$76,012
APPLICATIONS DENIED
5
$149,162
21
$111,288
77
$120,434
28
$45,550
6
$94,737
24
$53,073
APPLICATIONS WITHDRAWN
4
$140,228
13
$119,908
28
$142,085
6
$61,445
3
$131,483
8
$51,104
FILES CLOSED FOR INCOMPLETENESS
0
$0
4
$179,940
8
$148,279
0
$0
0
$0
0
$0
Aggregated Statistics For Year 2006 (Based on 4 partial tracts)
A) FHA, FSA/RHS & VA Home Purchase Loans
B) Conventional Home Purchase Loans
C) Refinancings
D) Home Improvement Loans
F) Non-occupant Loans on < 5 Family Dwellings (A B C & D)
G) Loans On Manufactured Home Dwelling (A B C & D)
Number
Average Value
Number
Average Value
Number
Average Value
Number
Average Value
Number
Average Value
Number
Average Value
LOANS ORIGINATED
11
$120,169
77
$123,923
115
$110,817
29
$31,894
5
$81,840
23
$55,502
APPLICATIONS APPROVED, NOT ACCEPTED
1
$150,040
19
$101,283
26
$123,176
4
$29,470
2
$77,160
5
$65,732
APPLICATIONS DENIED
2
$75,540
32
$99,882
82
$114,137
35
$64,690
2
$37,570
25
$59,631
APPLICATIONS WITHDRAWN
2
$129,425
8
$135,810
48
$119,411
3
$107,577
0
$0
3
$62,570
FILES CLOSED FOR INCOMPLETENESS
1
$142,140
5
$140,528
24
$122,226
1
$39,480
0
$0
0
$0
Aggregated Statistics For Year 2005 (Based on 4 partial tracts)
A) FHA, FSA/RHS & VA Home Purchase Loans
B) Conventional Home Purchase Loans
C) Refinancings
D) Home Improvement Loans
F) Non-occupant Loans on < 5 Family Dwellings (A B C & D)
G) Loans On Manufactured Home Dwelling (A B C & D)
Number
Average Value
Number
Average Value
Number
Average Value
Number
Average Value
Number
Average Value
Number
Average Value
LOANS ORIGINATED
21
$94,210
93
$102,322
120
$99,934
29
$33,728
11
$62,996
26
$54,385
APPLICATIONS APPROVED, NOT ACCEPTED
1
$141,930
12
$73,080
32
$89,055
4
$35,982
0
$0
8
$51,851
APPLICATIONS DENIED
4
$94,408
31
$84,262
91
$110,352
26
$26,716
1
$94,540
25
$49,873
APPLICATIONS WITHDRAWN
3
$55,223
16
$102,401
60
$118,654
7
$161,083
2
$127,620
4
$59,185
FILES CLOSED FOR INCOMPLETENESS
0
$0
3
$129,857
19
$113,794
0
$0
0
$0
0
$0
Aggregated Statistics For Year 2004 (Based on 4 partial tracts)
A) FHA, FSA/RHS & VA Home Purchase Loans
B) Conventional Home Purchase Loans
C) Refinancings
D) Home Improvement Loans
F) Non-occupant Loans on < 5 Family Dwellings (A B C & D)
G) Loans On Manufactured Home Dwelling (A B C & D)
Number
Average Value
Number
Average Value
Number
Average Value
Number
Average Value
Number
Average Value
Number
Average Value
LOANS ORIGINATED
16
$92,823
84
$108,778
142
$100,243
29
$35,076
10
$58,389
24
$48,343
APPLICATIONS APPROVED, NOT ACCEPTED
1
$62,450
18
$79,297
27
$92,893
5
$35,712
0
$0
9
$54,357
APPLICATIONS DENIED
7
$88,727
27
$74,378
88
$92,722
9
$45,834
2
$86,100
19
$41,551
APPLICATIONS WITHDRAWN
2
$81,735
6
$129,418
68
$115,205
1
$96,880
0
$0
2
$95,740
FILES CLOSED FOR INCOMPLETENESS
1
$62,300
4
$118,272
12
$108,485
0
$0
1
$134,550
0
$0
Aggregated Statistics For Year 2003 (Based on 4 partial tracts)
A) FHA, FSA/RHS & VA Home Purchase Loans
B) Conventional Home Purchase Loans
C) Refinancings
D) Home Improvement Loans
F) Non-occupant Loans on < 5 Family Dwellings (A B C & D)
Number
Average Value
Number
Average Value
Number
Average Value
Number
Average Value
Number
Average Value
LOANS ORIGINATED
35
$99,997
62
$94,850
269
$103,270
28
$33,170
7
$68,999
APPLICATIONS APPROVED, NOT ACCEPTED
1
$111,650
9
$87,410
55
$95,600
4
$33,328
2
$65,805
APPLICATIONS DENIED
6
$72,355
16
$69,065
88
$90,647
18
$23,260
1
$68,530
APPLICATIONS WITHDRAWN
0
$0
4
$120,450
64
$100,959
2
$3,510
2
$47,380
FILES CLOSED FOR INCOMPLETENESS
2
$123,435
0
$0
17
$94,307
0
$0
2
$44,715
Aggregated Statistics For Year 2002 (Based on 4 partial tracts)
A) FHA, FSA/RHS & VA Home Purchase Loans
B) Conventional Home Purchase Loans
C) Refinancings
D) Home Improvement Loans
F) Non-occupant Loans on < 5 Family Dwellings (A B C & D)
Number
Average Value
Number
Average Value
Number
Average Value
Number
Average Value
Number
Average Value
LOANS ORIGINATED
22
$93,388
56
$99,764
204
$94,421
31
$23,222
3
$101,810
APPLICATIONS APPROVED, NOT ACCEPTED
1
$54,190
15
$57,867
41
$73,351
8
$23,785
1
$54,640
APPLICATIONS DENIED
2
$88,290
36
$62,800
61
$76,787
16
$18,895
3
$74,317
APPLICATIONS WITHDRAWN
2
$102,565
6
$90,005
40
$95,870
0
$0
0
$0
FILES CLOSED FOR INCOMPLETENESS
1
$73,700
4
$176,390
29
$102,118
0
$0
0
$0
Aggregated Statistics For Year 2001 (Based on 4 partial tracts)
A) FHA, FSA/RHS & VA Home Purchase Loans
B) Conventional Home Purchase Loans
C) Refinancings
D) Home Improvement Loans
F) Non-occupant Loans on < 5 Family Dwellings (A B C & D)
Number
Average Value
Number
Average Value
Number
Average Value
Number
Average Value
Number
Average Value
LOANS ORIGINATED
26
$89,822
61
$95,794
225
$89,964
31
$18,728
8
$67,560
APPLICATIONS APPROVED, NOT ACCEPTED
2
$108,365
12
$51,682
32
$65,828
3
$32,803
1
$24,570
APPLICATIONS DENIED
4
$91,755
29
$47,962
76
$72,329
16
$18,559
4
$39,100
APPLICATIONS WITHDRAWN
1
$70,190
4
$93,798
42
$86,799
1
$41,480
0
$0
FILES CLOSED FOR INCOMPLETENESS
0
$0
1
$49,130
9
$109,023
0
$0
0
$0
Aggregated Statistics For Year 2000 (Based on 4 partial tracts)
A) FHA, FSA/RHS & VA Home Purchase Loans
B) Conventional Home Purchase Loans
C) Refinancings
D) Home Improvement Loans
F) Non-occupant Loans on < 5 Family Dwellings (A B C & D)
Number
Average Value
Number
Average Value
Number
Average Value
Number
Average Value
Number
Average Value
LOANS ORIGINATED
33
$83,243
79
$73,346
80
$74,555
26
$13,142
4
$54,818
APPLICATIONS APPROVED, NOT ACCEPTED
0
$0
12
$62,872
22
$77,839
6
$25,013
1
$27,200
APPLICATIONS DENIED
5
$51,836
34
$49,612
66
$63,245
15
$28,384
2
$36,415
APPLICATIONS WITHDRAWN
2
$89,445
2
$106,305
36
$66,277
4
$9,075
0
$0
FILES CLOSED FOR INCOMPLETENESS
1
$69,310
3
$94,467
8
$79,275
0
$0
0
$0
Aggregated Statistics For Year 1999 (Based on 2 partial tracts)
A) FHA, FSA/RHS & VA Home Purchase Loans
B) Conventional Home Purchase Loans
C) Refinancings
D) Home Improvement Loans
F) Non-occupant Loans on < 5 Family Dwellings (A B C & D)
Detailed PMIC statistics for the following Tracts:0043.02
, 0047.00
2002 - 2018 National Fire Incident Reporting System (NFIRS) incidents
Based on the data from the years 2002 - 2018 the average number of fires per year is 31. The highest number of fires - 71 took place in 2011, and the least - 2 in 2002. The data has a rising trend.
When looking into fire subcategories, the most incidents belonged to: Outside Fires (72.3%), and Structure Fires (19.7%).
Fire incident types reported to NFIRS in Zip Code 70770
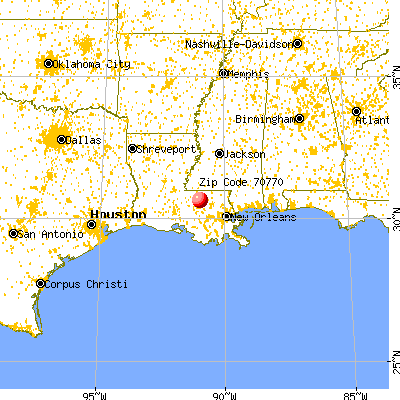


 Nearest zip codes: 70739, 70706, 70818, 70777, 70714, 70791.


 Based on the data from the years 2002 - 2018 the average number of fires per year is 31. The highest number of fires - 71 took place in 2011, and the least - 2 in 2002. The data has a rising trend.
 When looking into fire subcategories, the most incidents belonged to: Outside Fires (72.3%), and Structure Fires (19.7%).