Averages for the 2020 tax year for zip code 71007, filed in 2021:
Average Adjusted Gross Income (AGI) in 2020: $49,412 (Individual Income Tax Returns)
Here:
$49,412
State:
$60,757
Salary/wage: $42,562 (reported on 77.1% of returns)
Here:
$42,562
State:
$50,882
(% of AGI for various income ranges: 1084.3% for AGIs below $25k, 3548.9% for AGIs $25k-50k, 4986.0% for AGIs $50k-75k, 10183.3% for AGIs $75k-100k, 18293.3% for AGIs $100k-200k)
Taxable interest for individuals: $364 (reported on 29.2% of returns)
This zip code:
$364
Louisiana:
$1,576
(% of AGI for various income ranges: 7.1% for AGIs below $25k, 2.2% for AGIs $25k-50k, 8.0% for AGIs $50k-75k, 23.3% for AGIs $75k-100k, 93.3% for AGIs $100k-200k)
Ordinary dividends: $2,225 (reported on 8.3% of returns)
Here:
$2,225
State:
$7,743
(% of AGI for various income ranges: 9.3% for AGIs below $25k, 253.3% for AGIs $75k-100k)
Net capital gain/loss in AGI: +$2,600 (reported on 8.3% of returns)
Here:
+$2,600
State:
+$16,917
(% of AGI for various income ranges: 346.7% for AGIs $75k-100k)
Profit/loss from business: +$775 (reported on 16.7% of returns)
Here:
+$775
State:
+$7,679
(% of AGI for various income ranges: 57.1% for AGIs below $25k, 230.0% for AGIs $75k-100k)
Taxable individual retirement arrangement distribution: $10,550 (reported on 8.3% of returns)
71007:
$10,550
Louisiana:
$20,716
(% of AGI for various income ranges: 844.0% for AGIs $50k-75k)
Earned income credit: $2,210 (reported on 20.8% of returns)
Here:
$2,210
State:
$2,671
(% of AGI for various income ranges: 105.0% for AGIs below $25k, 82.2% for AGIs $25k-50k)
Percentage of individuals using paid preparers for their 2020 taxes: 91.7%
Here:
92%
State:
92%
(% for various income ranges: 89.5% for AGIs below $25k, 90.9% for AGIs $25k-50k, 85.7% for AGIs $50k-75k, 100.0% for AGIs $75k-100k, 100.0% for AGIs $100k-200k)
Averages for the 2012 tax year for zip code 71007, filed in 2013:
Average Adjusted Gross Income (AGI) in 2012: $39,880 (Individual Income Tax Returns)
Here:
$39,880
State:
$56,730
Salary/wage: $35,723 (reported on 84.3% of returns)
Here:
$35,723
State:
$45,545
(% of AGI for various income ranges: 79.0% for AGIs below $25k, 81.0% for AGIs $25k-50k, 74.4% for AGIs $50k-75k, 76.0% for AGIs $75k-100k, 70.1% for AGIs $100k-200k)
Taxable interest for individuals: $464 (reported on 27.5% of returns)
This zip code:
$464
Louisiana:
$1,804
(% of AGI for various income ranges: 0.3% for AGIs below $25k, 0.6% for AGIs $25k-50k, 0.3% for AGIs $50k-75k, 0.2% for AGIs $100k-200k)
Ordinary dividends: $660 (reported on 9.8% of returns)
Here:
$660
State:
$7,610
Profit/loss from business: +$5,988 (reported on 15.7% of returns)
Here:
+$5,988
State:
+$12,088
(% of AGI for various income ranges: 8.2% for AGIs below $25k, 4.0% for AGIs $25k-50k, 2.6% for AGIs $75k-100k)
Taxable individual retirement arrangement distribution: $8,225 (reported on 7.8% of returns)
71007:
$8,225
Louisiana:
$16,085
Total itemized deductions: $20,155 (27% of AGI, reported on 21.6% of returns)
Here:
$20,155
State:
$23,585
Here:
26.8% of AGI
State:
18.1% of AGI
(% of AGI for various income ranges: 15.2% for AGIs $25k-50k, 14.4% for AGIs $50k-75k, 14.5% for AGIs $100k-200k)
Charity contributions: $5,900 (reported on 17.6% of returns)
Here:
$5,900
State:
$5,533
(% of AGI for various income ranges: 3.4% for AGIs $25k-50k, 3.0% for AGIs $50k-75k, 4.0% for AGIs $100k-200k)
Taxes paid: $3,555 (reported on 21.6% of returns)
71007:
$3,555
State:
$6,282
(% of AGI for various income ranges: 1.1% for AGIs $25k-50k, 2.9% for AGIs $50k-75k, 3.5% for AGIs $100k-200k)
Earned income credit: $2,400 (reported on 23.5% of returns)
Here:
$2,400
State:
$2,633
(% of AGI for various income ranges: 8.9% for AGIs below $25k, 1.0% for AGIs $25k-50k)
Percentage of individuals using paid preparers for their 2012 taxes: 58.8%
Here:
59%
State:
57%
(% for various income ranges: 52.2% for AGIs below $25k, 53.8% for AGIs $25k-50k, 100.0% for AGIs $50k-75k, 75.0% for AGIs $100k-200k)
Averages for the 2004 tax year for zip code 71007, filed in 2005:
Average Adjusted Gross Income (AGI) in 2004: $38,197 (Individual Income Tax Returns)
Here:
$38,197
State:
$39,411
Salary/wage: $36,473 (reported on 86.2% of returns)
Here:
$36,473
State:
$34,434
(% of AGI for various income ranges: 89.2% for AGIs below $10k, 82.8% for AGIs $10k-25k, 82.6% for AGIs $25k-50k, 79.1% for AGIs $50k-75k, 87.4% for AGIs $75k-100k, 79.1% for AGIs over 100k)
Taxable interest for individuals: $586 (reported on 32.9% of returns)
This zip code:
$586
Louisiana:
$1,606
(% of AGI for various income ranges: 0.7% for AGIs below $10k, 0.7% for AGIs $10k-25k, 0.9% for AGIs $25k-50k, 0.5% for AGIs $50k-75k, 0.1% for AGIs $75k-100k, 0.3% for AGIs over 100k)
Taxable dividends: $486 (reported on 14.2% of returns)
Here:
$486
State:
$3,235
Total itemized deductions: $16,280 (23% of AGI, reported on 26.8% of returns)
Here:
$16,280
State:
$18,222
Here:
23.1% of AGI
State:
20.3% of AGI
(% of AGI for various income ranges: 10.8% for AGIs $25k-50k, 12.0% for AGIs $50k-75k, 16.2% for AGIs $75k-100k, 14.3% for AGIs over 100k)
Charity contributions deductions: $4,235 (6% of AGI, reported on 23.3% of returns)
Here:
$4,235
State:
$4,190
Here:
5.8% of AGI
State:
4.4% of AGI
(% of AGI for various income ranges: 1.3% for AGIs $25k-50k, 3.0% for AGIs $50k-75k, 3.6% for AGIs $75k-100k, 4.5% for AGIs over 100k)
Total tax: $4,886 (reported on 71.2% of returns)
71007:
$4,886
State:
$6,529
(% of AGI for various income ranges: 2.6% for AGIs below $10k, 2.9% for AGIs $10k-25k, 6.6% for AGIs $25k-50k, 8.8% for AGIs $50k-75k, 10.9% for AGIs $75k-100k, 15.3% for AGIs over 100k)
Earned income credit: $1,781 (reported on 23.1% of returns)
Here:
$1,781
State:
$2,103
Percentage of individuals using paid preparers for their 2004 taxes: 64.5%
Here:
65%
State:
61%
(% for various income ranges: 52.6% for AGIs below $10k, 67.8% for AGIs $10k-25k, 64.2% for AGIs $25k-50k, 69.1% for AGIs $50k-75k, 70.5% for AGIs $75k-100k, 71.4% for AGIs over 100k)
Household received Food Stamps/SNAP in the past 12 months: 0 Household did not receive Food Stamps/SNAP in the past 12 months: 573
Women who did not have a birth in the past 12 months: 269 (138 now married, 130 unmarried)
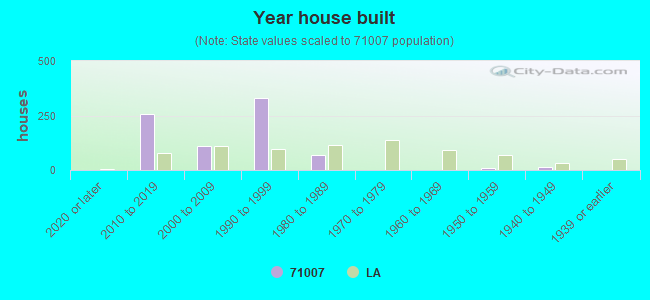
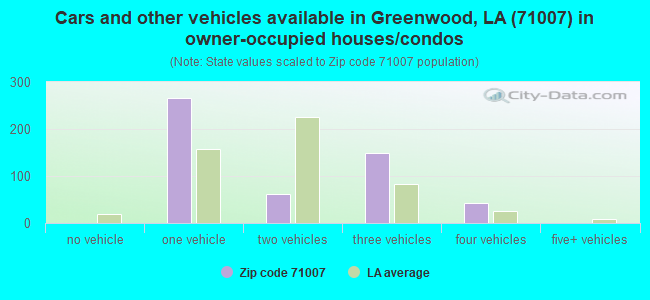
Housing units in zip code 71007 with a mortgage: 163 Median monthly owner costs for units with a mortgage: $1,017 Median monthly owner costs for units without a mortgage: $447
Residents with income below the poverty level in 2022:
This zip code:
4.1%
Whole state:
18.6%
Residents with income below 50% of the poverty level in 2022:
This zip code:
2.4%
Whole state:
10.1%
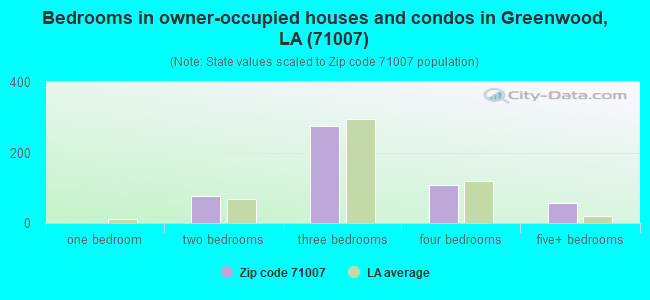
Median number of rooms in houses and condos:
Here:
6.2
State:
6.2
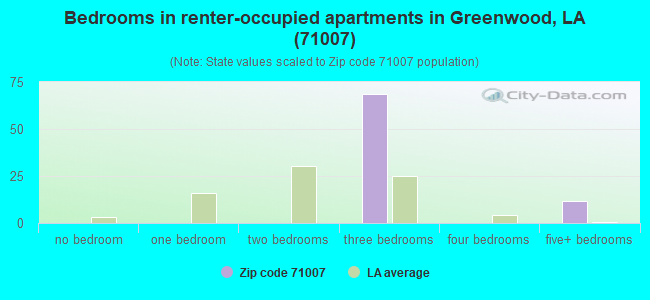
Median number of rooms in apartments:
Here:
5.4
State:
4.4
Notable locations in this zip code not listed on our city pages
Size of family households: 141 2-persons, 102 3-persons, 135 4-persons, 8 5-persons
Size of nonfamily households: 200 1-person
135 married couples with children.
60 single-parent households (60 men).
All residents speak English at home
Foreign born population: 0 (0.0%)
:
0.0%
Whole state:
4.2%
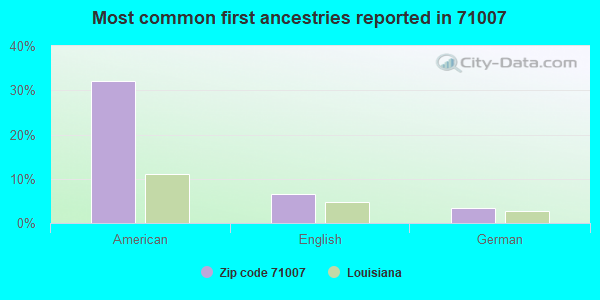
32%American
7%English
3%German
Facilities with environmental interests located in this zip code:
B & J AUTOMOTIVE (BUNCOMB RD 3 M E HWY 79 in BETHANY, LA)
Small Quantity Generators, between 100 kg and 1000 kg of hazardous waste/month (Resource Conservation and Recovery Act (tracking hazardous waste)) - notification Organizations: JAMES R LEWIS (CONTACT/OWNER)
Housing units lacking complete plumbing facilities: 4.0%
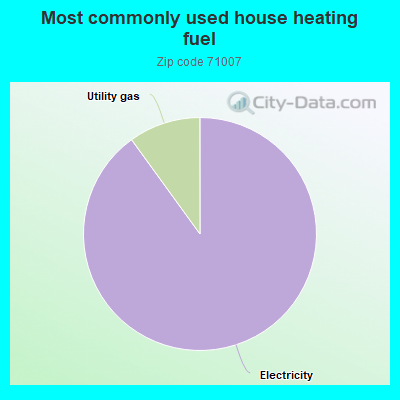
90.2%Electricity
10.0%Utility gas
Population in 1990: 404. Population change in the 1990s: +928 (+229.7%).
Place of birth for U.S.-born residents:
This state: 1,140
Midwest: 7
South: 115
66% of the 71007 zip code residents lived in the same house 5 years ago. Out of people who lived in different houses, 76% lived in this county. Out of people who lived in different counties, 50% lived in Louisiana.
99% of the 71007 zip code residents lived in the same house 1 year ago. Out of people who lived in different houses, 130% moved from this county.
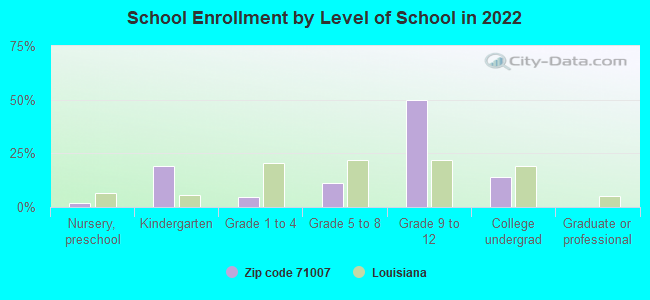
Private vs. public school enrollment:
Students in private schools in grades 1 to 8 (elementary and middle school):
Here:
0.0%
Louisiana:
19.6%
Students in private schools in grades 9 to 12 (high school):
Here:
0.0%
Louisiana:
18.3%
Students in private undergraduate colleges:
Here:
0.0%
Louisiana:
17.4%
Top industries in this zip code by the number of employees in 2005:
Accommodation and Food Services: Recreational and Vacation Camps (except Campgrounds) (20-49 employees: 1 establishment)
Wholesale Trade: Industrial Machinery and Equipment Merchant Wholesalers (20-49: 1)
Professional, Scientific, and Technical Services: Engineering Services (10-19: 1)
Construction: Plumbing, Heating, and Air-Conditioning Contractors (5-9: 1, 1-4: 1)
Construction: Electrical Contractors (1-4: 1)
Construction: Commercial and Institutional Building Construction (1-4: 1)
Construction: Structural Steel and Precast Concrete Contractors (1-4: 1)
Other Services (except Public Administration): Religious Organizations (1-4: 1)
Fatal accident statistics in 2013:
Fatal accident count: 1
Vehicles involved in fatal accidents: 1
Fatal accidents caused by drunken drivers: 0
Fatalities: 1
Persons involved in fatal accidents: 1
Pedestrians involved in fatal accidents: 0
Fatal accident statistics in 2012:
Fatal accident count: 2
Vehicles involved in fatal accidents: 4
Fatal accidents caused by drunken drivers: 0
Fatalities: 2
Persons involved in fatal accidents: 4
Pedestrians involved in fatal accidents: 0
Home Mortgage Disclosure Act Aggregated Statistics For Year 2009 (Based on 2 partial tracts)
A) FHA, FSA/RHS & VA Home Purchase Loans
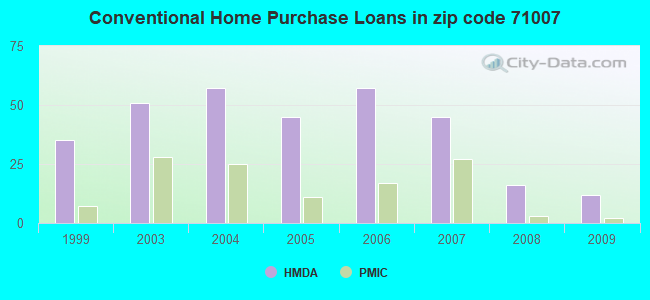
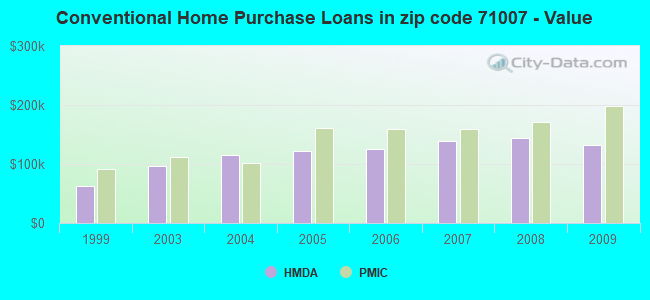
B) Conventional Home Purchase Loans
C) Refinancings
D) Home Improvement Loans
F) Non-occupant Loans on < 5 Family Dwellings (A B C & D)
G) Loans On Manufactured Home Dwelling (A B C & D)
Number
Average Value
Number
Average Value
Number
Average Value
Number
Average Value
Number
Average Value
Number
Average Value
LOANS ORIGINATED
26
$146,659
12
$132,169
59
$156,569
7
$32,234
4
$121,375
17
$84,958
APPLICATIONS APPROVED, NOT ACCEPTED
3
$148,530
4
$113,230
12
$160,544
1
$9,780
0
$0
6
$100,738
APPLICATIONS DENIED
9
$152,240
7
$73,663
38
$161,205
8
$42,155
4
$175,140
16
$83,038
APPLICATIONS WITHDRAWN
1
$114,860
2
$279,410
22
$177,101
1
$4,070
1
$79,830
3
$137,123
FILES CLOSED FOR INCOMPLETENESS
1
$141,740
1
$118,120
4
$198,762
2
$15,475
0
$0
2
$31,770
Aggregated Statistics For Year 2008 (Based on 2 partial tracts)
A) FHA, FSA/RHS & VA Home Purchase Loans
B) Conventional Home Purchase Loans
C) Refinancings
D) Home Improvement Loans
E) Loans on Dwellings For 5+ Families
F) Non-occupant Loans on < 5 Family Dwellings (A B C & D)
G) Loans On Manufactured Home Dwelling (A B C & D)
Number
Average Value
Number
Average Value
Number
Average Value
Number
Average Value
Number
Average Value
Number
Average Value
Number
Average Value
LOANS ORIGINATED
21
$144,611
16
$144,031
45
$134,463
7
$39,217
2
$455,360
2
$55,800
7
$73,430
APPLICATIONS APPROVED, NOT ACCEPTED
2
$84,720
0
$0
12
$154,910
1
$67,610
0
$0
0
$0
2
$48,875
APPLICATIONS DENIED
4
$138,075
7
$102,290
60
$156,132
11
$63,168
0
$0
2
$101,010
15
$62,887
APPLICATIONS WITHDRAWN
4
$177,788
2
$111,600
17
$160,716
2
$160,885
0
$0
0
$0
2
$70,465
FILES CLOSED FOR INCOMPLETENESS
2
$197,950
1
$119,750
3
$112,957
1
$272,080
0
$0
0
$0
1
$59,470
Aggregated Statistics For Year 2007 (Based on 2 partial tracts)
A) FHA, FSA/RHS & VA Home Purchase Loans
B) Conventional Home Purchase Loans
C) Refinancings
D) Home Improvement Loans
E) Loans on Dwellings For 5+ Families
F) Non-occupant Loans on < 5 Family Dwellings (A B C & D)
G) Loans On Manufactured Home Dwelling (A B C & D)
Number
Average Value
Number
Average Value
Number
Average Value
Number
Average Value
Number
Average Value
Number
Average Value
Number
Average Value
LOANS ORIGINATED
17
$121,567
45
$139,532
46
$149,196
15
$47,627
1
$299,770
4
$155,588
20
$71,074
APPLICATIONS APPROVED, NOT ACCEPTED
2
$218,720
9
$118,570
16
$131,303
1
$52,950
0
$0
1
$80,650
6
$69,513
APPLICATIONS DENIED
2
$121,785
14
$92,457
53
$117,594
24
$52,983
0
$0
1
$82,270
18
$72,364
APPLICATIONS WITHDRAWN
1
$72,500
4
$127,078
19
$139,297
2
$50,505
0
$0
0
$0
2
$78,610
FILES CLOSED FOR INCOMPLETENESS
0
$0
2
$250,080
3
$128,437
0
$0
0
$0
0
$0
0
$0
Aggregated Statistics For Year 2006 (Based on 2 partial tracts)
A) FHA, FSA/RHS & VA Home Purchase Loans
B) Conventional Home Purchase Loans
C) Refinancings
D) Home Improvement Loans
F) Non-occupant Loans on < 5 Family Dwellings (A B C & D)
G) Loans On Manufactured Home Dwelling (A B C & D)
Number
Average Value
Number
Average Value
Number
Average Value
Number
Average Value
Number
Average Value
Number
Average Value
LOANS ORIGINATED
24
$106,203
57
$124,977
55
$116,577
11
$34,584
7
$114,626
29
$76,881
APPLICATIONS APPROVED, NOT ACCEPTED
1
$78,200
11
$115,821
24
$110,718
8
$26,984
2
$42,360
6
$39,780
APPLICATIONS DENIED
1
$70,060
16
$85,584
49
$124,717
23
$42,111
2
$70,870
15
$82,275
APPLICATIONS WITHDRAWN
1
$132,780
9
$113,682
34
$142,843
2
$91,235
0
$0
2
$41,545
FILES CLOSED FOR INCOMPLETENESS
0
$0
6
$124,905
15
$150,429
0
$0
0
$0
0
$0
Aggregated Statistics For Year 2005 (Based on 2 partial tracts)
A) FHA, FSA/RHS & VA Home Purchase Loans
B) Conventional Home Purchase Loans
C) Refinancings
D) Home Improvement Loans
F) Non-occupant Loans on < 5 Family Dwellings (A B C & D)
G) Loans On Manufactured Home Dwelling (A B C & D)
Number
Average Value
Number
Average Value
Number
Average Value
Number
Average Value
Number
Average Value
Number
Average Value
LOANS ORIGINATED
19
$113,315
45
$122,480
64
$110,149
16
$42,461
4
$137,465
20
$78,568
APPLICATIONS APPROVED, NOT ACCEPTED
4
$89,198
15
$63,159
20
$91,113
7
$53,066
0
$0
12
$63,471
APPLICATIONS DENIED
5
$90,094
26
$77,826
60
$125,774
12
$57,565
3
$47,520
23
$66,762
APPLICATIONS WITHDRAWN
1
$71,680
7
$119,863
34
$172,599
3
$260,130
2
$152,740
2
$81,865
FILES CLOSED FOR INCOMPLETENESS
0
$0
2
$123,005
11
$127,744
0
$0
2
$39,510
0
$0
Aggregated Statistics For Year 2004 (Based on 2 partial tracts)
A) FHA, FSA/RHS & VA Home Purchase Loans
B) Conventional Home Purchase Loans
C) Refinancings
D) Home Improvement Loans
F) Non-occupant Loans on < 5 Family Dwellings (A B C & D)
G) Loans On Manufactured Home Dwelling (A B C & D)
Number
Average Value
Number
Average Value
Number
Average Value
Number
Average Value
Number
Average Value
Number
Average Value
LOANS ORIGINATED
33
$100,393
57
$115,102
62
$113,243
11
$35,916
3
$57,023
39
$70,724
APPLICATIONS APPROVED, NOT ACCEPTED
2
$73,720
15
$80,537
23
$106,323
3
$31,497
2
$72,090
11
$56,430
APPLICATIONS DENIED
7
$92,166
33
$79,090
64
$101,583
15
$36,657
2
$65,170
40
$62,826
APPLICATIONS WITHDRAWN
2
$144,590
7
$99,264
37
$102,684
1
$70,870
2
$50,100
8
$72,296
FILES CLOSED FOR INCOMPLETENESS
1
$129,520
2
$104,675
6
$98,432
0
$0
0
$0
2
$136,445
Aggregated Statistics For Year 2003 (Based on 2 partial tracts)
A) FHA, FSA/RHS & VA Home Purchase Loans
B) Conventional Home Purchase Loans
C) Refinancings
D) Home Improvement Loans
F) Non-occupant Loans on < 5 Family Dwellings (A B C & D)
Number
Average Value
Number
Average Value
Number
Average Value
Number
Average Value
Number
Average Value
LOANS ORIGINATED
15
$92,810
51
$96,874
127
$101,094
14
$22,576
3
$93,407
APPLICATIONS APPROVED, NOT ACCEPTED
2
$46,025
12
$73,857
27
$82,606
3
$31,227
2
$53,765
APPLICATIONS DENIED
4
$94,492
7
$70,870
53
$90,205
4
$16,902
2
$72,090
APPLICATIONS WITHDRAWN
0
$0
4
$100,808
27
$109,549
2
$8,960
1
$46,430
FILES CLOSED FOR INCOMPLETENESS
0
$0
1
$130,340
4
$120,765
0
$0
0
$0
Aggregated Statistics For Year 1999 (Based on 1 partial tract)
A) FHA, FSA/RHS & VA Home Purchase Loans
B) Conventional Home Purchase Loans
C) Refinancings
D) Home Improvement Loans
F) Non-occupant Loans on < 5 Family Dwellings (A B C & D)


 Nearest zip codes: 71033, 71129, 71047, 71119, 75692, 75642.