Estimated zip code population in 2022: 2,312 Zip code population in 2010: 1,934 Zip code population in 2000: 2,192
Houses and condos: 876 Renter-occupied apartments: 131
% of renters here:
19%
State:
32%
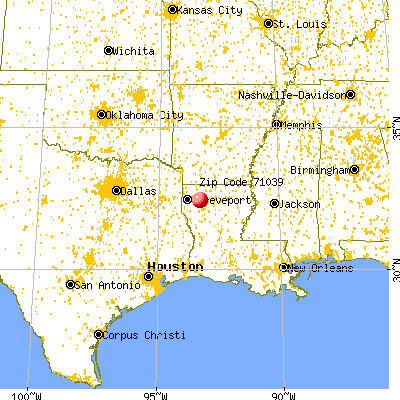
March 2022 cost of living index in zip code 71039: 80.1 (low, U.S. average is 100)
Land area: 46.1 sq. mi. Water area: 2.7 sq. mi.
Population density: 50 people per square mile
(very low).
OSM Map
General Map
Google Map
MSN Map
OSM Map
General Map
Google Map
MSN Map
OSM Map
General Map
Google Map
MSN Map
OSM Map
General Map
Google Map
MSN Map
Please wait while loading the map...
Real estate property taxes paid for housing units in 2022:
This zip code:
0.2% ($238)
Louisiana:
0.5% ($1,127)
Median real estate property taxes paid for housing units with mortgages in 2022: $278 (0.3%) Median real estate property taxes paid for housing units with no mortgage in 2022: $207 (0.2%)
Business Search- 14 Million verified businesses
Males: 981
(42.4%)
Females: 1,331
(57.6%)
For population 25 years and over in 71039:
High school or higher: 85.0%
Bachelor's degree or higher: 8.3%
Graduate or professional degree: 1.1%
Unemployed: 6.0%
Mean travel time to work (commute): 40.3 minutes
For population 15 years and over in 71039:
Never married: 34.5%
Now married: 42.6%
Separated: 3.5%
Widowed: 5.4%
Divorced: 14.1%
Zip code 71039 compared to state average:
Median house value below state average.
Hispanic race population percentage significantly below state average.
Median age below state average.
Foreign-born population percentage significantly below state average.
Renting percentage below state average.
Length of stay since moving in significantly above state average.
Number of college students significantly below state average.
Percentage of population with a bachelor's degree or higher significantly below state average.
Averages for the 2020 tax year for zip code 71039, filed in 2021:
Average Adjusted Gross Income (AGI) in 2020: $52,245 (Individual Income Tax Returns)
Here:
$52,245
State:
$60,757
Salary/wage: $48,081 (reported on 80.8% of returns)
Here:
$48,081
State:
$50,882
(% of AGI for various income ranges: 1023.5% for AGIs below $25k, 3578.1% for AGIs $25k-50k, 6881.2% for AGIs $50k-75k, 11142.5% for AGIs $75k-100k, 20416.7% for AGIs $100k-200k)
Taxable interest for individuals: $496 (reported on 29.5% of returns)
This zip code:
$496
Louisiana:
$1,576
(% of AGI for various income ranges: 5.7% for AGIs below $25k, 3.8% for AGIs $25k-50k, 11.2% for AGIs $50k-75k, 10.0% for AGIs $75k-100k, 136.7% for AGIs $100k-200k)
Ordinary dividends: $2,771 (reported on 9.0% of returns)
Here:
$2,771
State:
$7,743
(% of AGI for various income ranges: 50.6% for AGIs $25k-50k, 188.3% for AGIs $100k-200k)
Net capital gain/loss in AGI: +$5,243 (reported on 9.0% of returns)
Here:
+$5,243
State:
+$16,917
(% of AGI for various income ranges: 23.1% for AGIs $25k-50k, 550.0% for AGIs $100k-200k)
Profit/loss from business: +$9,208 (reported on 16.7% of returns)
Here:
+$9,208
State:
+$7,679
(% of AGI for various income ranges: 100.0% for AGIs below $25k, 27.5% for AGIs $25k-50k, 250.0% for AGIs $50k-75k, 1205.0% for AGIs $100k-200k)
Taxable individual retirement arrangement distribution: $17,150 (reported on 5.1% of returns)
71039:
$17,150
Louisiana:
$20,716
(% of AGI for various income ranges: 53.0% for AGIs below $25k, 705.0% for AGIs $50k-75k)
Total itemized deductions: $30,550 (reported on 2.6% of returns)
Here:
$30,550
State:
$36,265
(% of AGI for various income ranges: 381.9% for AGIs $25k-50k)
Taxes paid: $6,950 (reported on 2.6% of returns)
71039:
$6,950
State:
$6,643
(% of AGI for various income ranges: 86.9% for AGIs $25k-50k)
Earned income credit: $2,447 (reported on 21.8% of returns)
Here:
$2,447
State:
$2,671
(% of AGI for various income ranges: 127.0% for AGIs below $25k, 77.5% for AGIs $25k-50k)
Percentage of individuals using paid preparers for their 2020 taxes: 91.0%
Here:
91%
State:
92%
(% for various income ranges: 90.0% for AGIs below $25k, 89.5% for AGIs $25k-50k, 90.9% for AGIs $50k-75k, 100.0% for AGIs $75k-100k, 91.7% for AGIs $100k-200k)
Averages for the 2012 tax year for zip code 71039, filed in 2013:
Average Adjusted Gross Income (AGI) in 2012: $45,773 (Individual Income Tax Returns)
Here:
$45,773
State:
$56,730
Salary/wage: $43,475 (reported on 84.4% of returns)
Here:
$43,475
State:
$45,545
(% of AGI for various income ranges: 77.3% for AGIs below $25k, 83.6% for AGIs $25k-50k, 81.6% for AGIs $50k-75k, 88.1% for AGIs $75k-100k, 74.2% for AGIs $100k-200k)
Taxable interest for individuals: $700 (reported on 26.0% of returns)
This zip code:
$700
Louisiana:
$1,804
(% of AGI for various income ranges: 0.5% for AGIs below $25k, 0.5% for AGIs $25k-50k, 0.5% for AGIs $50k-75k, 0.2% for AGIs $75k-100k, 0.4% for AGIs $100k-200k)
Ordinary dividends: $2,112 (reported on 10.4% of returns)
Here:
$2,112
State:
$7,610
(% of AGI for various income ranges: 0.9% for AGIs below $25k, 0.7% for AGIs $50k-75k, 0.8% for AGIs $100k-200k)
Net capital gain/loss in AGI: +$900 (reported on 9.1% of returns)
Here:
+$900
State:
+$17,096
Profit/loss from business: +$1,525 (reported on 20.8% of returns)
Here:
+$1,525
State:
+$12,088
(% of AGI for various income ranges: 6.7% for AGIs below $25k, 0.6% for AGIs $50k-75k, 1.4% for AGIs $75k-100k)
Taxable individual retirement arrangement distribution: $8,717 (reported on 7.8% of returns)
71039:
$8,717
Louisiana:
$16,085
Total itemized deductions: $22,128 (28% of AGI, reported on 23.4% of returns)
Here:
$22,128
State:
$23,585
Here:
28.0% of AGI
State:
18.1% of AGI
(% of AGI for various income ranges: 10.1% for AGIs below $25k, 10.2% for AGIs $25k-50k, 12.4% for AGIs $50k-75k, 12.9% for AGIs $75k-100k, 10.9% for AGIs $100k-200k)
Charity contributions: $6,500 (reported on 19.5% of returns)
Here:
$6,500
State:
$5,533
(% of AGI for various income ranges: 3.5% for AGIs $25k-50k, 3.2% for AGIs $50k-75k, 3.2% for AGIs $75k-100k, 2.8% for AGIs $100k-200k)
Taxes paid: $3,241 (reported on 22.1% of returns)
71039:
$3,241
State:
$6,282
(% of AGI for various income ranges: 0.6% for AGIs below $25k, 1.0% for AGIs $25k-50k, 1.2% for AGIs $50k-75k, 1.9% for AGIs $75k-100k, 2.3% for AGIs $100k-200k)
Earned income credit: $2,785 (reported on 26.0% of returns)
Here:
$2,785
State:
$2,633
(% of AGI for various income ranges: 11.0% for AGIs below $25k, 1.5% for AGIs $25k-50k)
Percentage of individuals using paid preparers for their 2012 taxes: 66.2%
Here:
66%
State:
57%
(% for various income ranges: 68.8% for AGIs below $25k, 57.9% for AGIs $25k-50k, 63.6% for AGIs $50k-75k, 71.4% for AGIs $75k-100k, 75.0% for AGIs $100k-200k)
Averages for the 2004 tax year for zip code 71039, filed in 2005:
Average Adjusted Gross Income (AGI) in 2004: $31,871 (Individual Income Tax Returns)
Here:
$31,871
State:
$39,411
Salary/wage: $31,375 (reported on 87.6% of returns)
Here:
$31,375
State:
$34,434
(% of AGI for various income ranges: 87.3% for AGIs below $10k, 82.0% for AGIs $10k-25k, 84.7% for AGIs $25k-50k, 89.0% for AGIs $50k-75k, 89.2% for AGIs $75k-100k, 83.9% for AGIs over 100k)
Taxable interest for individuals: $782 (reported on 26.3% of returns)
This zip code:
$782
Louisiana:
$1,606
(% of AGI for various income ranges: 1.5% for AGIs below $10k, 1.4% for AGIs $10k-25k, 0.3% for AGIs $25k-50k, 0.6% for AGIs $50k-75k, 0.7% for AGIs $75k-100k)
Taxable dividends: $574 (reported on 8.9% of returns)
Here:
$574
State:
$3,235
(% of AGI for various income ranges: 0.3% for AGIs $10k-25k, 0.1% for AGIs $25k-50k, 0.1% for AGIs $50k-75k, 0.3% for AGIs $75k-100k)
Net capital gain/loss: +$1,000 (reported on 7.0% of returns)
Here:
+$1,000
State:
+$8,531
(% of AGI for various income ranges: 0.7% for AGIs below $10k, 0.0% for AGIs $25k-50k, 0.5% for AGIs $50k-75k, 0.3% for AGIs $75k-100k)
Profit/loss from business: +$1,074 (reported on 14.1% of returns)
Here:
+$1,074
State:
+$9,128
(% of AGI for various income ranges: 5.8% for AGIs below $10k, 1.0% for AGIs $10k-25k, -0.2% for AGIs $25k-50k, 1.1% for AGIs $50k-75k, -0.6% for AGIs $75k-100k)
Total itemized deductions: $16,587 (26% of AGI, reported on 12.0% of returns)
Here:
$16,587
State:
$18,222
Here:
26.2% of AGI
State:
20.3% of AGI
(% of AGI for various income ranges: 2.4% for AGIs $10k-25k, 5.8% for AGIs $25k-50k, 7.1% for AGIs $50k-75k, 12.5% for AGIs $75k-100k)
Charity contributions deductions: $4,420 (7% of AGI, reported on 9.0% of returns)
Here:
$4,420
State:
$4,190
Here:
7.0% of AGI
State:
4.4% of AGI
Total tax: $3,394 (reported on 66.2% of returns)
71039:
$3,394
State:
$6,529
(% of AGI for various income ranges: 1.7% for AGIs below $10k, 3.0% for AGIs $10k-25k, 5.5% for AGIs $25k-50k, 8.1% for AGIs $50k-75k, 10.4% for AGIs $75k-100k, 13.7% for AGIs over 100k)
Earned income credit: $1,972 (reported on 28.4% of returns)
Here:
$1,972
State:
$2,103
Percentage of individuals using paid preparers for their 2004 taxes: 64.9%
Here:
65%
State:
61%
(% for various income ranges: 62.5% for AGIs below $10k, 64.5% for AGIs $10k-25k, 65.6% for AGIs $25k-50k, 58.3% for AGIs $50k-75k, 78.8% for AGIs $75k-100k, 92.3% for AGIs over 100k)
Household received Food Stamps/SNAP in the past 12 months: 233 Household did not receive Food Stamps/SNAP in the past 12 months: 490
Women who had a birth in the past 12 months: 7 (1 now married, 5 unmarried) Women who did not have a birth in the past 12 months: 669 (251 now married, 417 unmarried)
Housing units in zip code 71039 with a mortgage: 332 Houses without a mortgage: 3
Median monthly owner costs for units with a mortgage: $1,058 Median monthly owner costs for units without a mortgage: $262
Residents with income below the poverty level in 2022:
This zip code:
34.1%
Whole state:
18.6%
Residents with income below 50% of the poverty level in 2022:
This zip code:
18.0%
Whole state:
10.1%
Median number of rooms in houses and condos:
Here:
5.6
State:
6.2
Median number of rooms in apartments:
Here:
4.5
State:
4.4
Notable locations in this zip code not listed on our city pages
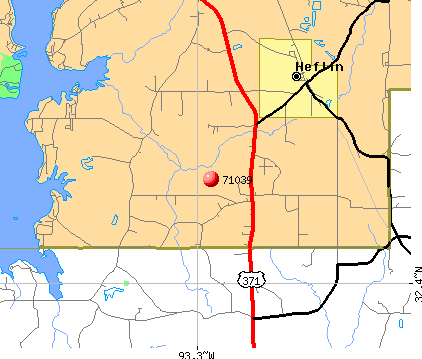
Churches in zip code 71039 include: Tillman Church (A), Carter Chapel (B), Bistineau Baptist Church (C), Mount Ealm Church (D). Display/hide their locations on the map
Streams, rivers, and creeks: Hurley Branch (A), Cooley Creek (B), Carter Creek (C), Hope Creek (D), Brushy Creek (E), Beard Branch (F), Tanyard Creek (G). Display/hide their locations on the map
Size of family households: 127 2-persons, 135 3-persons, 149 4-persons, 127 5-persons, 34 7-or-more-persons
Size of nonfamily households: 63 1-person, 44 2-persons, 10 3-persons
388 married couples with children.
257 single-parent households (242 men, 15 women).
99.1% of residents of 71039 zip code speak English at home.
0.4% of residents speak other Indo-European language at home (100% very well).
Foreign born population: 0 (0.0%)
:
0.0%
Whole state:
4.2%
31%American
12%Irish
9%English
2%African
2%French
0%British
0%German
Facilities with environmental interests located in this zip code:
RATCLIFF 27 #1 FACILITY (ON HWY 531 1.3 MI SW GO LEFT O in HEFLIN, LA)
AIR MINOR (AIRS/AFS) Business SIC classification: CRUDE PETROLEUM AND NATURAL GAS
FOGLE #2 FACILITY (2 MI W OF in HEFLIN, LA)
AIR MINOR (AIRS/AFS) Business SIC classification: CRUDE PETROLEUM AND NATURAL GAS Alternative names: KELLEY FOGLE 2 PROD
FOGLE A-1 FACILITY (2 MI NW in HEFLIN, LA)
AIR MINOR (AIRS/AFS) Business SIC classification: CRUDE PETROLEUM AND NATURAL GAS Alternative names: KELLEY FOGLE GRAY A1
GIFFORD HILL & CO INC PLT #904 (158A WEBSTER PARISH RD in HEFLIN, LA)
Conditionally Exempt Small Quantity Generators, less than 100 kg/month of hazardous waste (Resource Conservation and Recovery Act (tracking hazardous waste)) - notification
Housing units lacking complete plumbing facilities: 2.4% Housing units lacking complete kitchen facilities: 4.2%
71.4%Electricity
23.0%Utility gas
3.9%Wood
1.9%Bottled, tank, or LP gas
Population in 1990: 1,415. Population change in the 1990s: +777 (+54.9%).
Place of birth for U.S.-born residents:
This state: 2,003
South: 225
West: 80
73% of the 71039 zip code residents lived in the same house 5 years ago. Out of people who lived in different houses, 61% lived in this county. Out of people who lived in different counties, 50% lived in Louisiana.
93% of the 71039 zip code residents lived in the same house 1 year ago. Out of people who lived in different houses, 41% moved from this county. Out of people who lived in different houses, 60% moved from different state.
Private vs. public school enrollment:
Students in private schools in grades 1 to 8 (elementary and middle school):
Here:
0.0%
Louisiana:
19.6%
Students in private schools in grades 9 to 12 (high school):
Here:
0.0%
Louisiana:
18.3%
Students in private undergraduate colleges:
Here:
0.0%
Louisiana:
17.4%
Occupation by median earnings in the past 12 months ($)
79,133Management occupations
46,261Construction and extraction occupations
42,380Community and social service occupations
39,895Transportation occupations
35,829Health diagnosing and treating practitioners and other technical occupations
26,985Office and administrative support occupations
Companies with federal contracts located in this zip code:
D L CONSTRUCTION, INC. (3577 FRANKLIN RD. in HEFLIN, LA; small business)
$36,975 with Air Force for Maintenance, Repair or Alteration of Real Property -- Highways, Roads, Streets, Bridges, and Railways (includes resurfacing). Signed on 2000-02-29. Completion date: 2000-04-28.
Always best quality (633 Aubrey Beatty Road in Heflin, LA; small business)
$3,478 with Public Buildings Service for Custodial Janitorial Services. Signed on 2005-10-17. Completion date: 2005-12-31.
Top industries in this zip code by the number of employees in 2005:
Other Services (except Public Administration): Religious Organizations (5-9 employees: 1 establishment, 1-4 employees: 2 establishments)
Construction: Highway, Street, and Bridge Construction (5-9: 1)
Utilities: Water Supply and Irrigation Systems (1-4: 2)
Construction: New Single-Family Housing Construction (except Operative Builders) (1-4: 1)
Other Services (except Public Administration): Civic and Social Organizations (1-4: 1)
Mining: Support Activities for Oil and Gas Operations (1-4: 1)
Fatal accident statistics in 2014:
Fatal accident count: 1
Vehicles involved in fatal accidents: 1
Fatal accidents caused by drunken drivers: 0
Fatalities: 1
Persons involved in fatal accidents: 1
Pedestrians involved in fatal accidents: 1
Fatal accident statistics in 2012:
Fatal accident count: 1
Vehicles involved in fatal accidents: 2
Fatal accidents caused by drunken drivers: 0
Fatalities: 1
Persons involved in fatal accidents: 2
Pedestrians involved in fatal accidents: 0
Home Mortgage Disclosure Act Aggregated Statistics For Year 2003 (Based on 2 partial tracts)
A) FHA, FSA/RHS & VA Home Purchase Loans
B) Conventional Home Purchase Loans
C) Refinancings
D) Home Improvement Loans
F) Non-occupant Loans on < 5 Family Dwellings (A B C & D)
Number
Average Value
Number
Average Value
Number
Average Value
Number
Average Value
Number
Average Value
LOANS ORIGINATED
4
$76,905
23
$77,983
65
$73,075
12
$26,672
7
$81,369
APPLICATIONS APPROVED, NOT ACCEPTED
0
$0
2
$60,650
10
$69,780
1
$27,210
1
$91,780
APPLICATIONS DENIED
0
$0
12
$49,656
39
$80,024
6
$24,752
1
$54,880
APPLICATIONS WITHDRAWN
0
$0
4
$91,662
18
$87,961
4
$19,025
0
$0
FILES CLOSED FOR INCOMPLETENESS
0
$0
0
$0
1
$190,940
0
$0
0
$0
Aggregated Statistics For Year 2002 (Based on 2 partial tracts)
A) FHA, FSA/RHS & VA Home Purchase Loans
B) Conventional Home Purchase Loans
C) Refinancings
D) Home Improvement Loans
F) Non-occupant Loans on < 5 Family Dwellings (A B C & D)
Number
Average Value
Number
Average Value
Number
Average Value
Number
Average Value
Number
Average Value
LOANS ORIGINATED
2
$79,555
25
$66,302
48
$68,440
12
$19,063
3
$101,770
APPLICATIONS APPROVED, NOT ACCEPTED
0
$0
8
$48,252
10
$76,790
1
$8,760
1
$47,500
APPLICATIONS DENIED
0
$0
25
$36,324
30
$64,138
12
$9,262
4
$35,742
APPLICATIONS WITHDRAWN
0
$0
4
$95,352
14
$86,870
0
$0
1
$78,870
FILES CLOSED FOR INCOMPLETENESS
0
$0
2
$61,800
5
$55,160
0
$0
0
$0
Aggregated Statistics For Year 2001 (Based on 2 partial tracts)
A) FHA, FSA/RHS & VA Home Purchase Loans
B) Conventional Home Purchase Loans
C) Refinancings
D) Home Improvement Loans
F) Non-occupant Loans on < 5 Family Dwellings (A B C & D)
Number
Average Value
Number
Average Value
Number
Average Value
Number
Average Value
Number
Average Value
LOANS ORIGINATED
2
$86,705
22
$49,705
61
$64,999
13
$11,317
4
$45,660
APPLICATIONS APPROVED, NOT ACCEPTED
0
$0
6
$55,190
7
$63,184
1
$10,150
1
$80,710
APPLICATIONS DENIED
0
$0
37
$42,655
33
$55,414
9
$10,506
2
$39,435
APPLICATIONS WITHDRAWN
0
$0
7
$43,419
25
$58,738
2
$24,905
1
$58,570
FILES CLOSED FOR INCOMPLETENESS
0
$0
0
$0
3
$55,960
0
$0
0
$0
Aggregated Statistics For Year 2000 (Based on 2 partial tracts)
A) FHA, FSA/RHS & VA Home Purchase Loans
B) Conventional Home Purchase Loans
C) Refinancings
D) Home Improvement Loans
F) Non-occupant Loans on < 5 Family Dwellings (A B C & D)
Number
Average Value
Number
Average Value
Number
Average Value
Number
Average Value
Number
Average Value
LOANS ORIGINATED
4
$56,498
24
$64,664
17
$54,259
14
$11,003
2
$32,745
APPLICATIONS APPROVED, NOT ACCEPTED
1
$25,830
15
$42,338
8
$48,195
3
$8,763
2
$16,605
APPLICATIONS DENIED
0
$0
28
$43,402
31
$45,198
16
$7,725
4
$36,780
APPLICATIONS WITHDRAWN
0
$0
2
$71,025
19
$42,673
0
$0
0
$0
FILES CLOSED FOR INCOMPLETENESS
0
$0
0
$0
3
$56,573
0
$0
0
$0
Aggregated Statistics For Year 1999 (Based on 1 partial tract)
A) FHA, FSA/RHS & VA Home Purchase Loans
B) Conventional Home Purchase Loans
C) Refinancings
D) Home Improvement Loans
F) Non-occupant Loans on < 5 Family Dwellings (A B C & D)
Detailed PMIC statistics for the following Tracts:0321.00
2002 - 2018 National Fire Incident Reporting System (NFIRS) incidents
Based on the data from the years 2002 - 2018 the average number of fire incidents per year is 6. The highest number of fires - 19 took place in 2012, and the least - 0 in 2003. The data has a growing trend.
When looking into fire subcategories, the most reports belonged to: Outside Fires (54.5%), and Structure Fires (36.4%).
Fire incident types reported to NFIRS in Zip Code 71039


 Nearest zip codes: 71073, 71024, 71023, 71045, 71068, 71037.


 Based on the data from the years 2002 - 2018 the average number of fire incidents per year is 6. The highest number of fires - 19 took place in 2012, and the least - 0 in 2003. The data has a growing trend.
 When looking into fire subcategories, the most reports belonged to: Outside Fires (54.5%), and Structure Fires (36.4%).